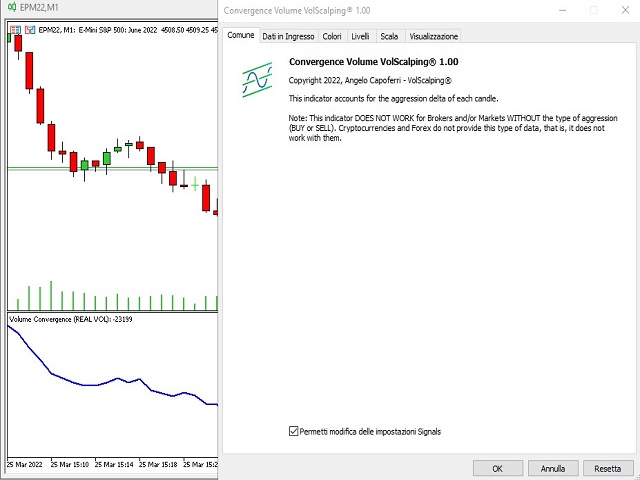
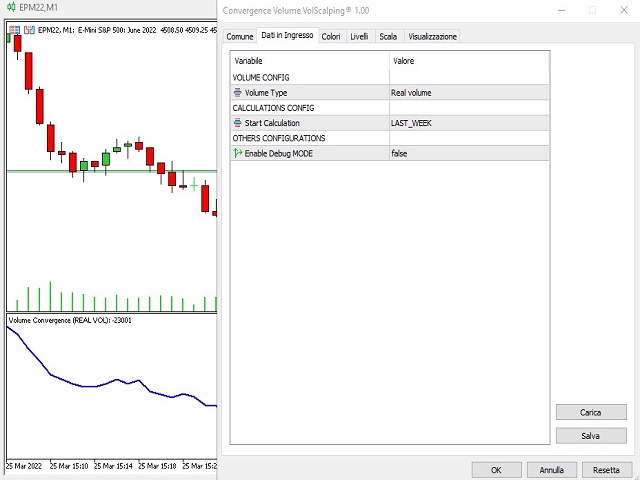
Volume Convergence
- Indikatoren
- Angelo Capoferri
- Version: 1.0
- Aktivierungen: 5
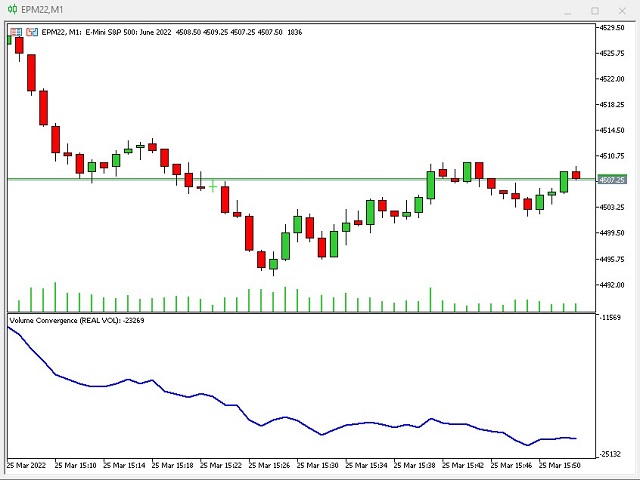
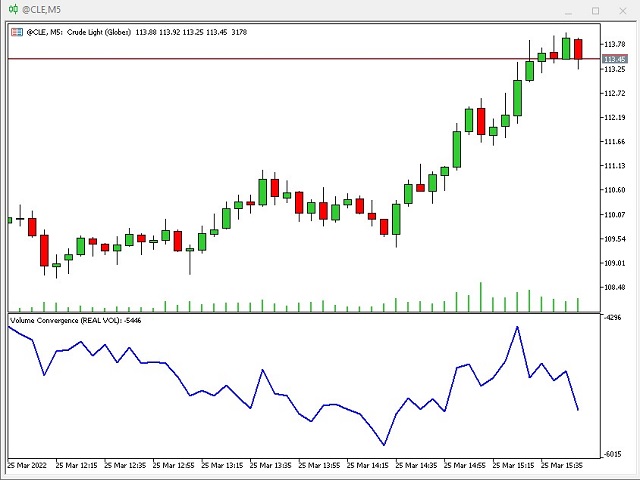
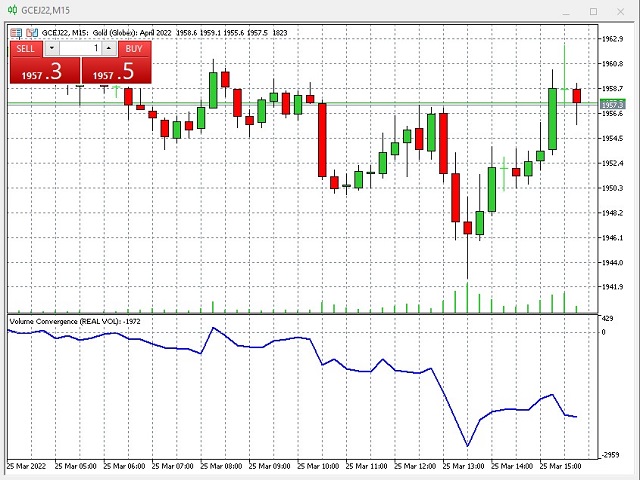
Dieser Indikator zeigt die Stärke des realen Volumens gegenüber dem Preis.
Wenn das Preisdiagramm und der Volumentrend den gleichen Trend haben, bedeutet dies, dass alles normal ist. weicht der Indikator vom Preisdiagramm ab, bedeutet dies, dass die Umkehr nahe ist.
Wenn der Preis steigt und das „Volumenkonvergenz“-Diagramm fällt, bedeutet dies, dass Geld den Markt verlässt, die Verkäufer steigen und der Preis bald zu sinken beginnt.
umgekehrt, wenn die „Volumenkonvergenz“-Kurve nach oben geht, während die Preiskurve nach unten geht, bedeutet dies, dass Käufer auf der Unterseite kaufen und der Preis sich umkehren sollte.
Der Indikator muss mit einer gültigen Handelsstrategie kombiniert werden, um die falschen Signale derselben zu filtern.
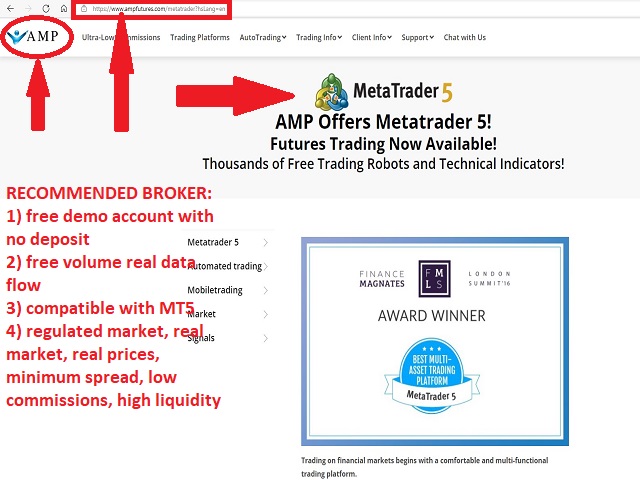
ACHTUNG: Der Indikator funktioniert NUR mit Brokern, die den realen volumetrischen Datenfluss anbieten, mit der Aufteilung der abgeschlossenen Kontrakte in BID AND ASK. CFDs, KRYPTOWÄHRUNGEN UND FOREX gehören zum synthetischen, unregulierten Markt, daher haben sie diese Informationen nicht und folglich funktioniert der Indikator nicht.
Ein mit mt5 kompatibler Broker, der echten Datenfluss auf dem Demokonto bietet, ohne dass eine Einzahlung erforderlich ist, ist AMP FUTURE.