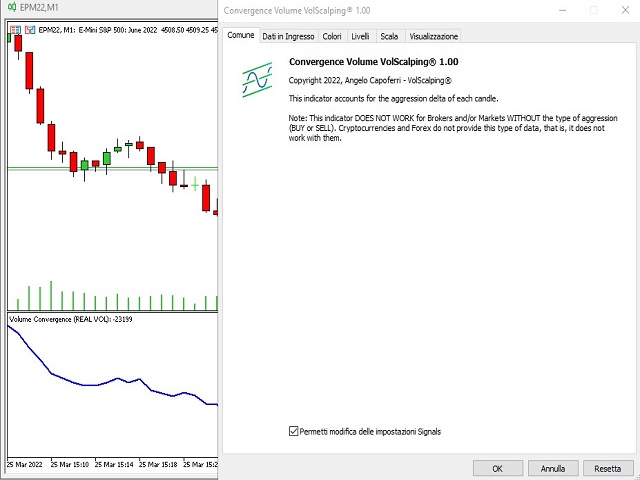
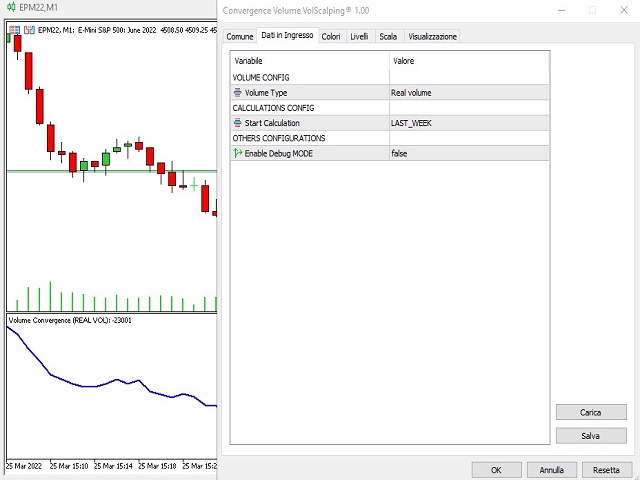
Volume Convergence
- インディケータ
- Angelo Capoferri
- バージョン: 1.0
- アクティベーション: 5
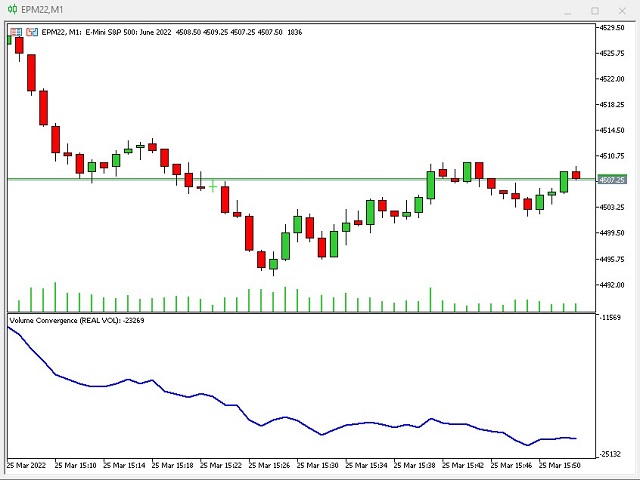
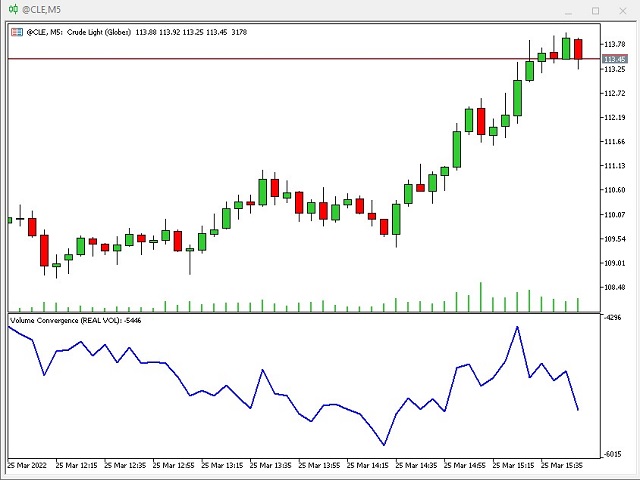
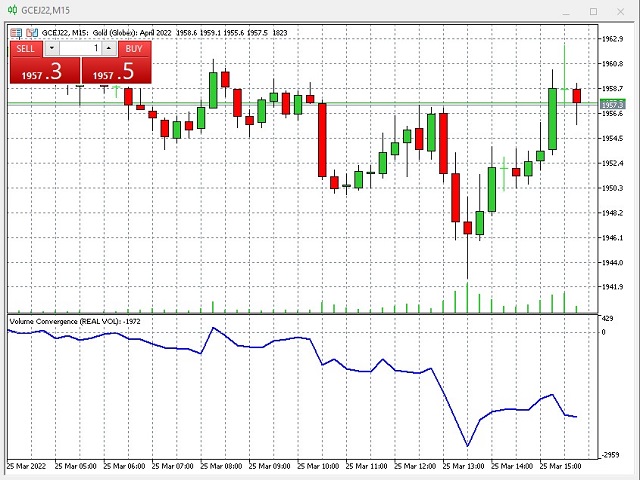
この指標は、価格に対する実際のボリュームの強さを示します。
価格チャートとボリュームトレンドが同じトレンドである場合、それはすべてが規則的であることを意味します。指標が価格チャートから逸脱している場合、それは反転が近いことを意味します。
価格が上昇し、「ボリュームコンバージェンス」チャートが下がると、それはお金が市場から出て、売り手が上昇して売り、価格がすぐに急落し始めることを意味します。
逆に、「出来高収束」グラフが上昇し、価格グラフが下降した場合、それは買い手がマイナス面で購入していることを意味し、価格は逆転するはずです。
インジケーターは、同じの誤ったシグナルをフィルタリングするために有効な取引戦略と組み合わせる必要があります。
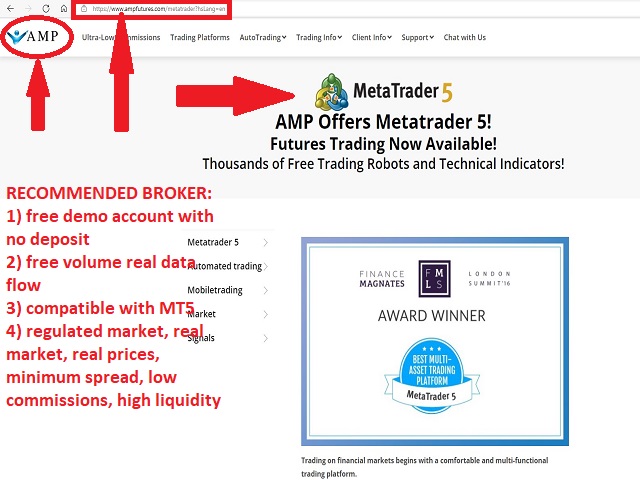
注意:インジケーターは、実際のボリュームデータフローを提供するブローカーでのみ機能し、BIDANDASKで契約が分割されます。 CFD、暗号通貨、外国為替は合成の規制されていない市場に属しているため、これらの情報はなく、その結果、インジケーターは機能しません。
デポジットを必要とせずにデモ口座で実際のデータフローを提供するmt5と互換性のあるブローカーは、AMPFUTUREです。