Supply Demand RSJ PRO
- Indikatoren
- JETINVEST
- Version: 1.0
- Aktivierungen: 20
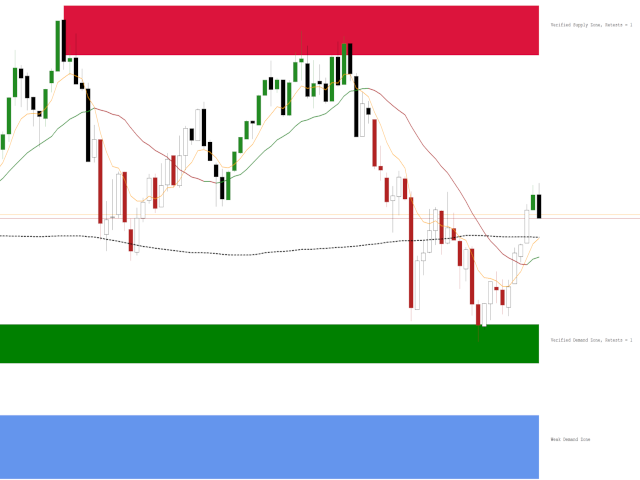
Der Indikator Angebotsnachfrage RSJ PRO berechnet und zeichnet die Zonen "Angebot" und "Nachfrage" auf dem Diagramm, identifiziert den Zonentyp (schwach, stark, verifiziert, nachgewiesen) und zeigt im Falle von erneuten Tests der Zone an, wie oft es ist wurde erneut getestet.
"Angebots"-Zonen sind die Preiszonen, in denen mehr Angebot als Nachfrage aufgetreten ist, was die Preise nach unten treibt.
"Nachfrage"-Zonen sind die Preiszonen, in denen mehr Nachfrage als Angebot aufgetreten ist, was die Preise nach oben treibt.
Einteilung der Zonen
- Schwach: Preisregion, die bei erneutem Test wahrscheinlich verletzt wird.
- Stark: Preisregion, die die Trendrichtung geändert hat und die wahrscheinlich nicht so schnell erneut getestet wird.
- Verifiziert: Starke Preisregion, in der es höchstens 1 bis 3 Retests gab, aber der Preis die Region nicht durchbrechen konnte.
- Nachgewiesen: Starke Preisregion, in der es 3 oder mehr Retests gab, aber der Preis die Region nicht durchbrach.
- Broken/Turncoat: Preisregion, die durchbrochen wird und bei Unterstützung zu einem Widerstand und bei einem Widerstand zu einer Unterstützung wird.
Einstellungen
- Visuelle Einstellungen:
- Schwache Zonen anzeigen: Als schwach eingestufte Zonen werden angezeigt.
- Ungetestete Zonen anzeigen: Ungetestete Zonen werden angezeigt.
- Gebrochene Zonen anzeigen: Die durchbrochenen Zonen werden angezeigt
- Zonen zusammenführen: Der Indikator verwandelt sehr nahe Zonen in eine breitere Zone
- Zonen erweitern: Der Indikator prüft, ob es frühere Grenzen gibt, die den gezeichneten Zonen entsprechen, und erweitert diese
- Berechnungseinstellungen:
- Num Candles For Analysis: Anzahl der Kerzen, die der Indikator verwendet, um Zonen zu klassifizieren. Es können zwischen 500 und 5000 Kerzen sein.
- ATR-Periode: Zeitraum zur Berechnung der ATR
- ATR-Faktor: Multiplikator für die Berechnung von ATR
- Fast Fractal Factor: Schneller Multiplikator, angewendet auf den aktuellen Chart-Zeitrahmen
- Slow Fractal Factor: Langsamer Multiplikator, angewendet auf den aktuellen Chart-Zeitrahmen
- Etiketteneinstellungen:
- Labels anzeigen: Wenn aktiviert, wird Text neben den Zonen angezeigt, der den Zonentyp und die Anzahl der Wiederholungstests, falls zutreffend, informiert.
- Schriftfarbe: Legen Sie die Farbe der Texte fest
- Schriftgröße: Schriftgröße einstellen
Benachrichtigungseinstellungen
- Pop-up
- Ton (Es stehen 13 Tonarten zur Verfügung.)
- Smartphone-Benachrichtigung
- Popup und Ton
- Popup- und Smartphone-Benachrichtigung
- Ton- und Smartphone-Benachrichtigung
- Popup-, Sound- und Smartphone-Benachrichtigung
Falls du noch Fragen hast, kontaktiere mich bitte per Direktnachricht: https://www.mql5.com/de/users/robsjunqueira/


Der Benutzer hat keinen Kommentar hinterlassen