Supply Demand RSJ PRO
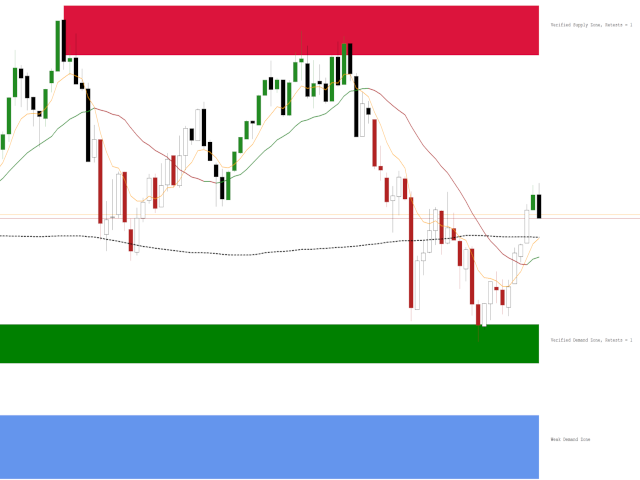
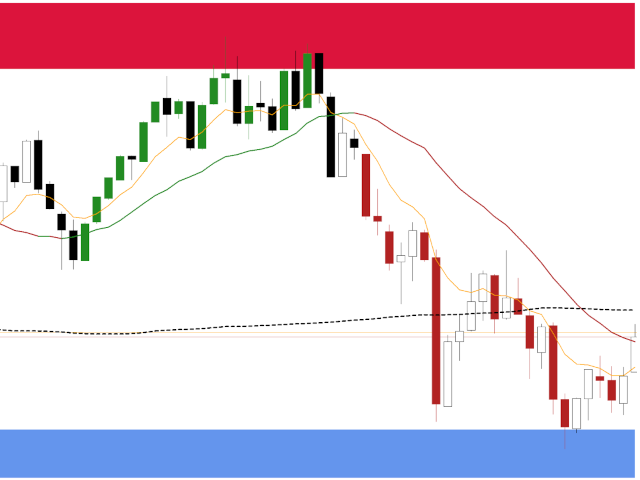
インジケータSupplyDemand RSJ PROは、グラフ上に「Supply」ゾーンと「Demand」ゾーンを計算してプロットし、ゾーンのタイプ(弱い、強い、検証済み、証明済み)を識別し、ゾーンの再テストの場合は、その回数を示します。 再テストされました。
「供給」ゾーンは、需要よりも供給が多く発生し、価格が下がる価格ゾーンです。
「需要」ゾーンは、供給よりも多くの需要が発生し、価格を押し上げる価格ゾーンです。
ゾーンの分類
- 弱い:再テストされた場合、違反される可能性が高い価格地域。
- 強い:トレンドの方向を変えており、すぐに再テストされる可能性が低い価格地域。
- 検証済み:価格が高い地域。最大で1〜3回の再テストがありましたが、価格が地域を破ることはできませんでした。
- 実証済み:3回以上の再テストがあったが、価格がこの地域を突破できなかった、価格の高い地域。
- 壊れた/ターンコート:壊れた価格領域。サポートの場合は抵抗になり、サポートの場合は抵抗になります。
設定
- 視覚的な設定:
- 弱いゾーンを表示:弱いゾーンとして分類されたゾーンが表示されます。
- テストされていないゾーンを表示:テストされていないゾーンが表示されます。
- 壊れたゾーンを表示:違反したゾーンが表示されます
- ゾーンのマージ:インジケーターは非常に近いゾーンをより広いゾーンに変換します
- ゾーンの拡張:インジケーターは、描画されたゾーンに対応する以前の制限があるかどうかを確認し、同じように拡張します
- 計算設定:
- 分析用キャンドルの数:インジケーターがゾーンの分類に使用するキャンドルの数。 それは500から5000キャンドルの間である可能性があります。
- ATR期間:ATRの計算に使用される期間
- ATR係数:ATRの計算に適用される乗数
- Fast Fractal Factor:現在のチャートの時間枠に適用されたFast Multiplier
- 遅いフラクタル係数:現在のチャートの時間枠で適用される遅い乗数
- ラベル設定:
- ラベルの表示:アクティブな場合、ゾーンのタイプと再テストの数(該当する場合)を通知するテキストがゾーンの横に表示されます。
- フォントの色:テキストの色を設定します
- フォントサイズ:フォントサイズを設定します
アラート設定
- 現れる
- 音(13種類の音があります。)
- スマートフォン通知
- ポップアップとサウンド
- ポップアップとスマートフォンの通知
- 音とスマートフォンの通知
- ポップアップ、サウンド、スマートフォンの通知
それでも質問がある場合は、直接メッセージで私に連絡してください: https://www.mql5.com/ja/users/robsjunqueira/


ユーザーは評価に対して何もコメントを残しませんでした