NAM Divergences
- Indikatoren
- NAM TECH GROUP, CORP.
- Version: 1.5
- Aktualisiert: 16 Mai 2021
- Aktivierungen: 10
MT4 Multi-Timeframe-Divergenz- und Overbougt / Oversold-Erkennungsanzeige.
Eigenschaften
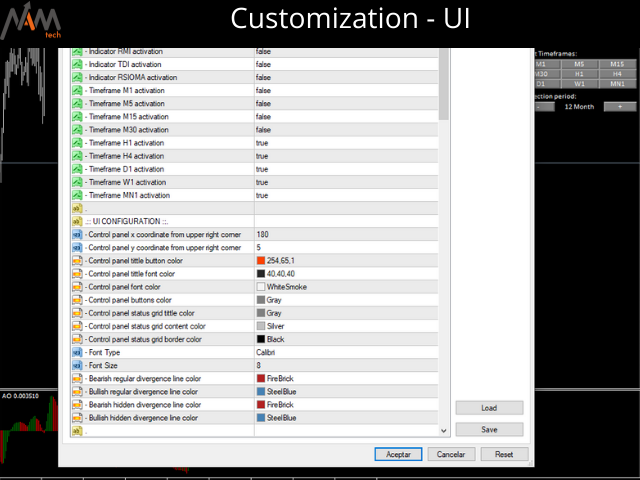
- Vollständig anpassbar auf dem Diagrammbedienfeld, bietet vollständige Interaktion.
- Verstecken und zeigen Sie das Bedienfeld, wo immer Sie möchten.
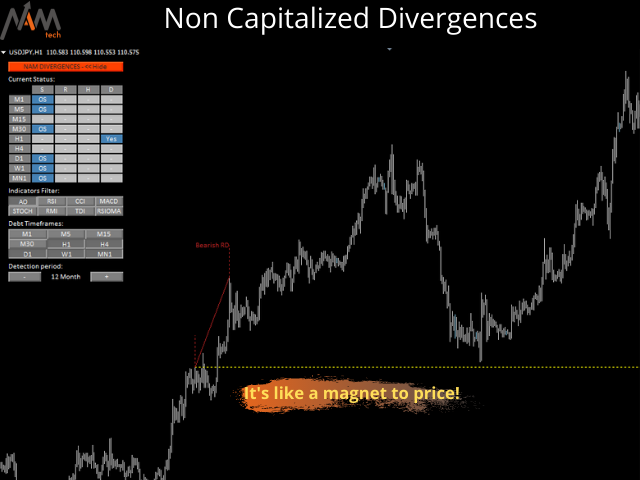
- Echtzeitinformationen zu nicht kapitalisierten Abweichungen.
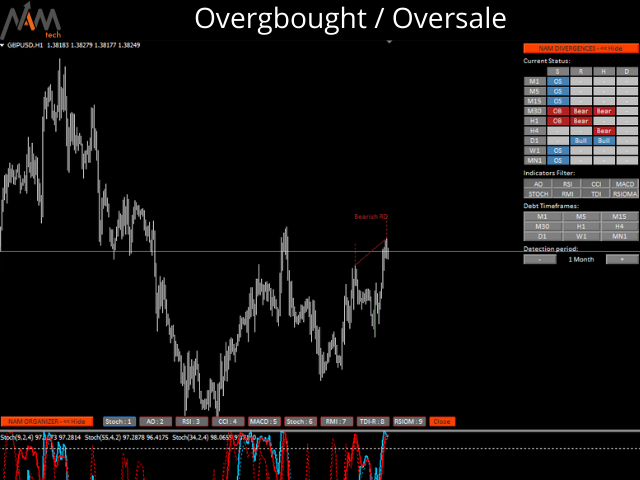
- Echtzeitinformationen über überkaufte / überverkaufte Situationen.
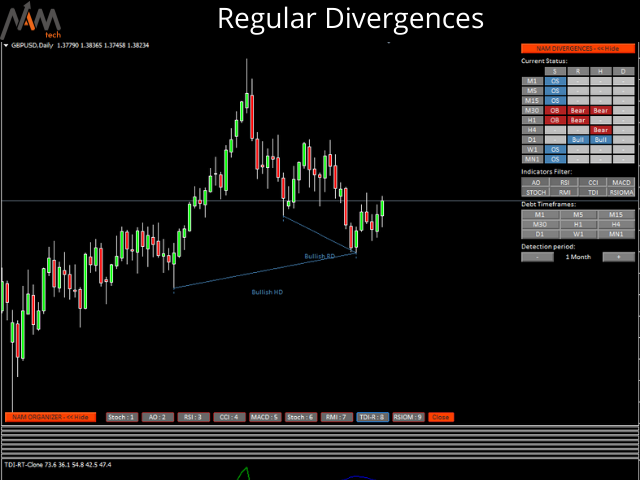
- Echtzeitinformationen über regelmäßige Abweichungen.
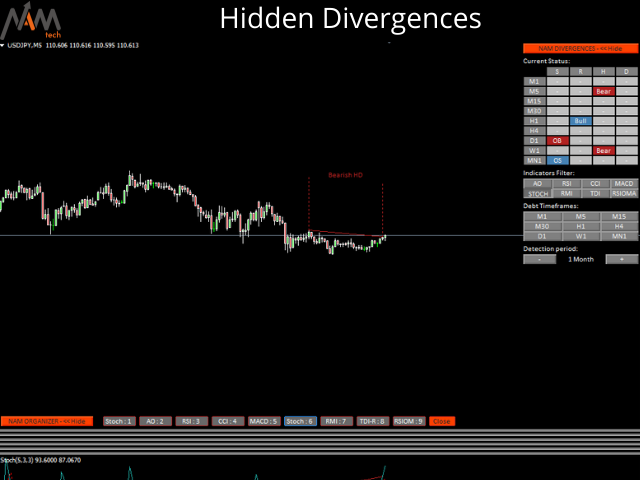
- Echtzeitinformationen zu versteckten Abweichungen.
- Für die Erkennung von Divergenzen verfügbare Oszillatoren: AO, RSI, CCI, MACD, STOCH, RMI, TDI, RSIOMA.
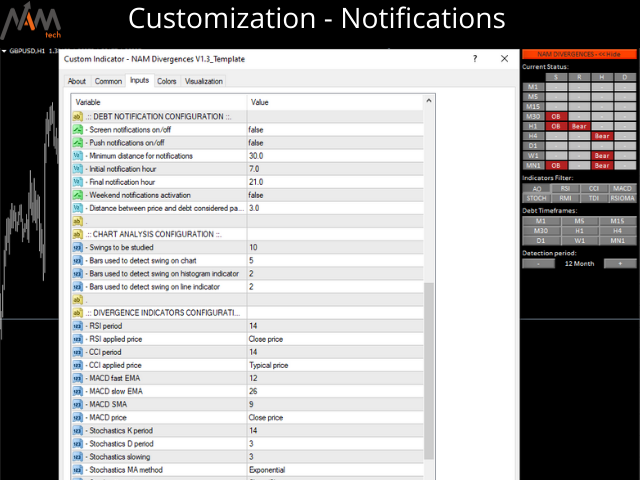
- Benachrichtigungsdienst (Bildschirmwarnungen | Push-Benachrichtigungen).
Zusammenfassung
Die Verwendung des Divergenzhandels kann nützlich sein, um einen schwächeren Trend oder eine Umkehrung der Dynamik zu erkennen. Manchmal können Sie es sogar als Signal für die Fortsetzung eines Trends verwenden. Unser Tool bietet Divergenzerkennung in allen Zeiträumen gleichzeitig in einem erstaunlich komfortablen und intuitiven Bedienfeld mit der Möglichkeit zum Ein- und Ausblenden, um Ihr Diagramm so sauber wie möglich zu halten.
Sie werden in Echtzeit überkaufte und überverkaufte Situationen, regelmäßige Abweichungen, versteckte Abweichungen und nicht kapitalisierte Abweichungen in der Historie der Wahl sehen.
Für nicht kapitalisierte Abweichungen haben wir Bildschirmbenachrichtigungen auf MT4 und Push-Benachrichtigungen auf Ihr Handy!
Muy completo y preciso... una pieza de relojería