NAM Divergences
- Indicadores
- NAM TECH GROUP, CORP.
- Versión: 1.5
- Actualizado: 16 mayo 2021
- Activaciones: 10
Indicador de detección de divergencias Multitimeframe y situaciones de sobreventa / sobreventa.
Características
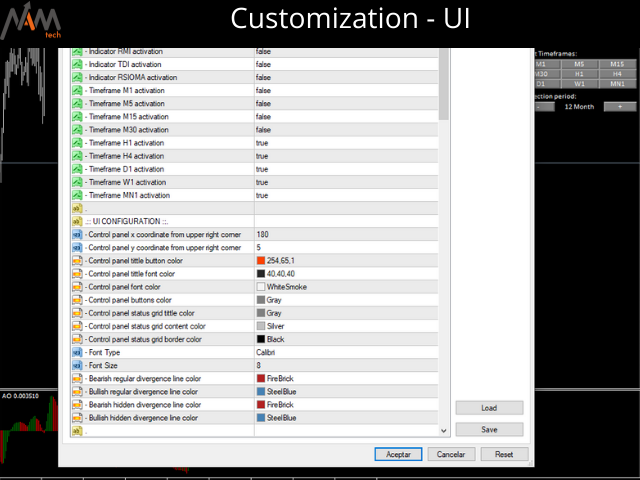
- Panel de control totalmente personalizable, proporciona una interacción completa.
- Oculta y muestra el panel de control donde quieras.
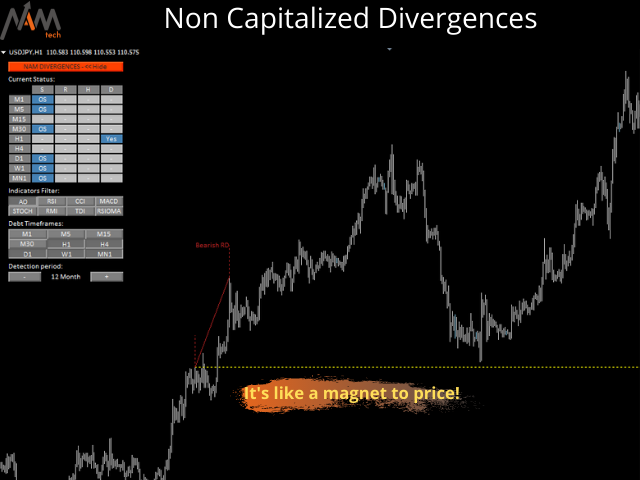
- Información en tiempo real sobre divergencias no capitalizadas.
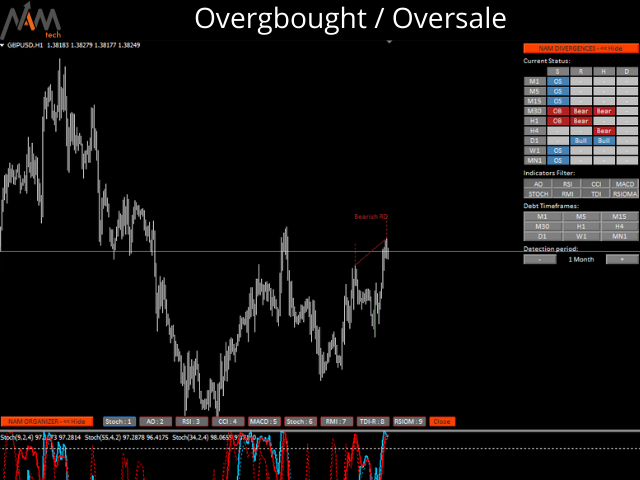
- Información en tiempo real sobre situaciones de sobrecompra / sobreventa.
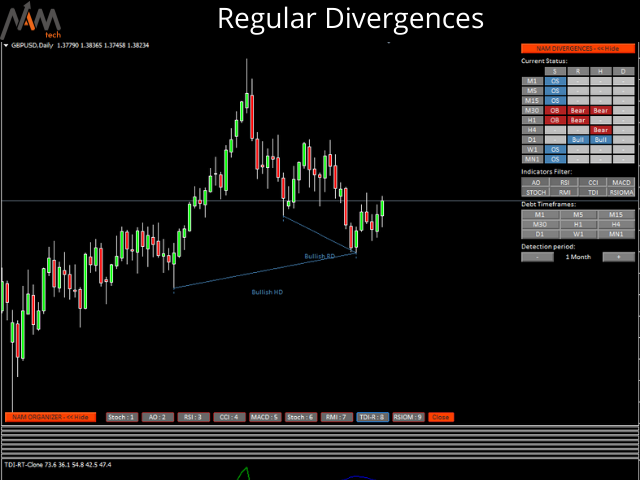
- Información en tiempo real sobre divergencias regulares.
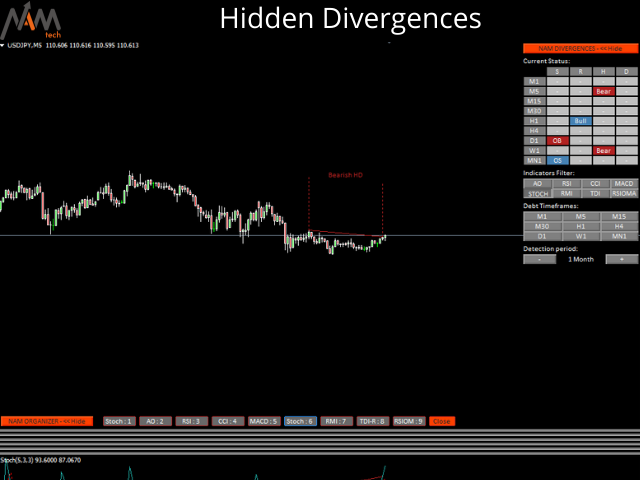
- Información en tiempo real sobre divergencias ocultas.
- Osciladores disponibles para detección de divergencias: AO, RSI, CCI, MACD, STOCH, RMI, TDI, RSIOMA.
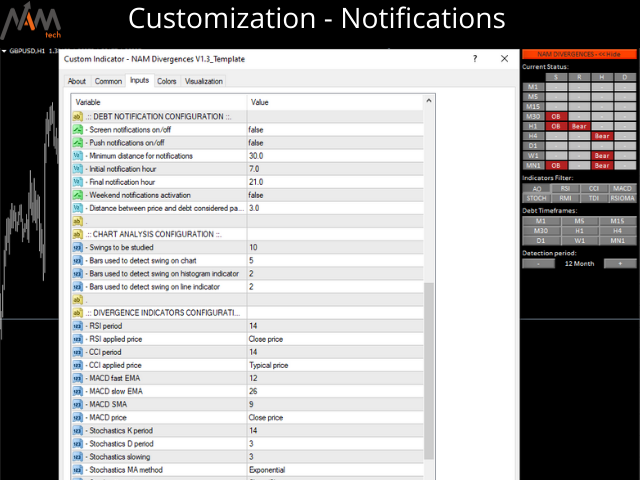
- Servicio de notificaciones (Alertas en pantalla | Notificaciones push).
Resumen
El uso de divergencias puede ser útil para detectar el debilitamiento de una tendencia. A veces, incluso pueden ser usadas como una señal de continuación de tendencias. Nuestra herramienta ofrece detección de divergencias en todos los timeframes simultáneamente, en un panel de control increíblemente cómodo e intuitivo con la posibilidad de mostrar y ocultar, para mantener su gráfico lo más limpio posible.
Ahora podrás ver en tiempo real situaciones de sobrecompra y sobreventa, divergencias regulares, divergencias ocultas y divergencias no capitalizadas en el período histórico de su elección. Para las divergencias no capitalizadas, tenemos notificaciones en pantalla en MT4 y notificaciones push en su teléfono móvil.
Muy completo y preciso... una pieza de relojería