Support and Resistance Screener Pro MT5
- Indikatoren
- STE S.S.COMPANY
- Version: 13.20
- Aktualisiert: 13 Dezember 2023
- Aktivierungen: 10
Support And Resistance Screener ist ein Level-Indikator für MetaTrader, der mehrere Tools innerhalb eines Indikators bietet. Die verfügbaren Werkzeuge sind:
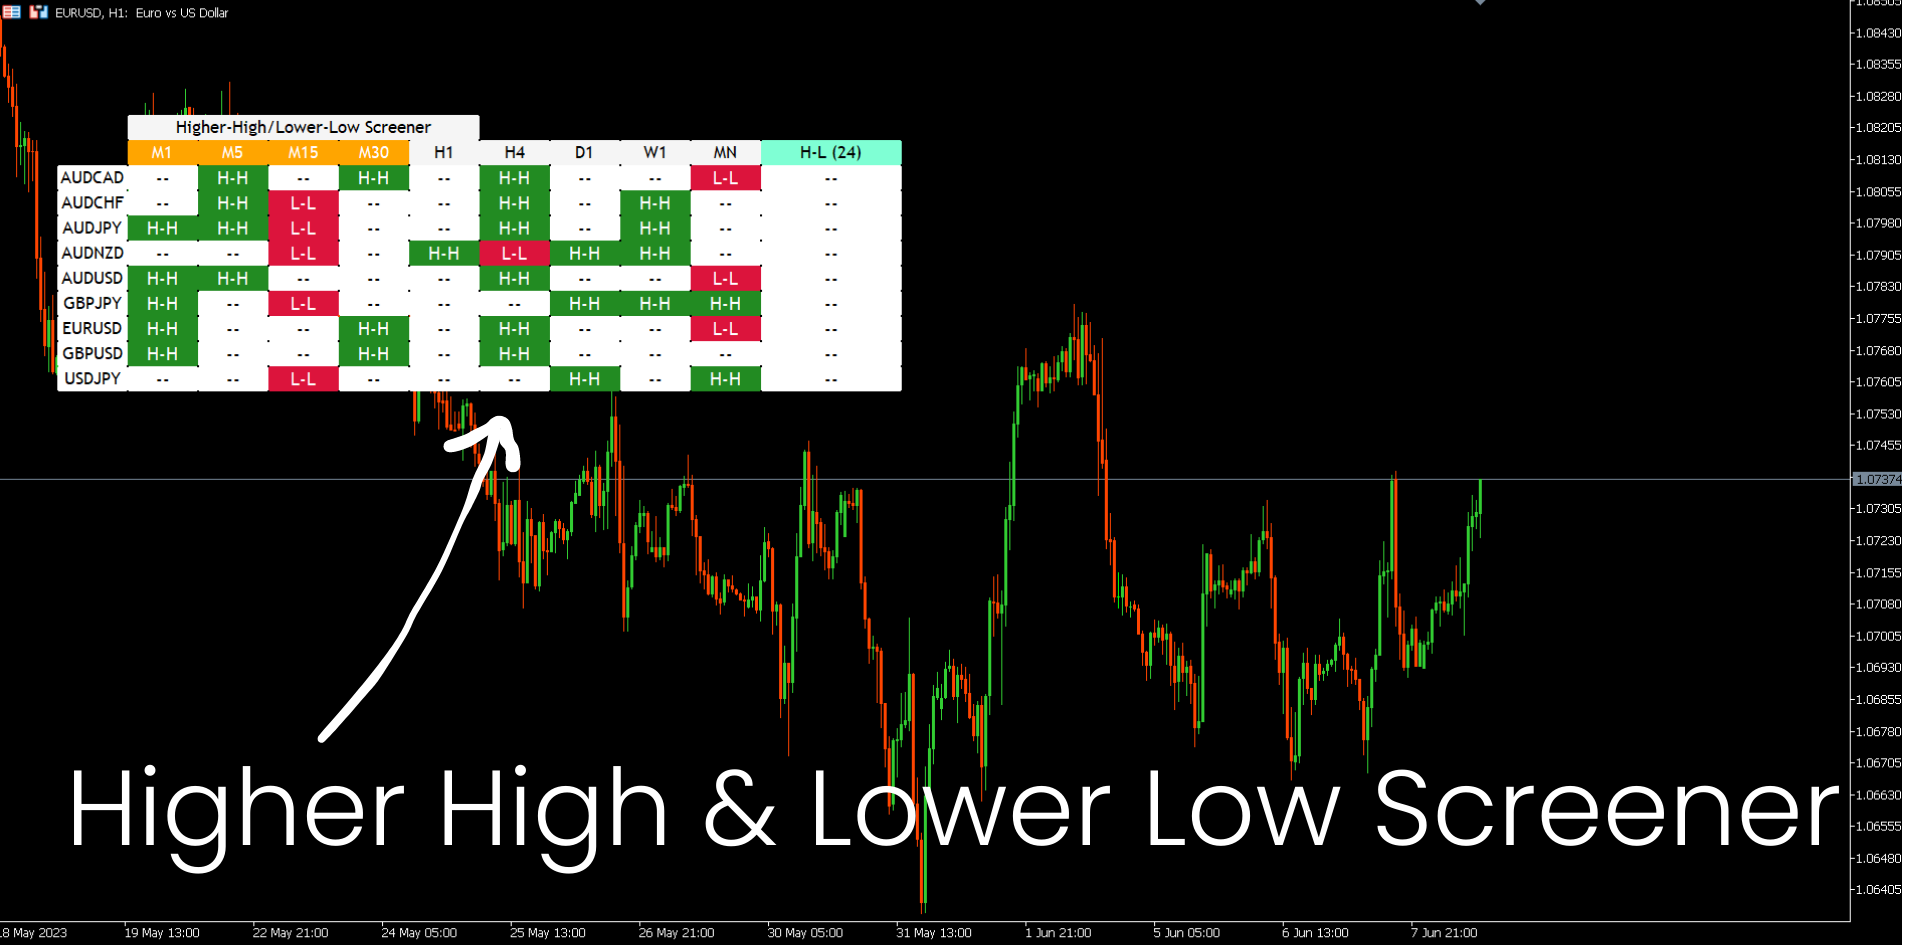
1. Marktstruktur-Screener.
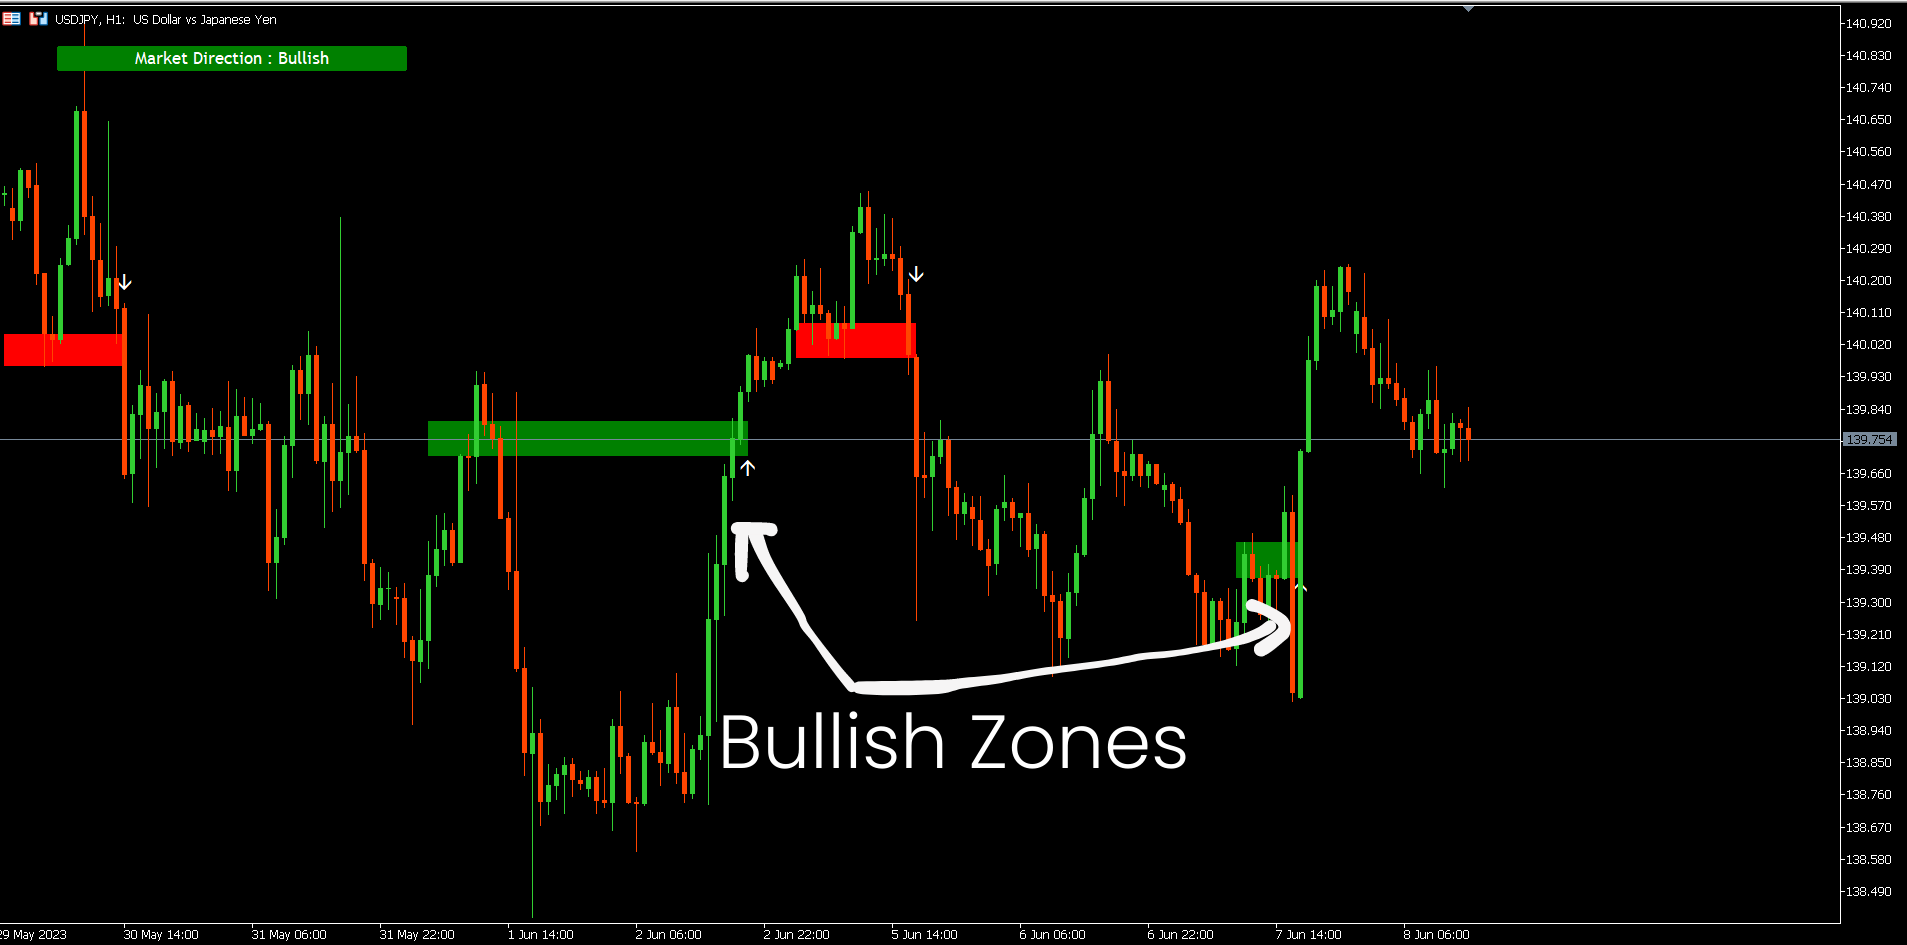
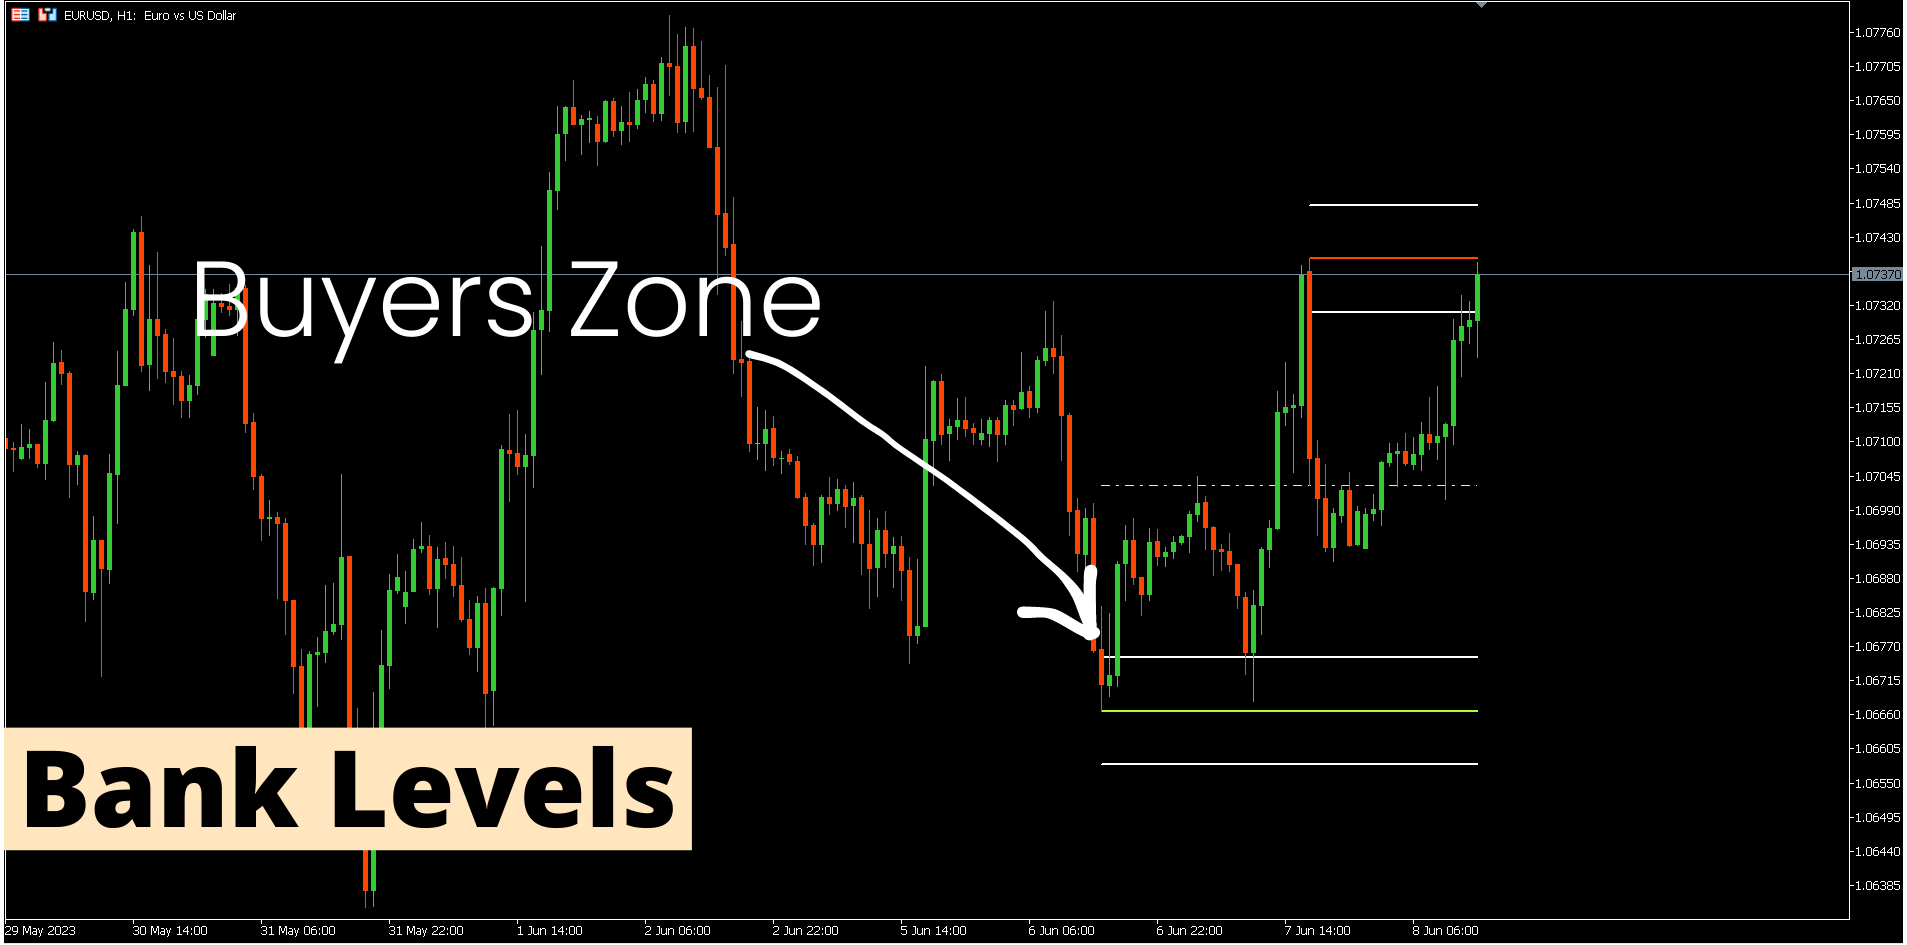
2. Bullische Pullback-Zone.
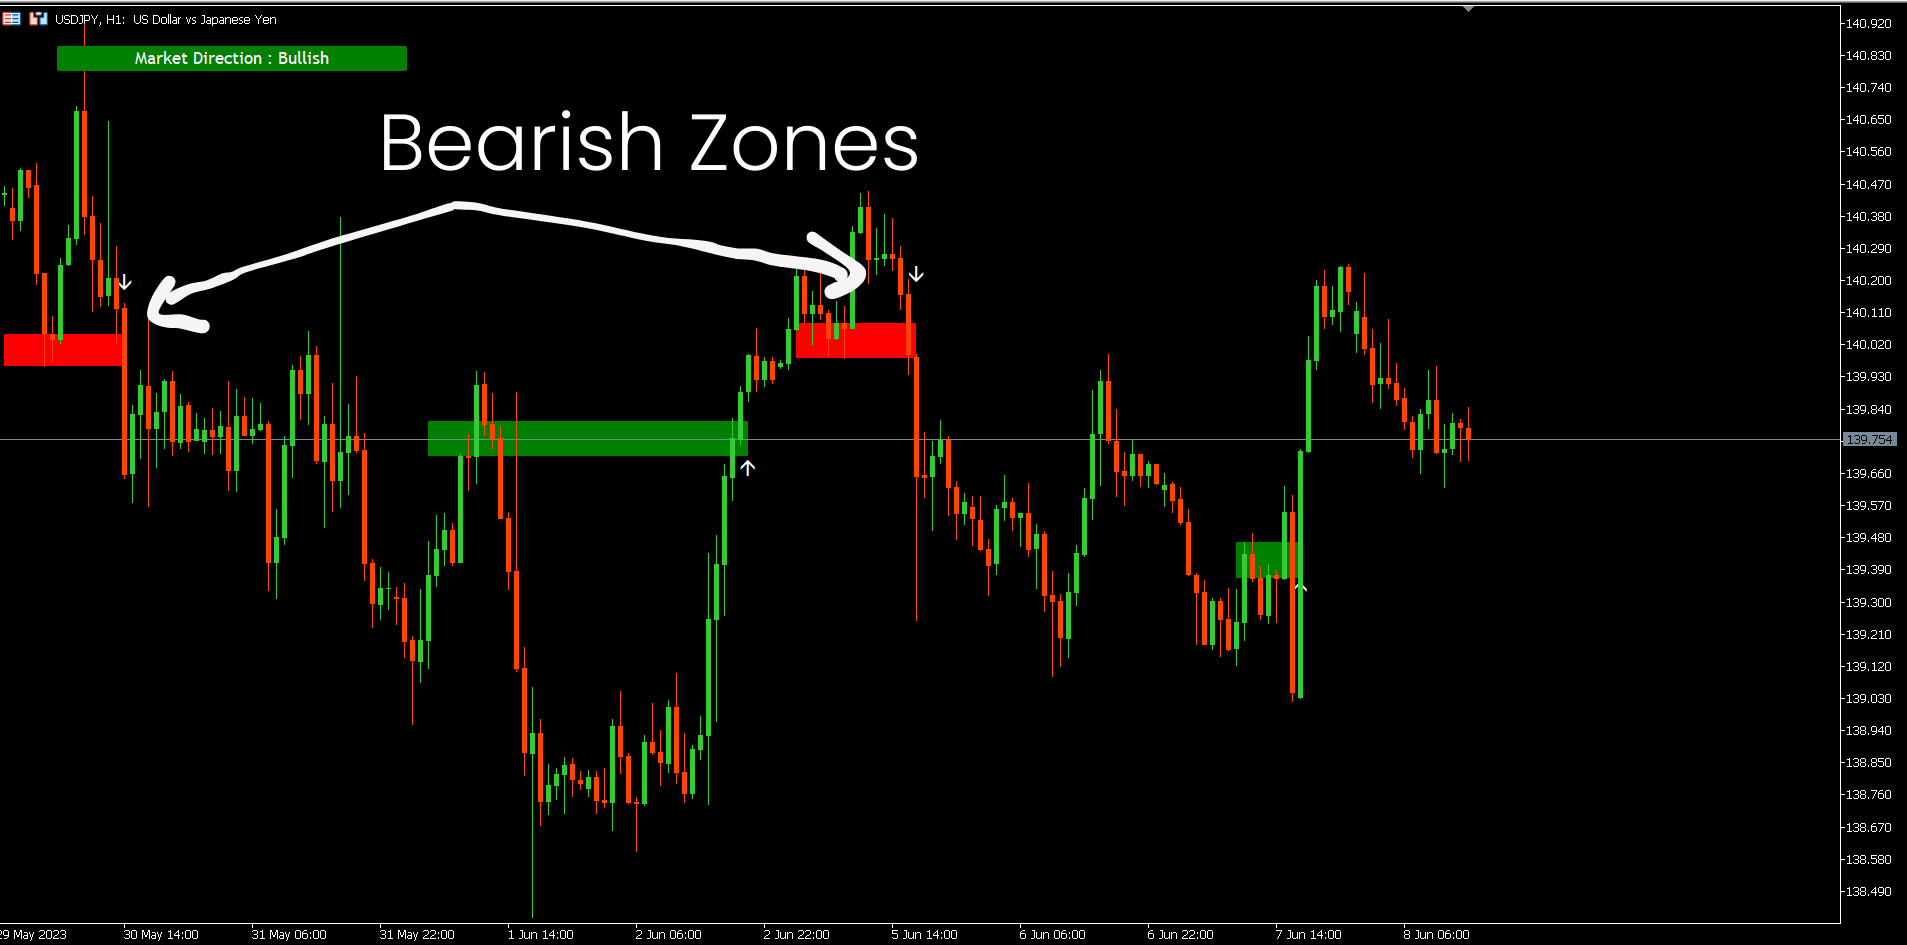
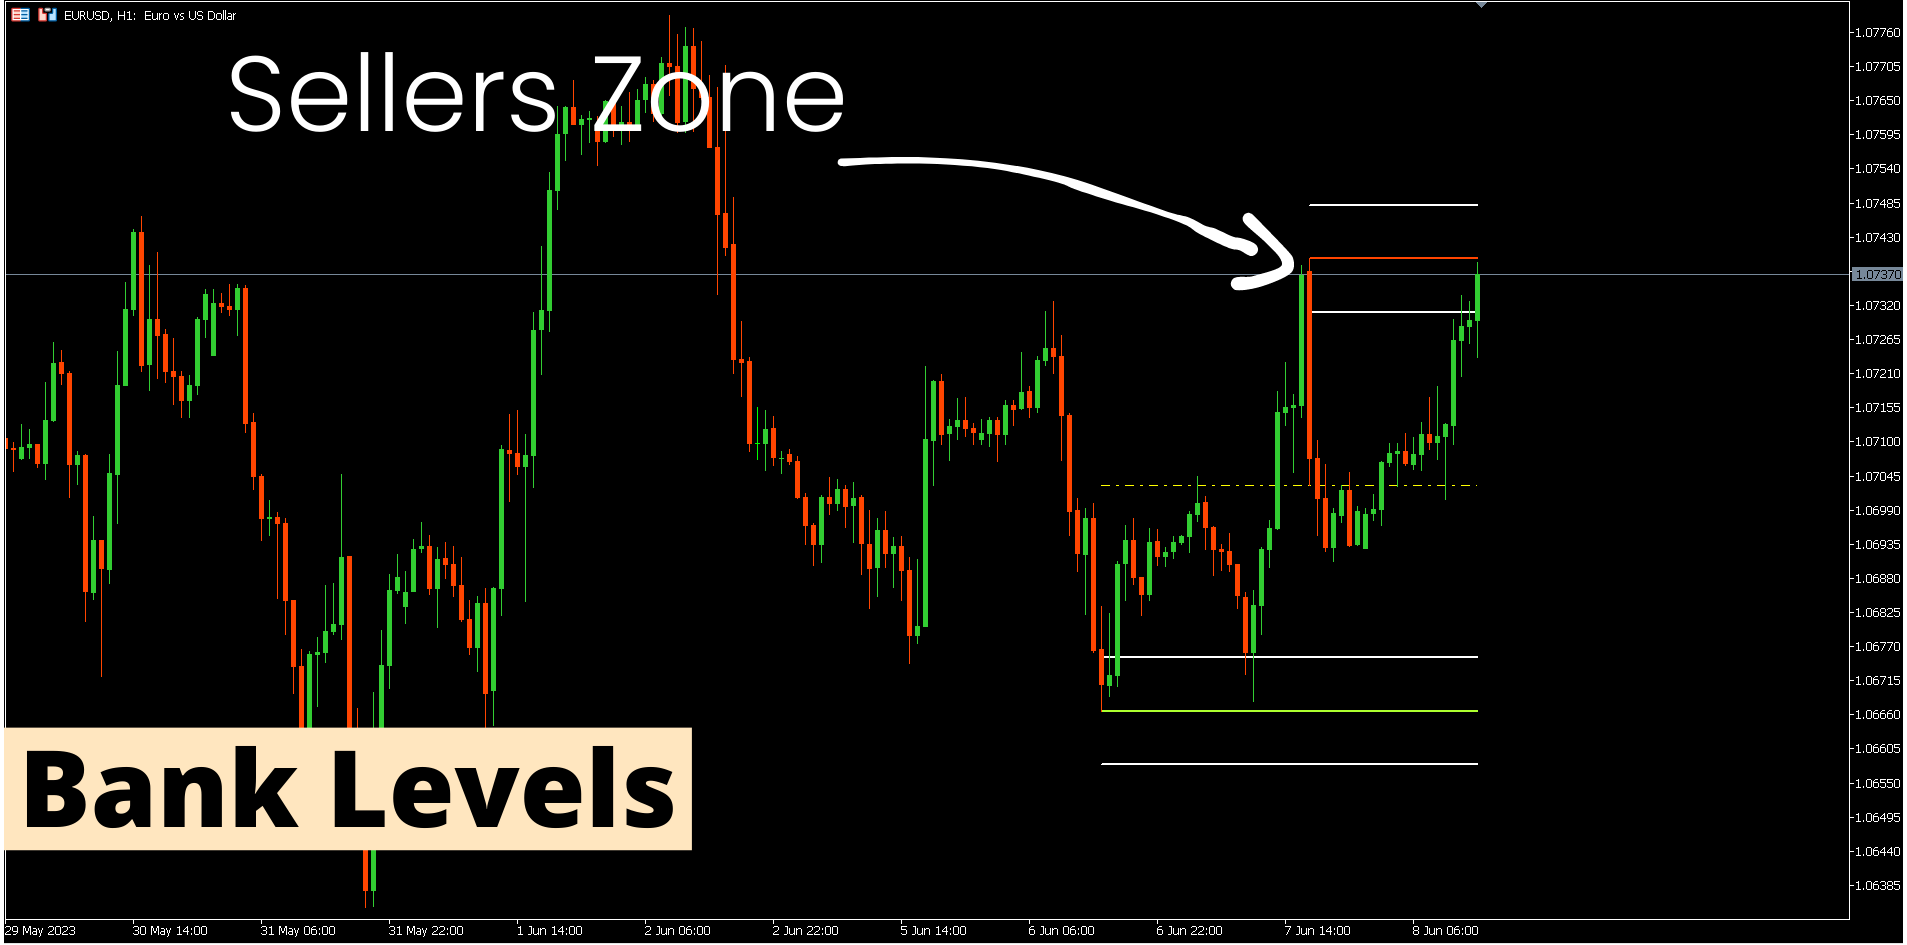
3. Bärische Pullback-Zone.
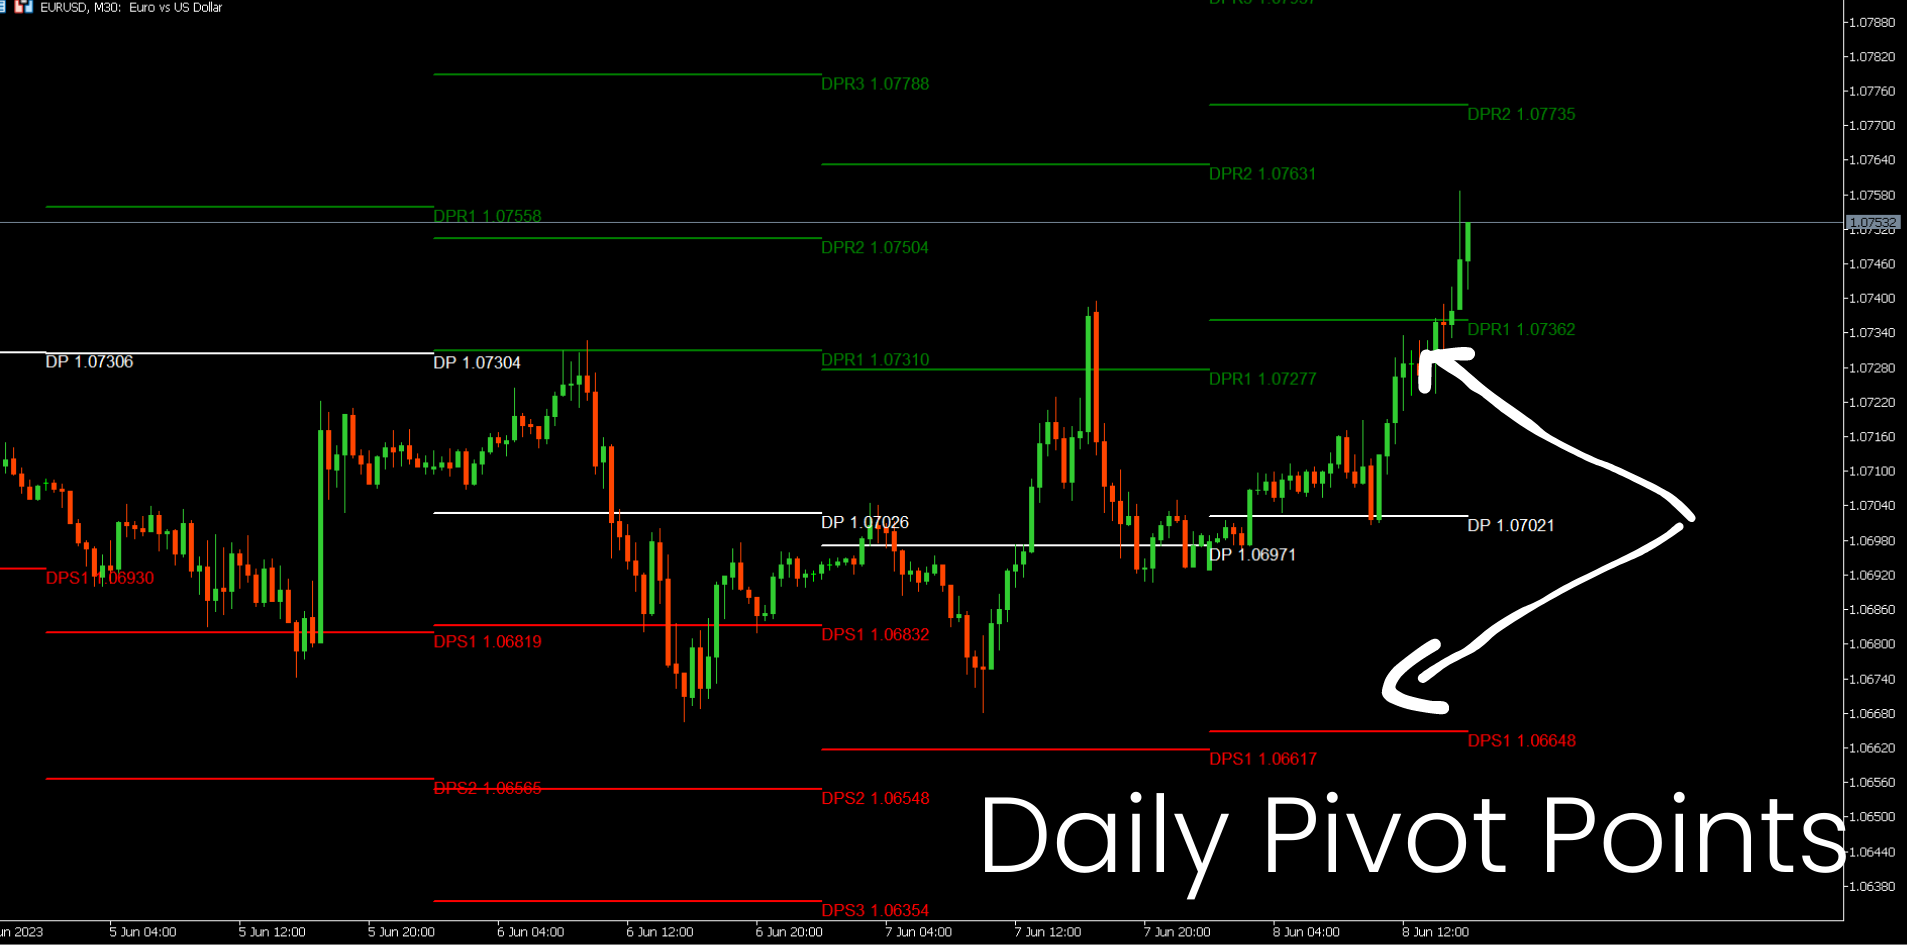
4. Tägliche Pivot-Punkte
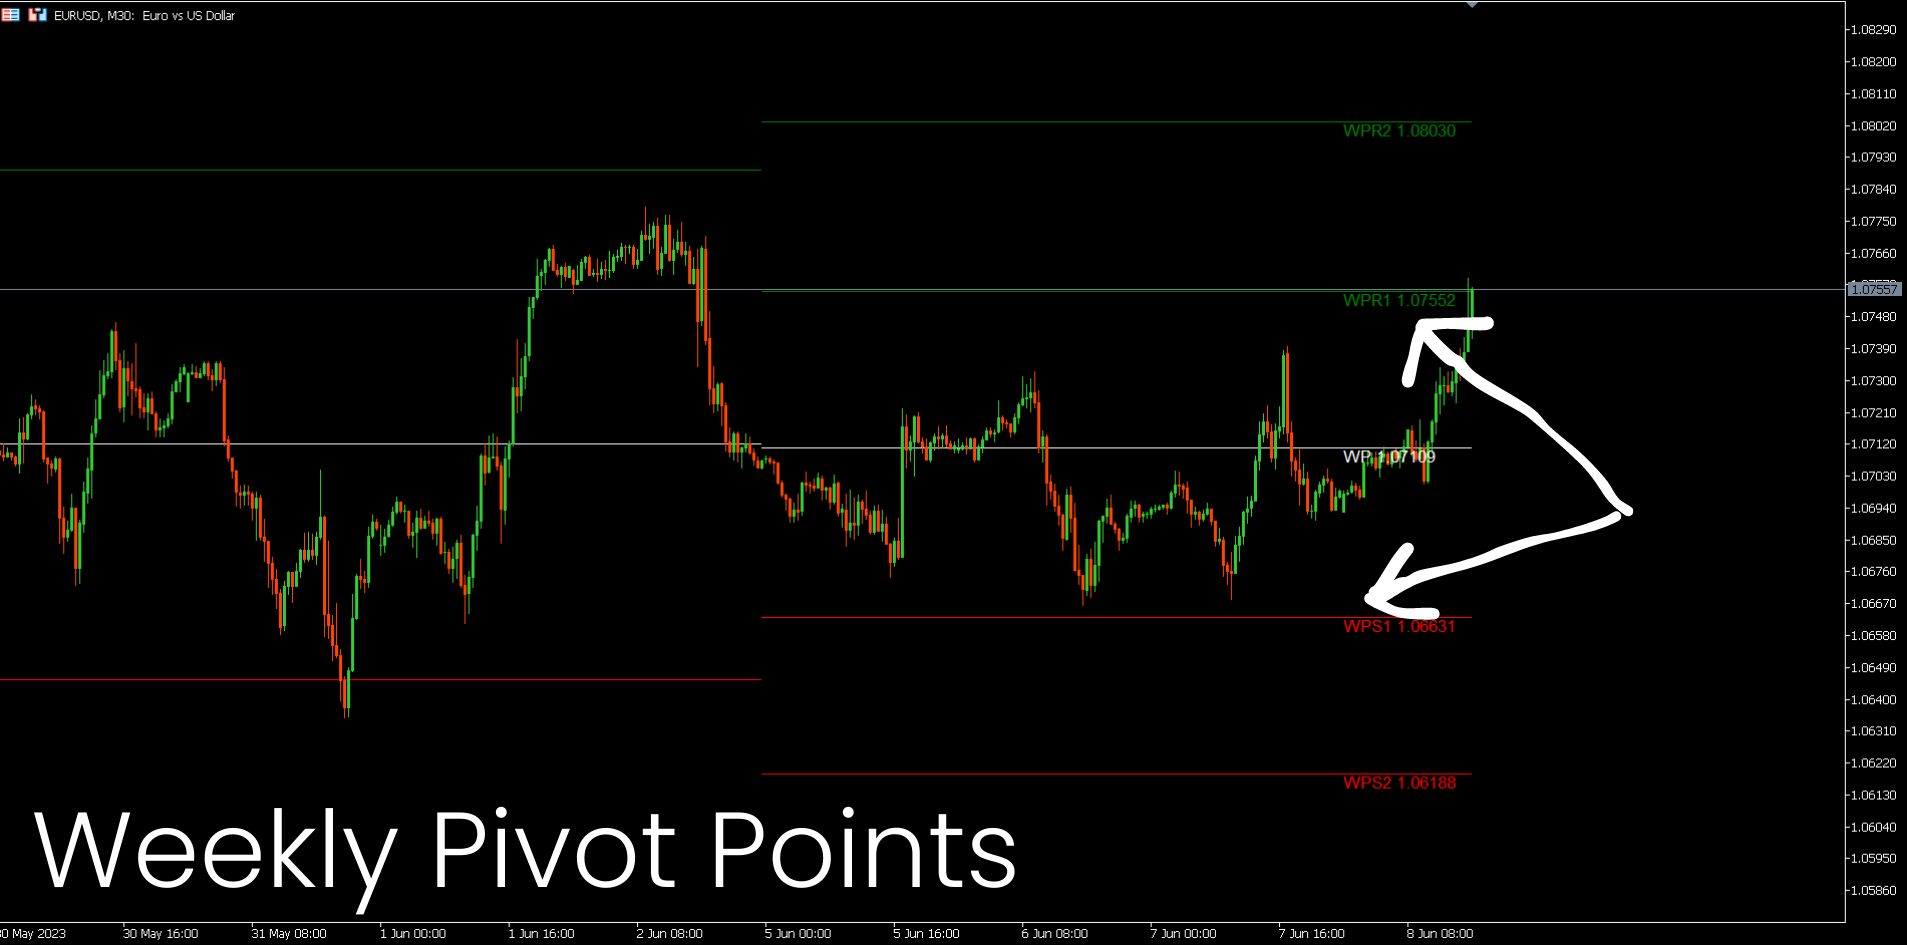
5. wöchentliche Pivots-Punkte
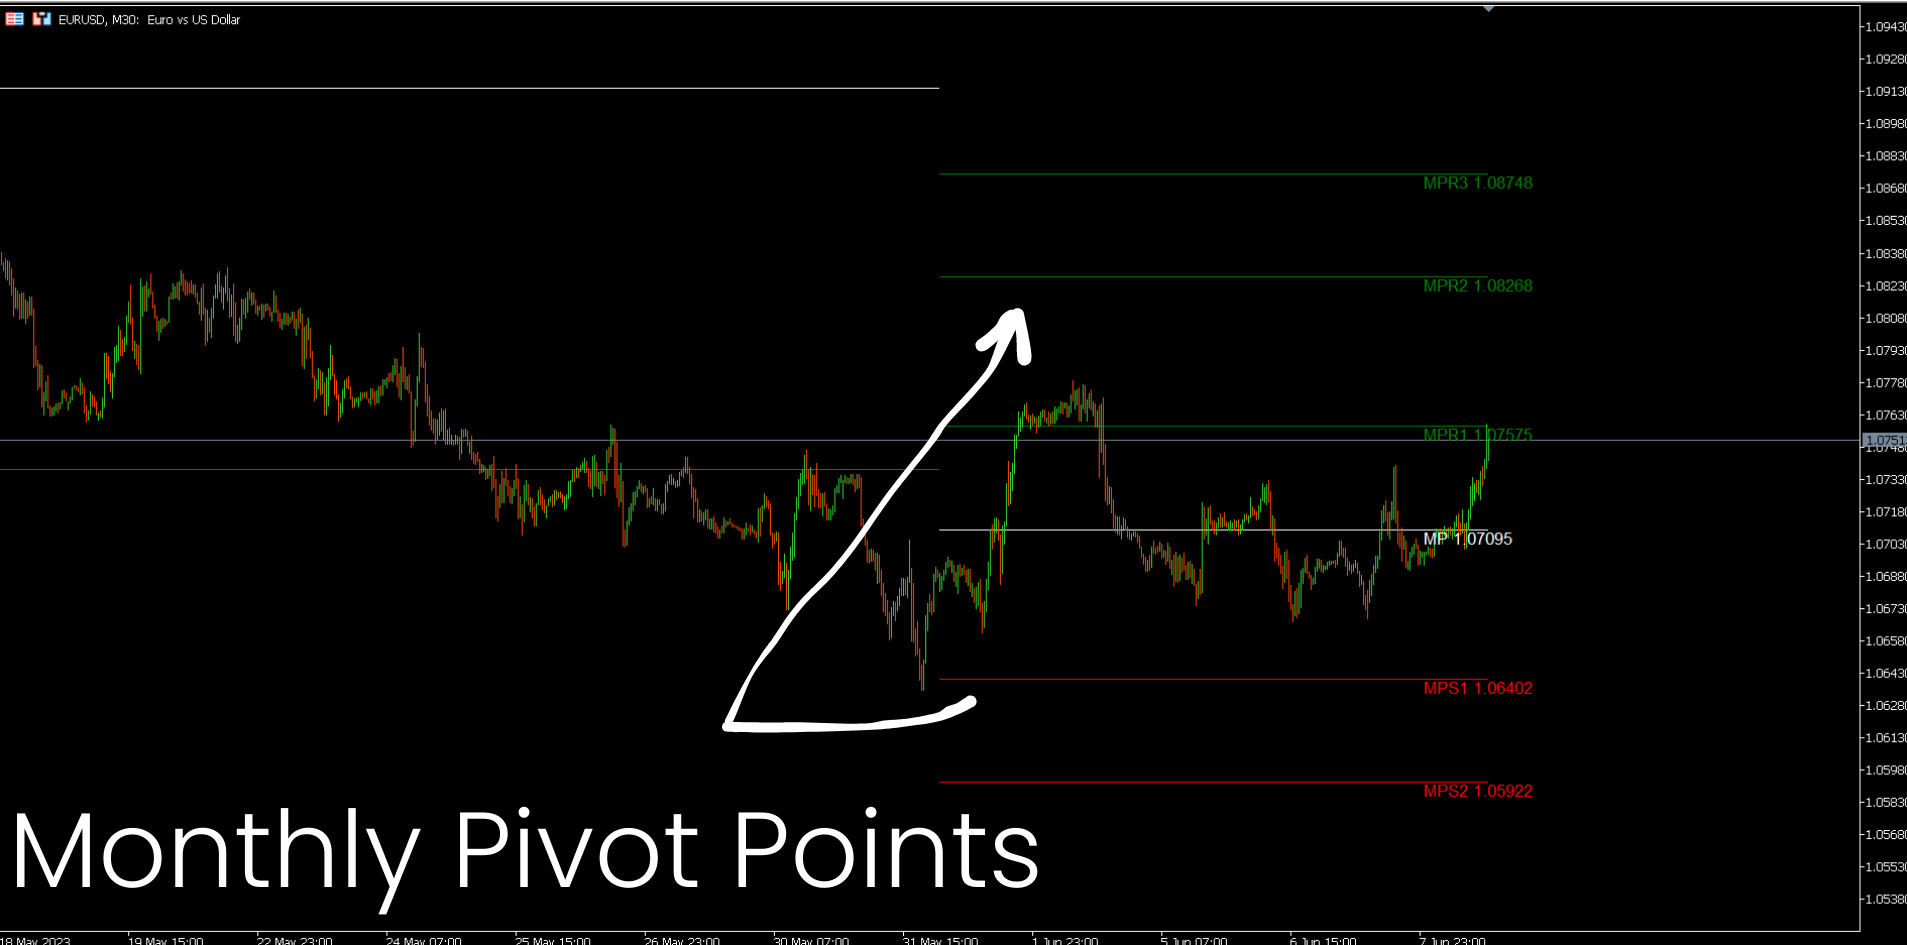
6. monatliche Pivots-Punkte
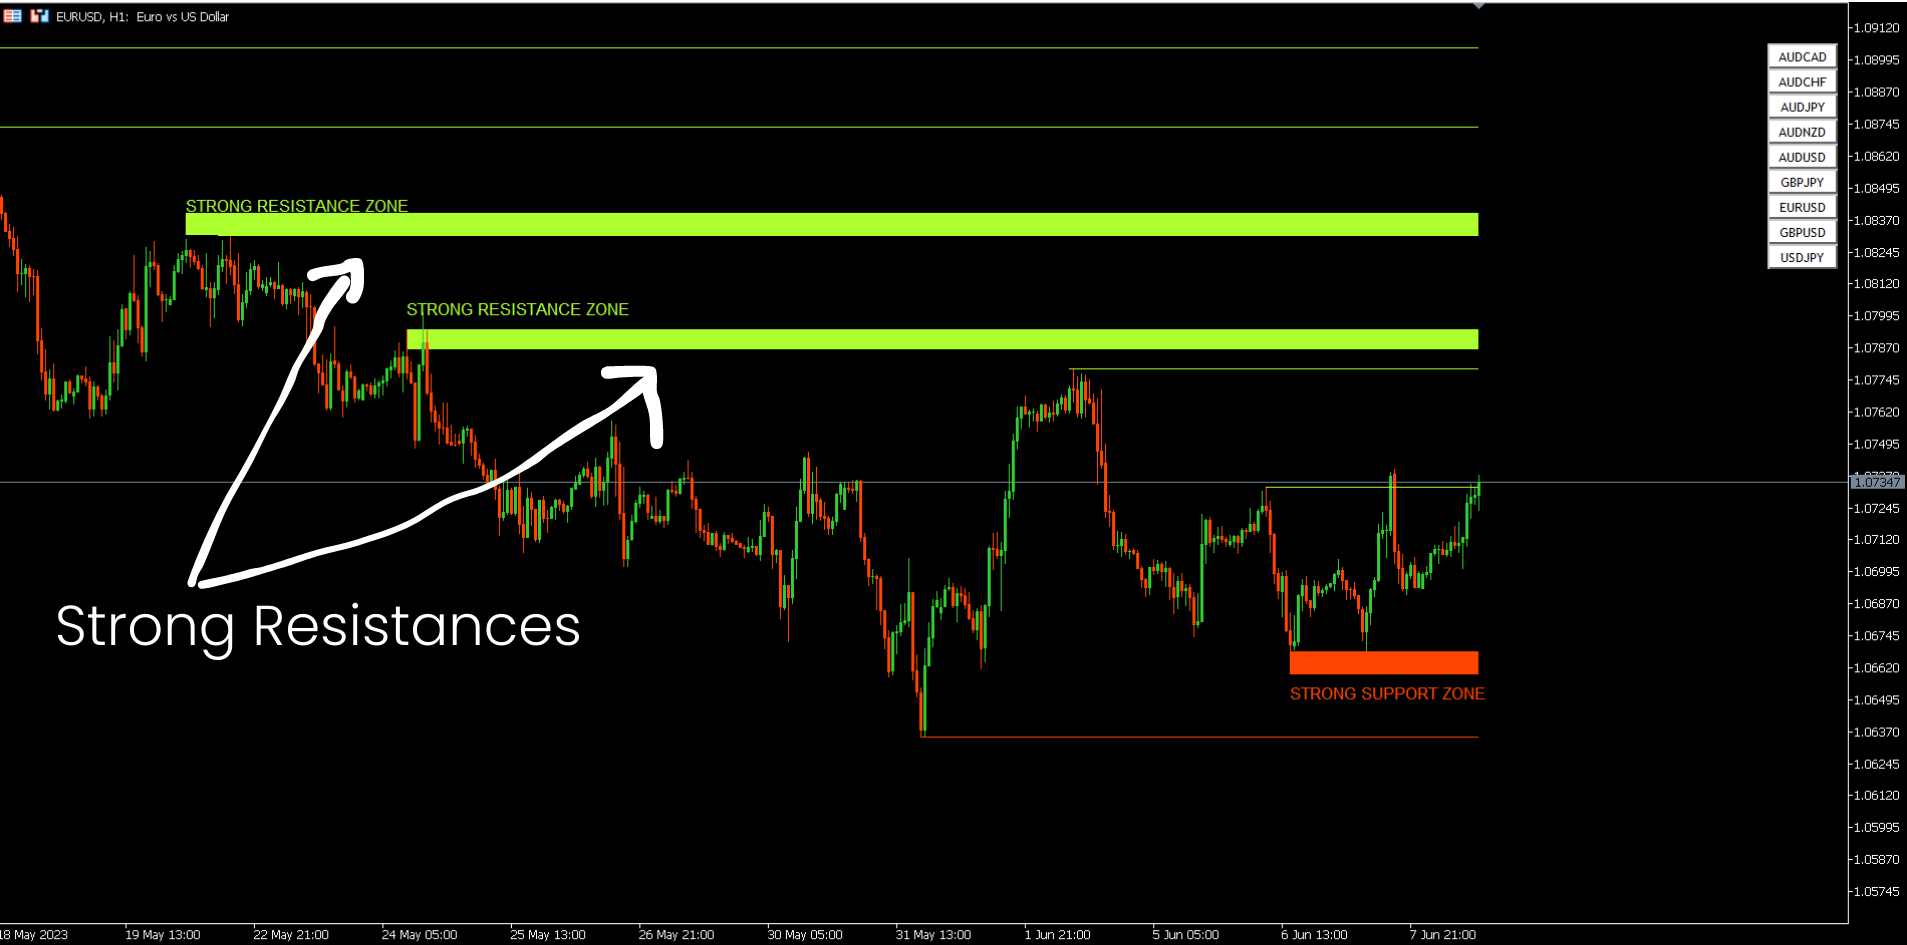
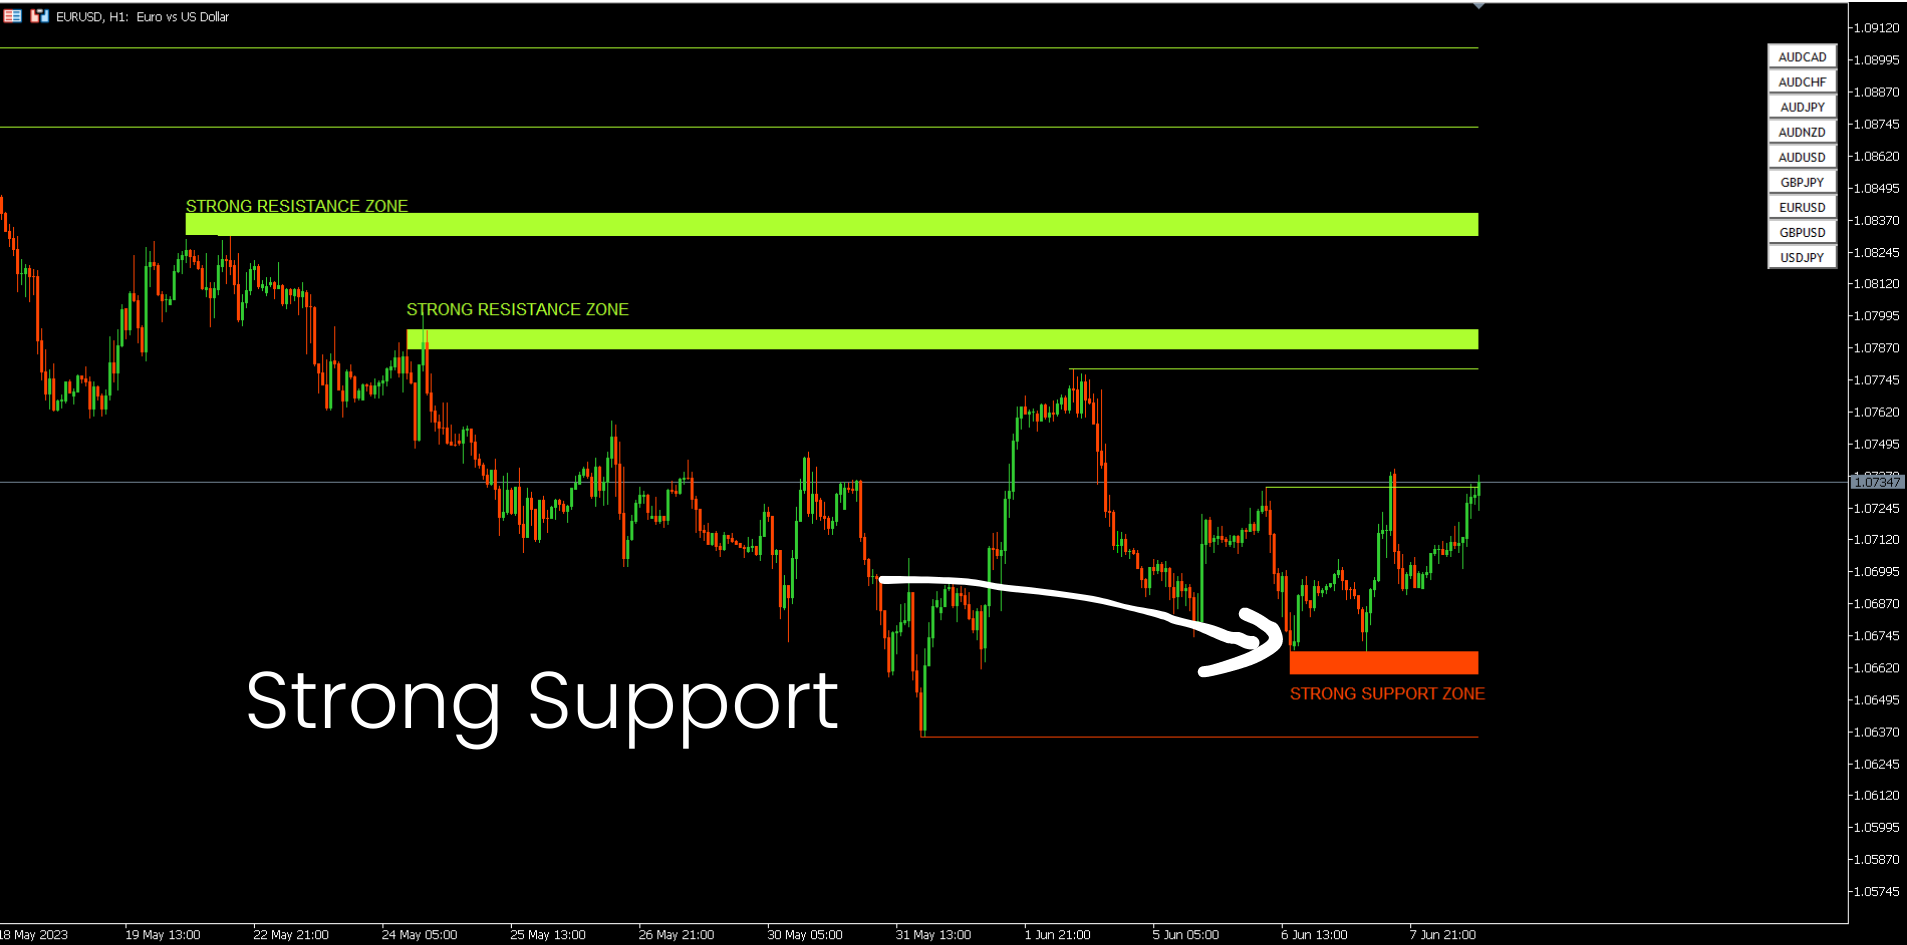
7. Starke Unterstützung und Widerstand basierend auf harmonischem Muster und Volumen.
8. Zonen auf Bankebene.
ZEITLICH BEGRENZTES ANGEBOT: HV Support and Resistance Indicator ist für nur 50 $ und Lebensdauer erhältlich. ( Originalpreis 125 $ )
Wenn Sie auf unseren MQL5-Blog zugreifen, finden Sie alle unsere Premium-Indikatoren mit Analysebeispielen: Klicken Sie hier
Hauptmerkmale
- Starke Unterstützungs- und Widerstandszonen basierend auf harmonischen und Volumen-Algorithmen.
- Bullish- und Bearish-Pullback-Zonen basierend auf Harmonic- und Volume-Algorithmen.
- Marktstruktur-Screener
- Tägliche, wöchentliche und monatliche Pivot-Punkte.
Dokumentationen
Alle Dokumentationen zu Support und Resistance Screener ( Anweisungen ) und Strategiedetails sind in diesem Beitrag in unserem MQL5-Blog verfügbar: Klicken Sie hier. Kontakt
Wenn Sie Fragen haben oder Hilfe benötigen, kontaktieren Sie mich per Privatnachricht.
Autor
SAYADI ACHREF , Fintech-Software-Ingenieur und Gründer von Finansya 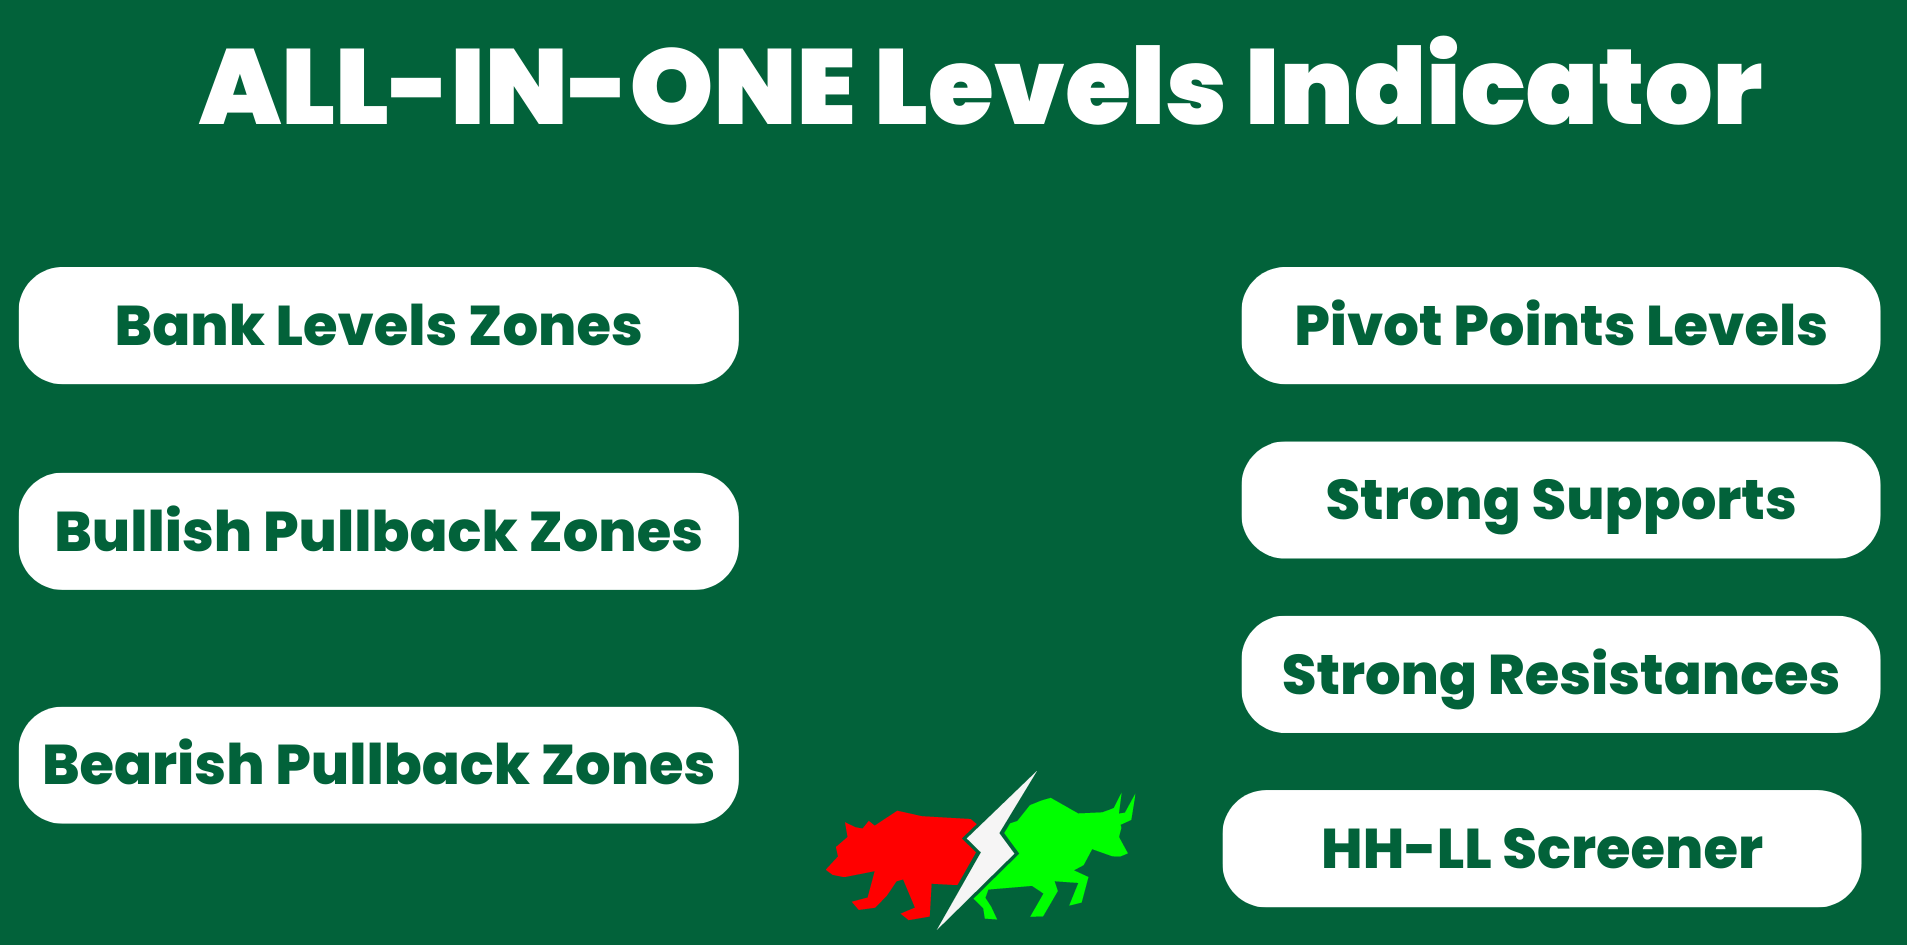


This is the best tool. In addition to my default pairs, I monitor the same pairs as the Trend Screener Pro. It allows me to see trend situations at a glance from M1 to MN multi-timeframes. This indicator's unique bank level accurately shows support and resistance. By combining it with the trend screener, it captures the early stages of trends and enables low-risk trading. Sayadi is friendly to users, gives accurate advice, and responds quickly to questions. Thank you so much!