
Leider kann „Fine Trade AM“ nicht mehr erworben werden.
Wenn Sie dieses Produkt schon einmal gekauft haben, können Sie es ohne Einschränkungen weiter verwenden und neue Kopien installieren, solange Sie noch Aktivierungen haben:
- Öffnen Sie Ihr MetaTrader 4-Terminal.
- Geben Sie Ihre MQL5.community-Kontoanmeldeinformationen in den Einstellungen an: Menü Extras\Optionen\Community.
- Gehen Sie zur Registerkarte „Markt“ und dann zur Registerkarte „Gekauft“.
- Klicken Sie auf die Schaltfläche „Installieren“ rechts neben dem Produktnamen.
Weitere Informationen finden Sie in der Dokumentation.
Probieren Sie andere MetaTrader 4 Apps.

NUR NOCH 3 VON 10 EXEMPLAREN FÜR 399 $ VORHANDEN! Danach wird der Preis auf 499 $ erhöht.
- ECHTES SIGNAL (Echtes Signal seit über 6 Monaten aktiv): Standardeinstellung: https://www.mql5.com/en/signals/2276213 Gold Scalping AI ist ein EA das künstliche Intelligenz nutzt, um Daten vieler Indikatoren zu analysieren. Von dort aus hat EA die beste Option, um Aufträge einzugeben. Der größte Unterschied von Gold Scalping AI besteht darin, dass der EA das Risiko-Ertrags-Verhältnis viel besser kontro

The GBPUSD Robot MT4 is an advanced automated trading system meticulously designed for the specific dynamics of the GBP/USD currency pair. Utilizing advanced technical analysis, the robot assesses historical and real-time data to identify potential trends , key support and resistance levels, and other relevant market signals specific to GBP/USD. The Robot opens positions every day, from Monday to Friday, and all positions are secured with Take Profit, Stop Loss, Trailing Stop, Break-Even

Introducing our advanced Scalping Forex Robot , specifically designed to maximize trading opportunities. The scalping algorithm is built to spot high-probability entry and exit points, ensuring that every trade is executed with the highest chance of success within the M1 timeframe . This robot is perfect for traders who prefer the scalping method and want to take advantage of rapid price movements without having to manually monitor the charts. It is suitable for both beginners looking fo

43% off for 48 hours only (Original price: $1,595) 50% bonus by purchasing this Robot, Contact us "after purchase" to receive the bonus
A fully automatic expert
Designed and produced 100% by artificial intelligence, with the world's most advanced technology
All trades have profit and loss limits, with the best and least risky market strategy, without using dangerous strategies such as Martingale and hedges, etc.
A specialist who has been trained by artificial intelligence for years to correctl

Wir stellen vor Quantum Emperor EA , der bahnbrechende MQL5-Expertenberater, der die Art und Weise, wie Sie mit dem prestigeträchtigen GBPUSD-Paar handeln, verändert! Entwickelt von einem Team erfahrener Händler mit über 13 Jahren Handelserfahrung.
IMPORTANT! After the purchase please send me a private message to receive the installation manual and the setup instructions.
***Kaufen Sie Quantum Emperor EA und Sie erhalten Quantum Wizard oder Quantum StarMan oder Quantum Gold Emperor kos

CyNera: Ihr Trading, Unsere Technologie Signale >400%: CyNera Signale >500%: CyNera Turbo
Handbuch & Set-Files: kontaktieren Sie mich nach dem Kauf, um das Handbuch und die Set-Files zu erhalten Preis: Preis steigt anhand der verkauften Lizenzen Verfügbare Kopien: 4 Der Handel mit Gold, einem der volatilsten Instrumente auf dem Markt, erfordert Präzision, tiefgehende Analysen und ein starkes Risikomanagement. Der CyNera Expert Advisor integriert diese Elemente nahtlos in ein hochentwickeltes

AI Golden Jet Fighter GTX MT4 ist ein unkomplizierter und effizienter Expert Advisor (EA) für den Goldhandel auf der Meta Trader 4-Plattform. Dieser EA nutzt neuronale Netzwerke und ist für das Scalping auf dem Goldmarkt (XAU/USD) konzipiert. Die Hauptstrategie von AI Golden Jet Fighter GTX konzentriert sich auf die Identifizierung kleiner Preisschwankungen und das Eröffnen von Positionen, um innerhalb kurzer Zeiträume Gewinne zu erzielen. Der EA analysiert die Marktbedingungen in Echtzeit

Aura Neuron ist ein einzigartiger Expert Advisor, der die Aura-Reihe von Handelssystemen fortsetzt. Durch die Nutzung fortschrittlicher neuronaler Netzwerke und hochmoderner klassischer Handelsstrategien bietet Aura Neuron einen innovativen Ansatz mit hervorragender potenzieller Leistung. Dieser vollständig automatisierte Expert Advisor ist für den Handel mit Währungspaaren wie EURUSD und XAUUSD (GOLD) konzipiert. Er hat von 1999 bis 2023 eine gleichbleibende Stabilität für diese Paare bewiesen.

EA Gold Stuff ist ein Berater, der speziell für den Goldhandel entwickelt wurde. Die Basis der Arbeit ist die Eröffnung von Orders auf dem Indikator Gold Stuff, so dass der Berater arbeitet an der Strategie "Trend Follow", was bedeutet, den Trend zu folgen.
WICHTIG! Kontaktieren Sie mich sofort nach dem Kauf, um Anweisungen und Bonus zu erhalten! Sie können eine kostenlose Kopie unseres Strong Support- und Trendscanner-Indikators erhalten, bitte senden Sie uns eine persönliche Nachricht. Mich!

WINTER Mega SALE! --> Buy Forex GOLD Investor with -60% OFF and get a BONUS EA -> Pips Master PRO - with amazing results!
NOTE: Promo price: $197 (Regular Price: $497) - The offer ends soon! Live Signal Account: https://www.mql5.com/en/signals/2276118 Forex GOLD Investor is one of the best expert advisors developed to trade on GOLD(XAUUSD) in the forex market. Forex GOLD Investor consists of 2 trading systems . The first one is based on scalping trading strategy and the second system has time

The Bitcoin Robot MT4 is engineered to execute Bitcoin trades with unparalleled efficiency and precision . Developed by a team of experienced traders and developers, our Bitcoin Robot employs a sophisticated algorithmic approach (price action, trend as well as two personalized indicators) to analyze market and execute trades swiftly with M5 timeframe , ensuring that you never miss out on lucrative opportunities. No grid, no martingale, no hedging, EA only open one position at the sa

EvoTrade: Das erste selbstlernende Handelssystem auf dem Markt Darf ich Ihnen EvoTrade vorstellen? Ein einzigartiger Handelsberater, entwickelt mit modernster Technologie in den Bereichen Computer Vision und Datenanalyse. Es ist das erste selbstlernende Handelssystem auf dem Markt und arbeitet in Echtzeit. EvoTrade analysiert Marktbedingungen, passt Strategien an und reagiert dynamisch auf Veränderungen, um außergewöhnliche Präzision in jeder Umgebung zu gewährleisten. EvoTrade nutzt fortschritt

Die Quintessenz eines ganzheitlichen Ansatzes, dessen Hauptziel es ist, langfristige und realistische Gewinne mit minimalen Risiken für den Trader zu erzielen. Die Grundlage bilden fortschrittliche Handelskonzepte kombiniert mit maschinellem Lernen, die sich gegenseitig effektiv verstärken. Ein weiteres einzigartiges Merkmal ist, dass das System nicht optimiert werden muss, da diese Funktion von meinen Servern übernommen wird. Aktuelle Einstellungen werden täglich in unseren Telegram-Kanälen ve

The AI Gen ProX Expert Advisor is a powerful solution based on advanced market analysis and data processing technologies. Utilizing cutting-edge algorithms for time series analysis and complex mathematical models, it ensures high accuracy in forecasts and automates trading processes. The EA is designed to combine performance and reliability, making it an effective tool for trading. Real Time Signal GEN PRoX: https://www.mql5.com/ru/signals/2283186 The price of the advisor will increase si

Gann Made Easy ist ein professionelles und einfach zu bedienendes Forex-Handelssystem, das auf den besten Handelsprinzipien unter Verwendung der Theorie von Mr. basiert. W.D. Gann. Der Indikator liefert genaue KAUF- und VERKAUFSsignale, einschließlich Stop-Loss- und Take-Profit-Levels. Mit PUSH-Benachrichtigungen können Sie auch unterwegs handeln. Bitte kontaktieren Sie mich nach dem Kauf! Ich werde meine Handelstipps und tolle Bonusindikatoren kostenlos mit Ihnen teilen! Wahrscheinlich haben Si

Gold Scalping Expert is a very intelligent smart algorithm which exploits the reaction of gold during various high-impact events like geo-political news, pandemics, and economic changes. This system trades breakouts using the popular zig-zag indicator by placing pending orders at the turning points and when the price breaks out beyond these levels the orders will get triggered. The EA is using a very smart trailing stop and dynamic stop loss to protect your account and manage the risk properly

EA Gold Isis – Eine sichere und effektive Lösung für den Goldhandel Einführungsangebot Nur noch 3 Kopien zum aktuellen Preis verfügbar! Nächster Preis: $458 Endpreis: $1998 LIVE SIGNAL MT5-Version Hallo! Ich bin EA Gold Isis, der zweite EA in der Diamond Forex Group Familie, speziell entwickelt für den Goldhandel (XAU/USD). Mit außergewöhnlichen Funktionen und einem Sicherheitsfokus verspreche ich, eine nachhaltige und effektive Goldhandelserfahrung für Händler zu bieten.
Was macht

KI-gesteuerte Technologie mit ChatGPT Turbo Infinity EA ist ein fortschrittlicher Expert Advisor für GBPUSD und XAUUSD. Er konzentriert sich auf Sicherheit, konstante Erträge und unendliche Rentabilität. Im Gegensatz zu vielen anderen EAs, die auf risikoreichen Strategien wie Martingale oder Grid-Trading basieren, verwendet Infinity EA eine disziplinierte, profitable Scalping-Strategie, die auf einem neuronalen Netzwerk basiert, das über maschinelles Lernen und KI-basierte Datenanalysetechnolog

Willkommen beim Trade Manager EA – dem ultimativen Risikomanagement-Tool , das den Handel einfacher, präziser und effizienter gestaltet. Dies ist mehr als nur ein Werkzeug zur Orderausführung; es ist eine umfassende Lösung zur Handelsplanung, Positionsverwaltung und Risikokontrolle. Ob Anfänger, erfahrener Trader oder Scalper, der schnelle Ausführungen benötigt – Trade Manager EA passt sich Ihren Anforderungen an und bietet Flexibilität in allen Märkten, von Forex und Indizes bis hin zu Rohstof
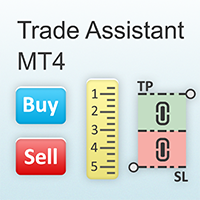
Sie hilft bei der Berechnung des Risikos pro Handel, der einfachen Einrichtung einer neuen Order, der Orderverwaltung mit Teilschließungsfunktionen, Trailing-Stop von 7 Typen und anderen nützlichen Funktionen.
Zusätzliche Materialien und Anleitungen
Installationsanleitung - Anleitung zur Anwendung - Testversion der Anwendung für ein Demokonto
Linienfunktion Zeigt auf dem Chart die Eröffnungslinie, Stop Loss, Take Profit. Mit dieser Funktion ist es einfach, eine neue Order einzurichten und ihre

HFT Prop Firm EA, auch bekannt als Green Man aufgrund seines markanten Logos, ist ein Expert Advisor (EA), der speziell dafür entwickelt wurde, Herausforderungen oder Bewertungen von proprietären Handelsfirmen (prop firms) zu überwinden, die Hochfrequenzhandel (HFT)-Strategien erlauben. Für begrenzte Zeit: kostenlose Hilfsprogramme im Wert von $198, wenn Sie HFT Prop Firm EA kaufen MT5-Version: https://www.mql5.com/en/market/product/117386 HFT Challenge Performance Monitor (ab $200): Broker: IC

A Richter Expert is a professional market analyst working using a specialized algorithm. By analyzing prices over a specific time period, it determines the strength and amplitude of prices using a unique indicator system based on real data. When the trend and its direction change, the expert closes the current position and opens a new one. The bot's algorithms take into account signals about overbought and oversold markets. Buying occurs when the signal falls below a certain level and then rise

1 copу left for $225 Next price --> $299 Diamond PRO is enhanced powerful version of Diamond for advanced traders. Pro version includes optimized cores, new impoved entry points filters, new multistage profit closure algorithm and сontains number of external control parameter that allows build and fine tune own tradind decisions and algorithms. The system provides more accurate market entries, analyzes and filters upcoming economic news, contains spread protection and an advanced position mana

Der Expert Advisor ist ein System zur Wiederherstellung unrentabler Positionen. Der Algorithmus des Autors sperrt eine Verlustposition, teilt sie in viele separate Teile und schließt jeden von ihnen separat. Einfache Einrichtung, verzögerter Start im Falle eines Drawdowns, Sperren, Deaktivieren anderer Expert Advisors, Mittelwertbildung mit Trendfilterung und teilweises Schließen einer Verlustposition sind in einem Tool integriert Es ist die Verwendung von Schließungsverlusten in Teilen, die es

Erleben Sie außergewöhnlich schnelles Trade Copying mit dem Local Trade Copier EA MT4 . Mit seiner einfachen 1-Minuten-Setup können Sie Trades zwischen mehreren MetaTrader-Terminals auf demselben Windows-Computer oder Windows VPS mit blitzschnellen Kopiergeschwindigkeiten von unter 0.5 Sekunden kopieren.
Ob Anfänger oder professioneller Trader - der Local Trade Copier EA MT4 bietet eine Vielzahl von Optionen, um ihn an Ihre spezifischen Bedürfnisse anzupassen. Es ist die ultimative Lösung für

Vollautomatischer Berater nach dem Prinzip von Angebot und Nachfrage . Zum ersten Mal bieten wir einen vollautomatischen Angebots- und Nachfrageberater an . Trading leicht gemacht und Sie haben jetzt die volle Kontrolle über Ihre Handelsstrategie Verwendet ein praktisches grafisches Bedienfeld. Sie erhalten eine sehr hochwertige algorithmische Handelssoftware mit über 15.000 Codezeilen.
EA ProBot Angebots- und Nachfrageleitfaden
The Best Way to Trade Prop Firms fordert Sie bei jedem Schritt au

Übersicht Der CoreX G EA ist ein fortschrittliches Handelssystem, das speziell entwickelt wurde, um die Komplexität des Forex-Marktes zu bewältigen. Durch den Einsatz modernster neuronaler Netzwerke, fortschrittlicher maschineller Lerntechnologien und einer integrierten Big-Data-Strategie bietet CoreX G außergewöhnliche Genauigkeit und Sicherheit im Handel. Dieser Expert Advisor (EA) zeichnet sich durch seine technologische Exzellenz und erstklassigen Kundensupport aus, der den Nutzern bei alle

Dynamic Forex28 Navigator – Das Forex-Handelstool der nächsten Generation AKTUELL 49 % RABATT. Dynamic Forex28 Navigator ist die Weiterentwicklung unserer seit langem beliebten Indikatoren und vereint die Leistung von drei in einem: Advanced Currency Strength28 Indicator (695 Bewertungen) + Advanced Currency IMPULSE mit ALERT (520 Bewertungen) + CS28 Combo Signals (Bonus) Details zum Indikator https://www.mql5.com/en/blogs/post/758844
Was bietet der Strength Indicator der nächsten Generation?

Synapse Trader: Ein neuronales Netzwerk, das neue Horizonte im Trading eröffnet Stellen Sie sich einen Berater vor, der nicht nur den Markt analysiert, sondern Ihr intelligenter Assistent wird, der jeden Tag lernt und sich an die sich ändernden Marktbedingungen anpasst. Synapse Trader ist ein einzigartiges Tool, das auf fortschrittlicher neuronaler Netzwerktechnologie basiert und die subtilsten Marktsignale erfassen kann. Es ist nicht nur ein Expert Advisor – es ist ein lebendiges neuronales

EA Black Dragon arbeitet mit dem Black Dragon-Indikator. Der Expert Advisor eröffnet einen Deal anhand der Farbe des Indikators, dann ist es möglich, das Ordernetzwerk aufzubauen oder mit einem Stop-Loss zu arbeiten.
Die Überwachung der realen Arbeit sowie meine anderen Entwicklungen finden Sie hier: https://www.mql5.com/en/users/mechanic/seller
Alle Einstellungen finden Sie hier! Empfehlungen
Währungspaare EURUSD GBPUSD Zeitrahmen M15 Empfohlene Einzahlung 1000 Dollar oder Cent Empfohle

Gold Stuff-Ein Trendindikator, der speziell für Gold entwickelt wurde, kann auch auf allen Finanzinstrumenten verwendet werden. Der Indikator wird nicht neu gezeichnet und verzögert sich nicht. Empfohlener Zeitrahmen H1.
Nach diesem Indikator geschrieben EA Gold Stuff Berater, können Sie es in meinem Profil finden.
WICHTIG! Kontaktieren Sie mich sofort nach dem Kauf, um Anweisungen und Bonus zu erhalten! Sie können eine kostenlose Kopie unseres Strong Support- und Trendscanner-Indikators er

Beidou Trend EA is a trend EA with a large profit-loss ratio. Breakout trading is a very old method. It has been widely used since Livermore in the 1900s. It has been more than 120 years. This method is always effective, especially for XAUUSD and Gold with high volatility. I have been using the breakout method to make profits on XAUUSD since the beginning of my investment career. I am familiar with this method. It is old, simple and effective. Beidou Trend EA is improved based on Rising Sun Go

40% Rabatt auf Boring Pips EA – Begrenztes Angebot! Erhalte 8 Aktivierungen für nur $399 USD – Nur 10 Kopien verfügbar! Warum Boring Pips EA wählen?
Bewährte Ergebnisse – 123 Wochen verfolgte Signale mit über 1000% Gewinn
Einfache Installation – In wenigen Minuten einsatzbereit
Vollständig automatisiert Verpasse nicht diese Chance, sicher und präzise zu handeln. Sichere dir jetzt dein Boring Pips EA! Hast du dich jemals gefragt, warum die meisten Expertenberater im Live-Handel

Bitcoin Smart EA arbeitet mit dem einzigartigen MAFilling Trend-Indikator. Es ist eine sehr einfache, aber effiziente Strategie und die einzigartigen und flexiblen Einstellungen machen diesen EA extrem vielseitig und helfen Ihnen, optimale Ergebnisse für Ihre Trades zu erzielen. Funktioniert sehr gut mit Krypto sowie mit jeder Währung und Gold im Zeitrahmen m15 oder m30. Echtzeitergebnisse können hier eingesehen werden. Kontaktieren Sie mich direkt nach dem Kauf, um einen persönlichen Bonus zu

- Real price is 80$ - 40% Discount ( It is 49$ now ) - Lifetime update free Contact me for instruction, add group and any questions! Related Products: Bitcoin Expert , Gold Expert - Non-repaint - I just sell my products in Elif Kaya profile, any other websites are stolen old versions, So no any new updates or support. Introduction The breakout and retest strategy is traded support and resistance levels. it involves price breaking through a previous level. The break and retest strategy is

Last copy at 399$ -> next price 499$ Dark Algo is a fully automatic Expert Advisor for Scalping Trading on Eurusd . This Expert Advisor is based on the latest generation of algorithm and is highly customizable to suit your trading needs. If you Buy this Expert Advisor you can write a feedback at market and get a second EA for Free , for More info contact me The basic strategy of this EA is built on a sophisticated algorithm that allows it to identify and follow market trends .
T

Aurum AI – Die Kraft der künstlichen Intelligenz für den Goldhandel (XAU/USD) Entdecken Sie das volle Potenzial der Technologie im Handel! Aurum AI ist ein bahnbrechender Expert Advisor, der für eine stabile und sichere Performance am Goldmarkt entwickelt wurde. Es kombiniert die Kraft der künstlichen Intelligenz, präzise Trendanalysen und eine strenge Risikokontrolle, um jede Transaktion so effektiv wie möglich zu gestalten. Aktion Discount - 50%. 3 copies available at a price of $225 Live-Sign

BITCOIN-BOT
Btc Bot verwendet den stochastischen Bandindikator und ist speziell für den Handel mit Bitcoins konzipiert. Sie können jedoch auch mit anderen Währungspaaren handeln, wenn Sie möchten. Wenn das Band von Rot auf Grün wechselt, beginnt der EA zu kaufen, und wenn es von Grün auf Rot wechselt, beginnt der EA zu verkaufen. Der Handel wird im Martingal-/Rasterstil gesteuert, bis die Gewinnmitnahme erreicht wird. Der EA verfügt über einen integrierten Nachrichtenfilter, der das Eingehen n

SevenDaysEA Advisor ist ein vollautomatisches Grid-System. Der Berater arbeitet mit Währungspaaren: AUDCAD, AUDNZD, NZDCAD. Der Berater verfügt über 10 vorinstallierte Set-Dateien für jedes Währungspaar. Der Berater wurde erfolgreich auf echten Handelskonten getestet: Echtes Kontosignal - SevenDays - mehr als 4000 % in 3 Jahren Arbeit. Um einen Berater für ein bestimmtes Währungspaar zu betreiben, müssen Sie den Berater auf dem Chart des entsprechenden Währungspaars installieren. Um zu

The EUR/USD Multi-Strategy Trading Robot MT4 is an advanced tool designed to optimize trading by combining 3 key systems: daily trading, volume analysis, and Fibonacci retracement levels. This robot works by integrating these different approaches to create a more dynamic and adaptable strategy for trading the EUR/USD pair . EA adapts to different market conditions, this makes it an ideal solution for traders looking to enhance their trading strategy with a powerful, multi-faceted approach.

Alpha Flow EA: Ihr Trading auf das nächste Level bringen Alpha Flow EA ist ein hochmoderner Trading-Advisor, der entwickelt wurde, um Ihr Trading-Erlebnis durch strategische Präzision, Anpassungsfähigkeit und fortschrittliche Marktanalyse zu revolutionieren. Mit proprietären Handelsalgorithmen und tiefen Marktkenntnissen bietet Alpha Flow EA außergewöhnliche Leistung in unterschiedlichen Handelsumgebungen und hilft Ihnen, den Markttrends stets einen Schritt voraus zu sein. Echte Handelssig
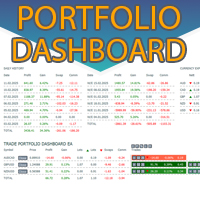
Sehen Sie sich sofort Ihren Verlauf geschlossener Trades nach Tag und Woche, Ihre aktuell offenen Trades und Ihr Forex-Engagement auf einem Diagramm an! Verwenden Sie die Heatmap, um profitable Trades zu identifizieren und wo Ihr aktueller Drawdown innerhalb Ihres Handelsportfolios liegt.
Schaltflächen zum schnellen Schließen Verwenden Sie die Schaltflächen zum schnellen Schließen, um jeden Trade mit einem einzelnen Symbol zu schließen, einzelne Trades vollständig zu schließen oder teilweise G

Gold Venamax – das ist der beste technische Indikator für Aktien. Der Indikatoralgorithmus analysiert die Preisbewegung eines Vermögenswerts und spiegelt die Volatilität und potenzielle Einstiegszonen wider.
Indikatorfunktionen:
Dies ist ein Super-Indikator mit Magic und zwei Blöcken von Trendpfeilen für komfortables und profitables Trading. Auf dem Diagramm wird eine rote Schaltfläche zum Wechseln von Blöcken angezeigt. Magic ist in den Indikatoreinstellungen eingestellt, sodass Sie den In

Stock Indexes EA is a sophisticated trading robot meticulously engineered to capitalize on the dynamics of the US30 . This expert advisor employs advanced algorithms and technical indicators to analyze market trends, identify potential entry and exit points, and execute trades with precision. A news filter has also been added to the robot, which prevents it from opening a position during important economic news , minimizing the risk. In robot, you can also specify the days and hours when the EA

After purchase, please contact me to get your trading tips + more information for a great bonus!
Lux Trend is a professional strategy based on using Higher Highs and Lower Highs to identify and draw Trendline Breakouts! Lux Trend utilizes two Moving Averages to confirm the overall trend direction before scanning the market for high-quality breakout opportunities, ensuring more accurate and reliable trade signals. This is a proven trading system used by real traders worldwide, demonstrating

Kamikaze Trading is the latest generation of automated trading robots for the Forex and Gold markets. The EA is programmed with premium algorithms and unique trading strategies that deliver stable performance and low risk. The strategy analyzes price action and price tick patterns, combines scalpers and smart position management and has available risk management options such as Max Stop Loss, Close all at Friday, Trailing, in which Max Stop Loss is often large so that the price has space to mov

Dasünstliche Intelligenzsystem analysiert eine Vielzahl von Indikatoren, darunter Fraktale, Volumina und Preisbewegungen, und entscheidet über die Eingabe einer Position. Verwendet kein Raster und kein Martingal. Es wurde in der mehr als 10-jährigen Geschichte erfolgreich getestet
Scalper AI verwendet zwei Strategien, um ausstehende Aufträge an entscheidenden Marktpunkten zu platzieren. Die erste Strategie verwendet spezifische Fraktale aus zwei verschiedenen Zeitrahmen und die zweite analysi

!SPECIAL SALE! An exclusive indicator that utilizes an innovative algorithm to swiftly and accurately determine the market trend. The indicator automatically calculates opening, closing, and profit levels, providing detailed trading statistics. With these features, you can choose the most appropriate trading instrument for the current market conditions. Additionally, you can easily integrate your own arrow indicators into Scalper Inside Pro to quickly evaluate their statistics and profitability

Der EA eröffnet eine Position, wenn der Markt während der New Yorker Sitzung (höheres Volumen) in Bewegung kommt. Auf diese Weise wird das Momentum durch das Volumen gestützt, und wir können mit hoher Wahrscheinlichkeit sofort den Take Profit erreichen. Signal (292%, 10% DD): https ://www .mql5 .com /en /signals /2274145
Eröffnung bei Momentum während der New Yorker Sitzung Der EA erkennt den versteckten Impuls durch FVGs auf niedrigeren Zeitintervallen. Wird der Impuls kurz vor oder während

Wir stellen vor Quantum Gold Emperor EA , der bahnbrechende MQL5-Expertenberater, der die Art und Weise, wie Sie mit dem prestigeträchtigen Paar XAUUSD (GOLD) handeln, verändert! Entwickelt von einem Team erfahrener Händler mit über 13 Jahren Handelserfahrung.
WICHTIG! Bitte senden Sie mir nach dem Kauf eine private Nachricht, um die Installationsanleitung und die Einrichtungsanleitung zu erhalten. ***Kaufen Sie Quantum Gold Emperor EA und Sie könnten Quantum Trade EA kostenlos erhalten

Currency Strength Wizard ist ein sehr leistungsstarker Indikator, der Ihnen eine Komplettlösung für erfolgreichen Handel bietet. Der Indikator berechnet die Stärke dieses oder jenes Forex-Paares anhand der Daten aller Währungen in mehreren Zeitrahmen. Diese Daten werden in Form von benutzerfreundlichen Währungsindizes und Währungsstärkelinien dargestellt, anhand derer Sie die Stärke dieser oder jener Währung erkennen können. Sie müssen lediglich den Indikator an das Diagramm anhängen, mit dem Si

Tree Of Life EA is an fully automatic trading advisor which recognise patterns and trends in a highly accurate manner.
It is designed to generate stable long-term gains while providing excellent risk management.
After years of trading and testing, we have discovered spesific combinations of indicators and internal calculations that secure a solid foundation for a robust strategy.
The main indicators Tree Of Life uses are the Moving Average and Stochastic.
Together with internal calculations, ou

Gold One MT4 Hallo an alle Gold-Handelsenthusiasten im Forex, Willkommen bei unserem Roboter, wo Sie sich den Reihen der besten Goldhändler anschließen. Mit über zwei Jahrzehnten präziser Erfahrung auf dem Forex-Markt präsentieren wir stolz die neueste Generation von Handelsrobotern.
Merkmale: Ideal für Prop-Firma-Herausforderungen. Geeignet für alle Kontogrößen, einschließlich kleiner Kapitalbeträge. KEIN Grid und KEIN Martingale 100% Vollautomatisiert Dieser Roboter verwendet die neu

Titan Gold AI Titan Gold AI — Leistungsstarker Expert Advisor für XAU/USD Basierend auf zahlreichen Anfragen unserer Aurum AI-Nutzer haben wir den Titan Gold AI entwickelt, einen innovativen Roboter für den Handel mit Gold (XAU/USD). Titan Gold AI kombiniert bewährte Strategien mit fortschrittlicher künstlicher Intelligenz und ist ein zuverlässiges und effektives Werkzeug für den Handel. Titan Gold - Wichtige Informationen Wichtige Informationen Titan Gold wurde am 1. Januar 2025 veröffentlicht.

Freya AI ist ein vollautomatischer Handelsberater, der neuronale Netzwerke verwendet und auf den Handel mit dem beliebtesten Währungspaar EUR/USD im Stunden-Zeitrahmen (H1) spezialisiert ist.
Unser Berater ist nicht einfach nur ein weiterer Berater! Es ist ein intelligentes neuronales Netzwerk, das für den erfolgreichen Handel auf den Finanzmärkten entwickelt wurde. Unser Berater basiert auf fortschrittlichen Deep-Learning-Algorithmen, die es ihm ermöglichen, viele Daten zu analysieren und die

CyNeron: Präzision im Trading trifft auf KI-Innovation Signale : CyNeron Handbuch & Set-Dateien : Kontaktieren Sie mich nach dem Kauf, um das Handbuch und die Set F iles zu erhalten Preis : Der Preis steigt basierend der Anzahl der verkauften Exemplare Verfügbare Exemplare : 5 KI-gestützte Snapshot-Analyse: Eine Marktneuheit CyNeron ist der erste EA auf dem Markt, der fortschrittliche KI in einen revolutionären Handelsansatz integriert,
indem detaillierte Momentaufnahmen der Marktbedingunge

AurumTrend – XAUUSD (EA) für Scalping und Trendhandel Überblick
AurumTrend ist ein automatisierter Expert Advisor (EA) für XAUUSD (Gold), der mit Scalping- und Trendfolgestrategien handelt. Es identifiziert Markttrends und führt Trades auf der Grundlage vordefinierter Parameter aus, wobei es auch Scalping-Techniken nutzt, um auf kurzfristige Preisbewegungen zu reagieren. AurumTrend umfasst eine Trailing-Stop-Funktion zur Verwaltung von Trades, einen Nachrichtenfilter zur Anpassung der Handelsakt
Recovery Manager Pro ist ein System zur Wiederherstellung von Inanspruchnahmen von anderen Beratern oder von manuell geöffneten Aufträgen. RM Pro verfügt über die Fähigkeit zur automatischen dynamischen Anpassung. Der Händler muss die Risikostufe auswählen und der Berater arbeitet im vollautomatischen Modus. Kann im Drawdown-Wiederherstellungsmodus und im Standby-Modus arbeiten! Wenn ein anderer Berater einen Drawdown generiert, deaktiviert RM Pro diesen, sperrt die Position und startet den Pro
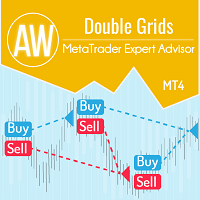
Advisor AW Double Grids MT4 – ist ein aggressiver, vollautomatischer Grid-Advisor mit einem Informationshandelspanel und einfacher Einrichtung. Die Strategie besteht aus gleichzeitiger Arbeit in beide Richtungen, wobei das Volumen einer Richtung multipliziert wird. Es sind integrierte automatische Lot-Berechnungen, verschiedene Variationen zur Erhöhung des Positionsvolumens und andere Funktionen implementiert. Anleitungen -> HIER / Problemlösung -> HIER / MT5 Version -> HIER
So handelt

2 copies left for $175. Next price --> $249 EA Gold NRJ is 100% automated trading system with long term stable growth strategy. The EA works on popular instrument XAUUSD (GOLD). The Ea does not use averaging, martingale, grid. Safe trading with low drawdown. Only one trade per time. Each trade includes take profit and stop loss. FIFO compartible. The Ea can work with any small or large deposits.
Easy to use, just set risk or own fixed lot.
Download settings
Key features: smart entry point

Golden Trend indicator is The best indicator for predicting trend movement this indicator never lags and never repaints and never back paints and give arrow buy and sell before the candle appear and it will help you and will make your trading decisions clearer its work on all currencies and gold and crypto and all time frame This unique indicator uses very secret algorithms to catch the trends, so you can trade using this indicator and see the trend clear on charts manual guide and

FX Levels: Außerordentlich präzise Unterstützungs- und Widerstandszonen für alle Märkte Kurzüberblick
Suchen Sie eine verlässliche Methode, um Support- und Resistance-Level in jedem Markt zu identifizieren—egal ob Währungspaare, Indizes, Aktien oder Rohstoffe? FX Levels vereint die traditionelle „Lighthouse“-Methode mit einem modernen dynamischen Ansatz und bietet nahezu universelle Genauigkeit. Durch unsere Erfahrung mit echten Brokern sowie automatischen täglichen und Echtzeit-Updates hilft

Smart Set up leve l is a very powerful indicator based on the concept of order blocks and set up entries with proper fvg and breakouts to make a very nice level to enter like a pro trader. Very easy to use interface and friendly to enter on buy and sell signals. Works Best on M15 Time frame on Gold, Bitcoin and Fx pairs. Daily 4-5 trades on each pair Works great on gold like a pro on M15 It is non repainting nor lagging It is very powerful indicator giving precise entries and prop acts can be c

Scalper Vault ist ein professionelles Scalping-System, das Ihnen alles bietet, was Sie für erfolgreiches Scalping benötigen. Dieser Indikator ist ein komplettes Handelssystem, das von Forex- und Binäroptionshändlern verwendet werden kann. Der empfohlene Zeitrahmen ist M5. Das System liefert Ihnen genaue Pfeilsignale in Richtung des Trends. Es liefert Ihnen auch Top- und Bottom-Signale und Gann-Marktniveaus. Die Indikatoren bieten alle Arten von Warnungen, einschließlich PUSH-Benachrichtigungen.