• Übersicht
  • Bewertungen
  • Diskussion

Heikin Ashi RSI Oscillator

Gerne stellen wir dir den Heikin Ashi RSI Oszillator vor!

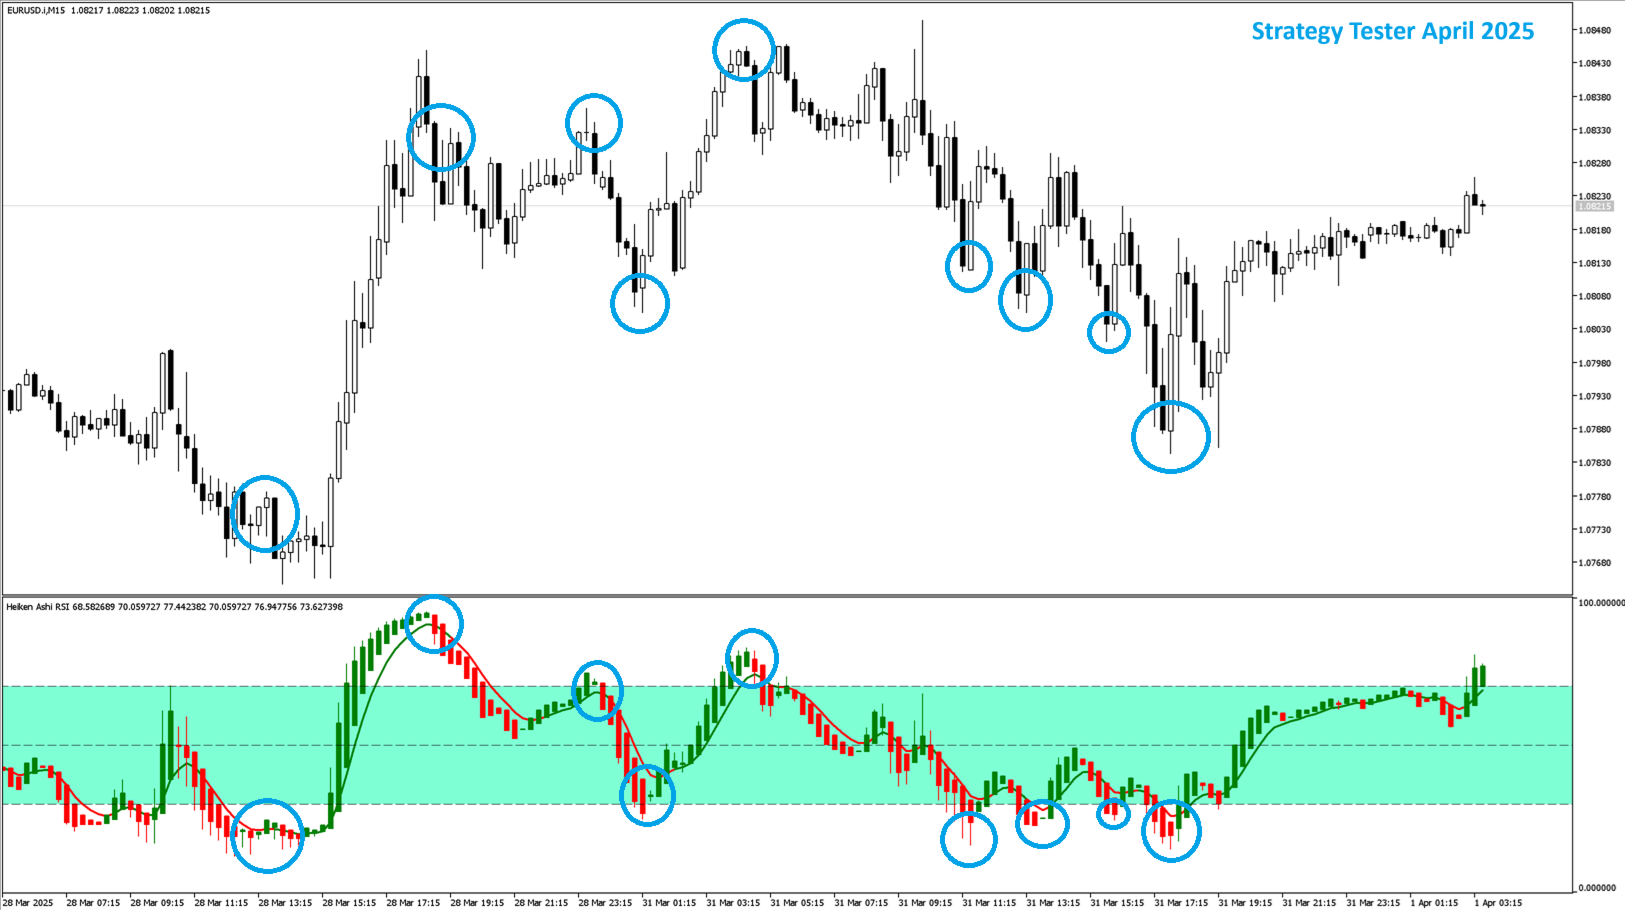
Dieser Indikator kombiniert die Konzepte von Heikin Ashi Kerzen mit dem RSI (Relative Strength Index), um ein oszillatorähnliches Format zu erzeugen, das dazu verwendet werden kann, einen Teil des Rauschens (Noise) herauszufiltern, das mit den standardmässigen RSI-Werten verbunden ist. Dies bietet den Tradern eine glattere Darstellung der Marktbedingungen.

Hier sind einige Artikel, um mehr über den RSI und Heikin Ashi Kerzen zu erfahren:


Funktionen

  1. Der Heikin Ashi RSI wird unter Verwendung der RSI-Formel berechnet, jedoch auf Heikin Ashi Kerzen angewendet. Ziel ist es, die typischen Schwankungen des RSI zu glätten und eine stabilere Lesung zu liefern.
  2. Plot-Optionen:

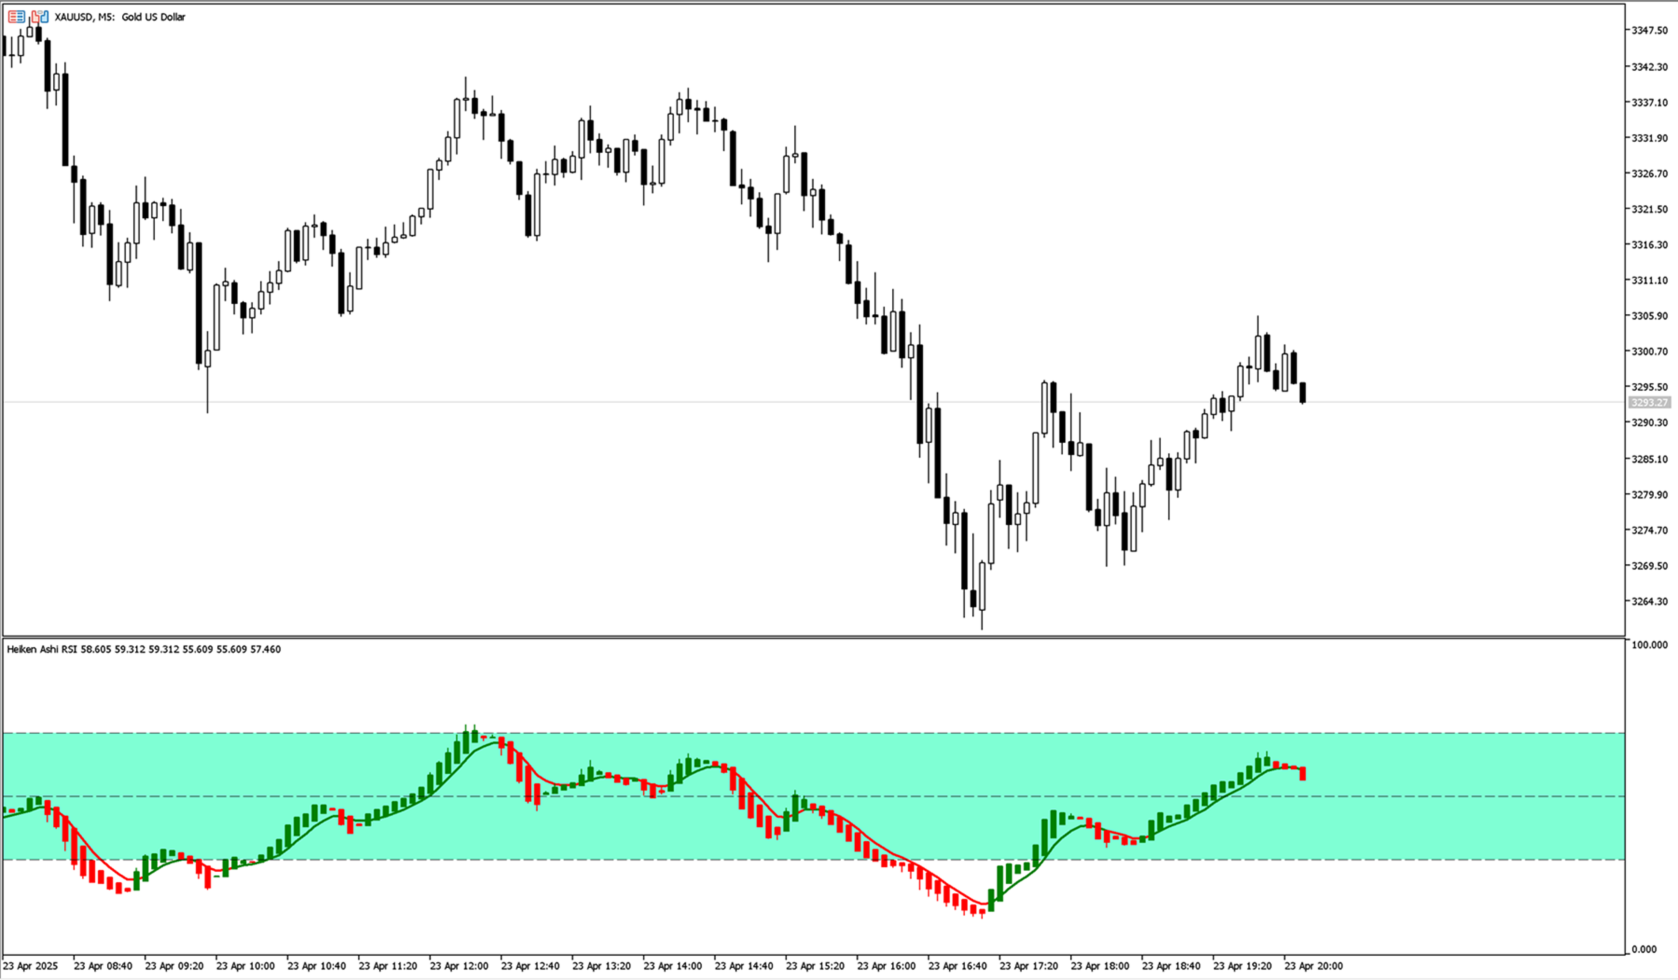
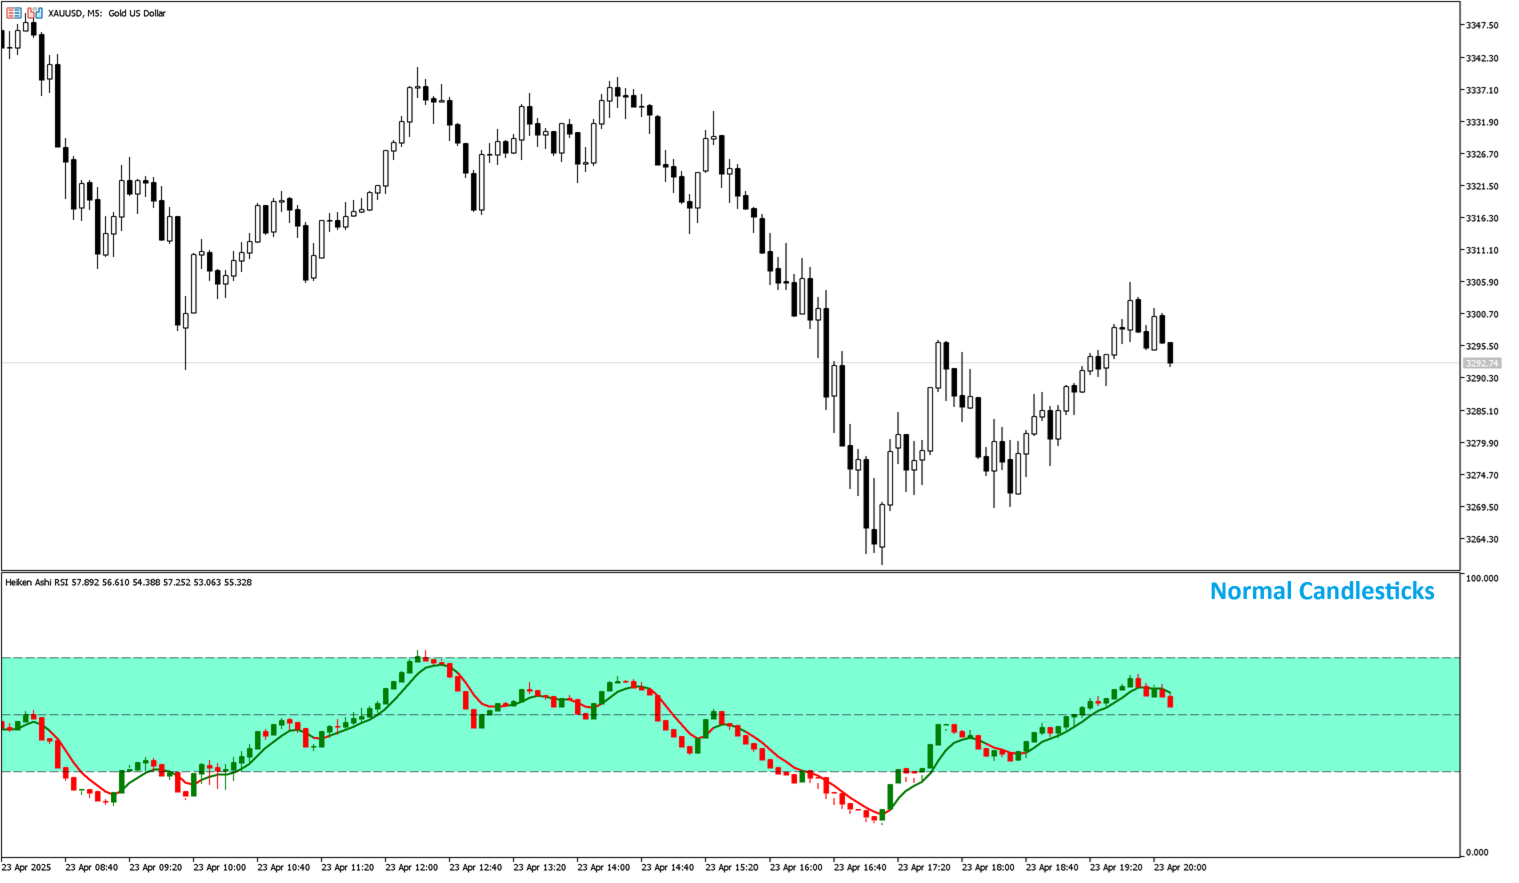
    • Heikin Ashi Kerzen: Diese werden im separaten Fenster überlagert. Dies ist auch für Linien oder normale Kerzen möglich.

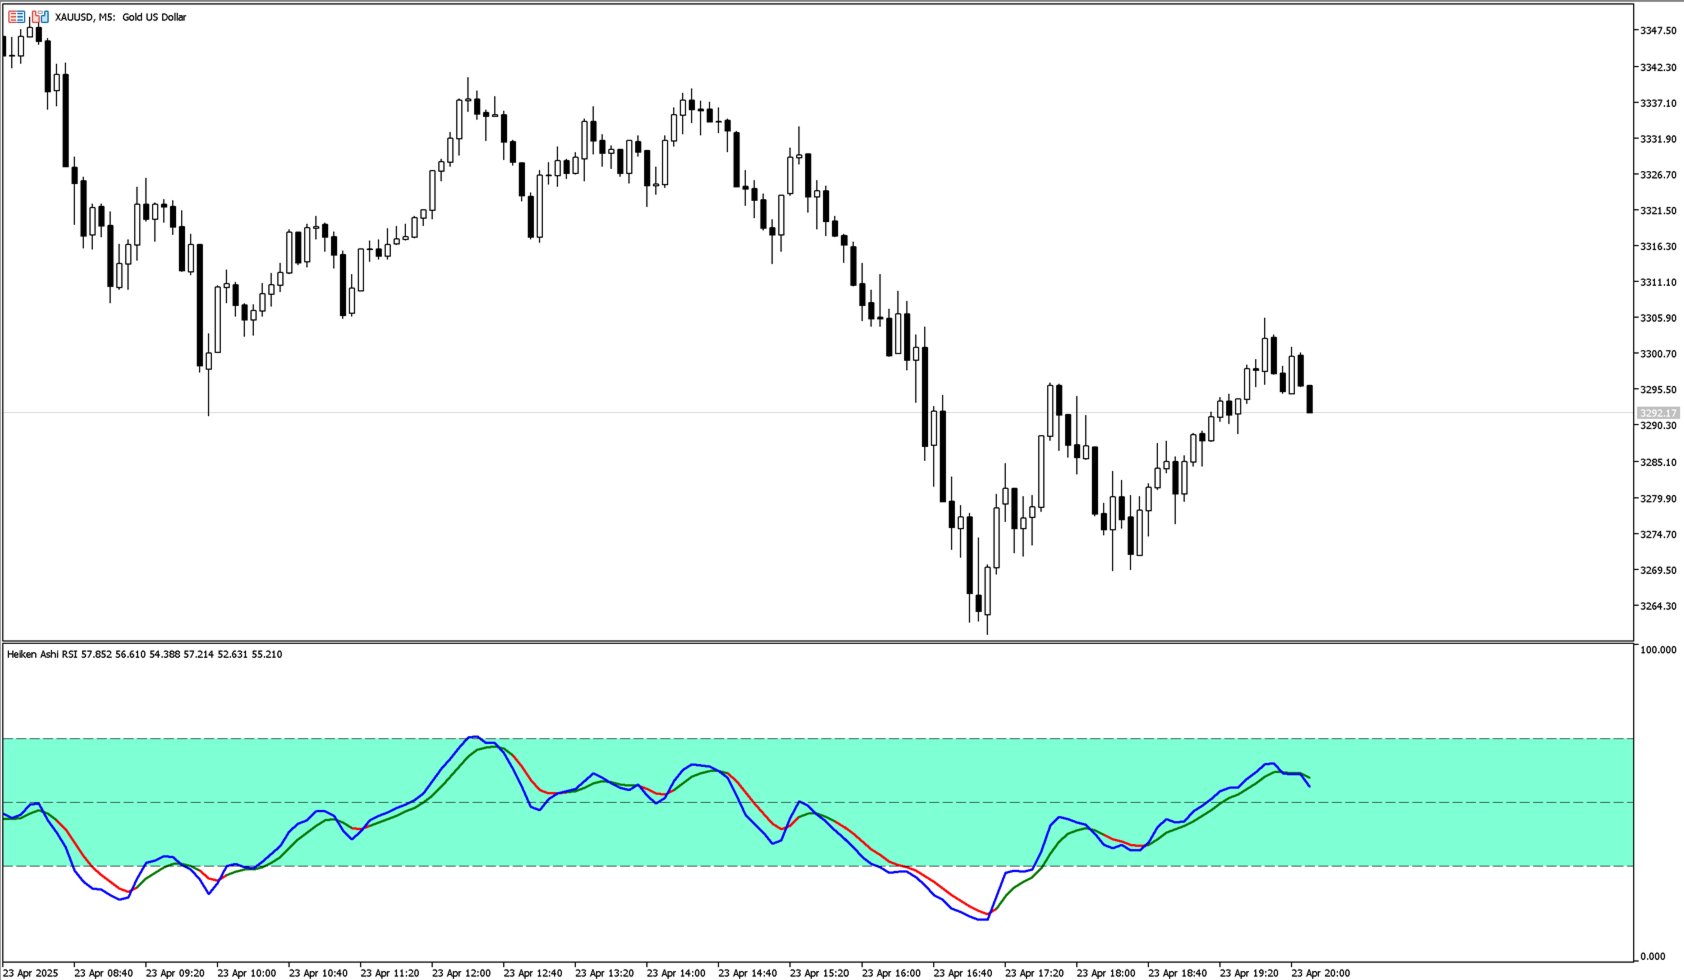
    • Geglättete RSI-Variante: Eine Version, die glatter ist und eine eigene separate Länge von den Kerzen hat.

  3. Anpassbare Eingaben:

    • Länge: Legt den Zeitraum für die RSI- und Kerzenberechnungen fest.

    • Glättung: Steuert den Grad der Glättung, der auf den RSI und die Kerzen angewendet wird.

    • Moving Average Anzeige: Option, die Anzeige eines gleitenden Durchschnitts zu aktivieren oder zu deaktivieren.

    • Farben: Passen Sie die Farben der Plots und Füllflächen für eine einfachere visuelle Analyse an.


Der Heikin Ashi RSI ist ein vielseitiger Indikator mit folgenden Komponenten:

  1. RSI-Berechnung:

    • Der RSI wird für die Open-, High-, Low- und Close-Preise berechnet, die dann verwendet werden, um die Heikin Ashi Kerzendaten (Open, High, Low, Close) zu generieren. Die RSI-Werte werden durch einen Glättungsalgorithmus gefiltert, um das Rauschen zu reduzieren.

  2. Heikin Ashi Kerzenberechnung:

    • Die Heikin Ashi Kerzen werden basierend auf den berechneten RSI-Werten gezeichnet. Die Farben dieser Kerzen ändern sich je nach der Bewegung des RSI und bieten eine visuelle Darstellung der Markttrends.

  3. Gleitender Durchschnitt (Optional):

    • Ein gleitender Durchschnitt kann zusammen mit den RSI-Daten angezeigt werden, um eine weitere Glättung zu ermöglichen, sodass die Händler die Trendrichtung besser erkennen können.

  4. Visualisierung:

    • Die RSI-Werte werden entweder als Oszillator oder in Form von Heikin Ashi Kerzen dargestellt, mit anpassbaren Farben und Stilen. Zusätzlich kann der Indikator ein Histogramm erzeugen, um Veränderungen besser darzustellen.


Interpretation:

  • Der Heikin Ashi RSI zielt darauf ab, glattere und zuverlässigere Handelssignale im Vergleich zum Standard-RSI zu liefern. Wie bei allen Indikatoren sollte er jedoch in Verbindung mit anderen Analysetechniken verwendet werden.

  • Nutzen Sie die Farbänderungen in den Heikin Ashi Kerzen, um Trendwenden zu erkennen. Eine grüne Kerze zeigt einen Aufwärtstrend an, während eine rote Kerze einen Abwärtstrend signalisiert.


Dies ist keine Finanzberatung! Dies ist ein Echtzeit-Indikator und überarbeitet sich nicht.


Empfohlene Produkte
Based on the trading model/strategy/system of gold double-position hedging and arbitrage launched by Goodtrade Brokers, problems encountered in daily operations: 1. Account B immediately places an order immediately following account A. 2: After account A places an order, account B will automatically copy the stop loss and take profit. 3: Account A closes the position of Account B and closes the position at the same time. 4: When account B closes the position, account A also closes the position.
Der SMC Venom Model BPR Indikator ist ein professionelles Tool für Trader, die mit dem Smart Money (SMC)-Konzept arbeiten. Er identifiziert automatisch zwei wichtige Muster im Kurschart: FVG   (Fair Value Gap) ist eine Kombination aus drei Kerzen, wobei zwischen der ersten und dritten Kerze eine Lücke besteht. Diese bildet eine Zone zwischen den Niveaus, in der es keine Volumenunterstützung gibt, was häufig zu einer Kurskorrektur führt. BPR   (Balanced Price Range) ist eine Kombination aus zwe
Discover our groundbreaking scalping trading bot designed for small trading accounts. This bot utilizes a simple fractal breakout strategy, executing fast trades based on local highs and lows. Key Features: Trading System: Utilizes fractals for entry points in both long and short positions. Settings Explained: Detailed inputs including timeframes, risk management, and ATR-based stop-loss and take-profit levels. Optimal Trading Times: Best used with pairs like EUR/USD or USD/JPY during liquid ma
Tools zum Verdienen und Forschen. Der Kern der Handelssignale und -strategie basiert auf dem Algorithmus des Autors zur Bildung von Preisprognosemustern. Für jedes Instrument anwendbar! Ergänzt um ein Kontrollsystem basierend auf dem MA "Nine-Tailed Fox" , das das Signal so genau wie möglich für den Markt, das Instrument und den Arbeitszeitraum aktualisiert und anpasst. Zugelassen: Alle Instrumente in allen Märkten (es gibt Ausnahmen). Für wen: Hedgefonds, Fonds- und Vermögensverwalter, Anlag
This is a multi-symbol and multi-timeframe table-based indicator designed for a candlestick patterns detection with 46 patterns for META TRADER 5. Each formation has own image for easier recognition. Here you find most popular formations such as "Engulfing", "Hammer", "Three Line Strike", "Piercing" or Doji - like candles. Check my full list of patterns on my screenshots below. Also you can not only switch all bearish or bullish patterns from input, but also select formation for a specified symb
Premium-Level ist ein einzigartiger Indikator mit mehr als 80% Genauigkeit der richtigen Vorhersagen! Dieser Indikator wurde von den besten Trading-Spezialisten seit mehr als zwei Monaten getestet! Den Indikator des Autors finden Sie nirgendwo anders! Anhand der Screenshots können Sie sich von der Genauigkeit dieses Tools überzeugen! 1 ist ideal für den Handel mit binären Optionen mit einer Ablaufzeit von 1 Kerze. 2 funktioniert bei allen Währungspaaren, Aktien, Rohstoffen, Kryptowährungen
Wir stellen den revolutionären MT5-Indikator DARWIN Assistant   vor – Ihr ultimativer Zugang zur Welt des erfolgreichen Handels! DARWIN Assistant   wurde mit Präzision und Fachwissen entwickelt und verfolgt eine spezielle Strategie, die die Leistungsfähigkeit fortschrittlicher technischer Indikatoren – RSI, Stochastik, CCI und Trends – über alle Zeitrahmen hinweg nutzt. Machen Sie sich auf ein außergewöhnliches Handelserlebnis gefasst, denn dieser hochmoderne Indikator bietet Ihnen die genauest
Owl Smart Levels MT5
Sergey Ermolov
4 (29)
MT4-Version  |  FAQ Der Owl Smart Levels Indikator ist ein komplettes Handelssystem innerhalb eines Indikators, der so beliebte Marktanalysetools wie die fortschrittlichen Fraktale von Bill Williams , Valable ZigZag, das die richtige Wellenstruktur des Marktes aufbaut, und Fibonacci-Levels , die die genauen Einstiegslevels markieren, enthält in den Markt und Orte, um Gewinne mitzunehmen. Detaillierte Strategiebeschreibung Anleitung zur Verwendung des Indikators Berater-Assistent im Handel Owl H
GoldTrader
Yashar Seyyedin
Please backtest with the exact balance of your live account before applying to real money. ==> If account balance is too low it may not trade at all! For MT4 version please contact via private message. martingale version is available here . Strategy description - Detect trend based on EMA18-EMA50-SMA200 alignment in three time frames: M15, H1, H4 - Trade in trend direction and exit when above alignment is broken. - The bot is tuned to trade XAUUSD(Gold). - The bot output is break even in rangin
FREE
Noize Absorption Index - is the manual trading system that measures the difference of pressure between bears forces and bulls forces. Green line - is a noize free index that showing curent situation. Zero value of index shows totally choppy/flat market.Values above zero level shows how powerfull bullish wave is and values below zero measures bearish forces.Up arrow appears on bearish market when it's ready to reverse, dn arrow appears on weak bullish market, as a result of reverse expectation.
Dies ist wahrscheinlich der vollständigste Indikator für die automatische Erkennung der harmonischen Preisbildung, den Sie für die MetaTrader-Plattform finden können. Es erkennt 19 verschiedene Muster, nimmt Fibonacci-Projektionen genauso ernst wie Sie, zeigt die potenzielle Umkehrzone (PRZ) an und findet geeignete Stop-Loss- und Take-Profit-Werte. [ Installationsanleitung | Update-Anleitung | Fehlerbehebung | FAQ | Alle Produkte ] Es erkennt 19 verschiedene harmonische Preisbildungen Darges
Gyroscopes mt5
Nadiya Mirosh
5 (2)
Gyroscope        professional forex expert   (for EURUSD, GBPUSD, USDJPY, AUDUSD, USDCHF, EURGBP, EURJPY, NZDUSD, USDCAD, EURCHF, AUDJPY, CADJPY pairs)   alyzing the market using the Elliot Wave Index. Elliott wave theory is the interpretation of processes in financial markets through a system of visual models (waves) on price charts. The author of the theory, Ralph Elliott, identified eight variants of alternating waves (of which five are in the trend and three are against the trend). The mov
EA Studio XAUUSD
Duc Cuong Nguyen
Entry: The  EA is an expert advisor for scalping and averaging in on the M5 chart of XAUUSD. This powerful tool continuously scans the market, identifying high-quality trading setups based on specific trading hours / trading sessions. The entry model is a collaboration of both candlestick patterns and indicators. Management: Through extensive testing and a 5 year Dukascopy data optimization, the EA has shown an impressive strike rate of 100%. In the rare event that a trade goes against us, the
Der Trendfänger: Die Strategie des Trendfängers mit Alarmindikator ist ein vielseitiges technisches Analysewerkzeug, das Händlern hilft, Markttrends und potenzielle Ein- und Ausstiegspunkte zu identifizieren. Sie verfügt über eine dynamische Trendfängerstrategie, die sich den Marktbedingungen anpasst, um eine klare visuelle Darstellung der Trendrichtung zu ermöglichen. Händler können die Parameter an ihre Vorlieben und Risikotoleranz anpassen. Der Indikator hilft bei der Trendidentifikation, s
FREE
DS Gold Robot MT5
Marzena Maria Szmit
4.18 (22)
Introducing the DS Gold Robot, your ultimate companion in navigating the intricate world of XAUUSD trading. Developed with precision and powered by cutting-edge algorithms, DS Gold is a forex robot meticulously crafted to optimize your trading performance with  XAUUSD pairs . With its advanced analytical capabilities,  DS Gold  Robot   constantly monitors the gold market, identifying key trends , patterns, and price movements with lightning speed. The DS Gold Robot opens positions every day from
Bober Real MT5
Arnold Bobrinskii
4.76 (17)
Bober Real MT5 is a fully automatic Forex trading Expert Advisor. This robot was made in 2014 year and did a lot of profitbale trades during this period. So far over 7000% growth on my personal account. There was many updates but 2019 update is the best one. The robot can run on any instrument, but the results are better with EURGBP, GBPUSD, on the M5 timeframe. Robot doesn't show good results in tester or live account if you run incorrect sets. Set files for Live accounts availible only for cu
Scalper Pivot
Yosi Malatta Madsu
Scalper Pivot detects respectable small reversal areas that can be used to mark repeatable opportunity windows. For M1 timeframe. Setup/inputs: First, set one pip on price, e.g. EURUSD to 0.0001, USDJPY to 0.01, or XAUUSD to 0.1. Or select AUTO for autodetect common symbols. Set minimum and maximum range on pips, if you want scalp between 10 to 20 pips then set it to 10 and 20 respectively. Set detection window to any candle count you want. Set it too low or too high would be less accurate.
Advanced Trading Chaos  The main purpose of the indicator is to help the trader detect the signals described by Bill Williams in his books to make a quick and correct trading decision. 1)Bullish/Bearish Reversal Bar(BDB) 2) Divergent Bar(DB) 3) Second Sage Signal — the third consecutive Awesome Oscillator bar  4) Working fractals (Fractals that worked above/below the red forehead  5) Three bar coloring modes 5.1) Coloring of bars according to the AO indicator (Including the squatting bar) 5.2
Fibo Channels
Jeffrey Quiatchon
Fibo Daily Channel Indicator The  Indicator is a powerful tool for traders, providing precise daily support and resistance levels based on Fibonacci retracement and extension calculations. This indicator automatically draws key pivot points (PP, R1, R2, S1, S2) as well as additional extension levels (R3, R4, S3, S4), helping traders identify potential reversal and breakout zones with ease. It includes customizable alerts and push notifications, allowing traders to receive updates whenever the pr
Awesome Oscillator by Bill Williams with the ability to fine-tune and replace the averaging algorithms of the indicator, which significantly expands the possibilities of using this oscillator in algorithmic trading and brings it closer in its properties to such an indicator as the MACD. To reduce price noise, the final indicator is processed with an additional Smooth averaging. The indicator has the ability to give alerts, send mail messages and push signals when the direction of movement of th
Was: $249  Now: $149   Market Profile defines a number of day types that can help the trader to determine market behaviour. A key feature is the Value Area, representing the range of price action where 70% of trading took place. Understanding the Value Area can give traders valuable insight into market direction and establish the higher odds trade. It is an excellent addition to any system you may be using. Inspired by Jim Dalton’s book “Mind Over Markets”, this indicator is designed to suit the
To download MT4 version please click here . - This is the exact conversion from TradingView: "Trend Direction Force Index - TDFI [wm]" By "causecelebre". - The screenshot shows similar results from tradingview and Metatrader when tested on ICMarkets on both platforms. - This indicator uses multiple levels of averaging to detect trend strength. - You can optimize filter low and filter high levels to achieve best results. - You have access to buffers to use in EAs. - This is a light-load processin
After 6 Years of Data Testing and Experience, My Strategy is Now Live as an Intelligent Trading Advisor (EA)! Introducing Angry Trend Bull EA – The Ultimate Trading System for Gold and Forex! Angry Trend Bull EA is built upon over six years of rigorous market analysis, backtesting, and real-world trading experience. This is not just another automated trading system—it’s a precision-engineered, battle-tested strategy designed to dominate the markets with unparalleled stability and minimal drawdow
Smooth price for Monarch
Konstantin Gruzdev
5 (1)
The Smooth Price technical indicator is used for plotting a smoothed line as close to the price of the financial instrument as possible, and serves to eliminate its noise components. The indicator is part of the Monarch trading system, but here it is presented as an independent technical analysis tool. The indicator is based on the cluster digital filter , which, unlike the ClusterSMA , is applied directly to the price time series. Smooth Price does not redraw (except the very last, zero bar) an
Gecko EA MT5
Profalgo Limited
5 (1)
NEW PROMO: Only a few copies copies available at 349$ Next price: 449$ Make sure to check out our " Ultimate EA combo package " in our   promo blog ! Gecko runs a simple, yet very effective, proven strategy.  It looks for important recent support and resistance levels and will trade the breakouts.  This is a "real" trading system, which means it will use a SL to protect the account.  It also means it will not use any dangerous techniques like martingale, grid or averaging down. The EA shows its
Mine Farm
Maryna Kauzova
Mine Farm is one of the most classic and time-tested scalping strategies based on the breakdown of strong price levels. Mine Farm is the author's modification of the system for determining entry and exit points into the market... Mine Farm - is the combination of great potential with reliability and safety. Why Mine Farm?! - each order has a short dynamic Stop Loss - the advisor does not use any risky methods (averaging, martingale, grid, locking, etc.) - the advisor tries to get the most
Über den Indikator Dieser Indikator basiert auf Monte-Carlo-Simulationen der Schlusskurse eines Finanzinstruments. Monte Carlo ist per Definition eine statistische Methode, die verwendet wird, um die Wahrscheinlichkeit verschiedener Ergebnisse in einem Prozess zu modellieren, der auf zuvor beobachteten Ergebnissen basierende Zufallszahlen einsetzt. Wie funktioniert es? Dieser Indikator erzeugt mehrere Preisszenarien für ein Wertpapier, indem er auf historischen Daten basierende zufällige Preisä
Simo MT5
Maryna Shulzhenko
Description of   Simo : an innovative robot with a unique trading system Simo is a revolutionary trading robot that changes the rules of the game with its unique trading system. Using sentiment analysis and machine learning, Simo takes trading to a new level. This robot can work on any time frame, with any currency pair, and on the server of any broker. Simo uses its own algorithm to make trading decisions. Various approaches to analyzing input data allow the robot to make more informed decis
Market Maestro: Your Ideal Partner for Automated Forex Trading If you're looking for a reliable assistant for trading in the currency market, Market Maestro is exactly what you need. This modern Forex bot is built using the latest technologies and algorithms, allowing it to effectively analyze market data and make informed trading decisions in real-time. Key Features of Market Maestro 1. Multicurrency Capability for Broad Opportunities Market Maestro can work with a wide range of currency pairs,
Your Trend Friend
Luigi Nunes Labigalini
5 (1)
The trend is your friend! Look at the color of the indicator and trade on that direction. It does not  repaint. After each candle is closed, that's the color of the trend. You can focus on shorter faster trends or major trends, just test what's most suitable for the symbol and timeframe you trade. Simply change the "Length" parameter and the indicator will automatically adapt. You can also change the color, thickness and style of the lines. Download and give it a try! There are big movements w
Käufer dieses Produkts erwarben auch
NOTE: CYCLEMAESTRO is distributed only on this website, there are no other distributors. Demo version is for reference only and is not supported. Full versione is perfectly functional and it is supported. CYCLEMAESTRO , the first and only indicator of Cyclic Analysis, useful for giving signals of TRADING, BUY, SELL, STOP LOSS, ADDING. Created on the logic of   Serghei Istrati   and programmed by   Stefano Frisetti ;   CYCLEMAESTRO   is not an indicator like the others, the challenge was to inter
CBT Quantum Maverick Hocheffizientes Binäroptionshandelssystem CBT Quantum Maverick ist ein leistungsstarkes Handelssystem für Binäroptionen, das für Händler entwickelt wurde, die Präzision, Einfachheit und diszipliniertes Handeln suchen. Keine Anpassung erforderlich – das System ist von Anfang an optimiert. Mit etwas Übung sind die Signale leicht zu beherrschen. Hauptmerkmale: Präzise Signale: Handelssignale basierend auf der aktuellen Kerze, die auf die nächste Kerze abzielen, ohne häufige N
FxaccurateLS
Shiv Raj Kumawat
WHY IS OUR FXACCCURATE LS MT5 THE PROFITABLE ? PROTECT YOUR CAPITAL WITH RISK MANAGEMENT Gives entry, stop and target levels from time to time. It finds Trading opportunities by analyzing what the price is doing during established trends. POWERFUL INDICATOR FOR A RELIABLE STRATEGIES We have made these indicators with a lot of years of hard work. It is made at a very advanced level. Established trends provide dozens of trading opportunities, but most trend indicators completely ignore them! The
The   Time_Price_SQ9_Degree   indicator is based on the 9 Gann square. Using this indicator, you can identify strong time and price zones. The indicator displays the levels as a degree value. The degrees can be set in the settings. After launching, the MENU button appears. If it is highlighted, it can be moved to any point on the graph, and after double-clicking on it, it stops being highlighted and menu buttons appear. To hide the menu, just double-click on the button, it will become highlight
How to use Pair Trading Station Pair Trading Station is recommended for H1 time frame and you can use it for any currency pairs. To generate buy and sell signal, follow few steps below to apply Pair Trading Station to your MetaTrader terminal. When you load Pair Trading Station on your chart, Pair Trading station will assess available historical data in your MetaTrader platforms for each currency pair. On your chart, the amount of historical data available will be displayed for each currency pai
The Naveen Dynamic Square  MT5  is one of the best known  technical analysis tools  inspired  by WD Gann along with the Gann Fan and Gann Box. It is considered a cornerstone of his trading technique that is based on time and price symmetry. The Naveen Dynamic Square MT5   is a powerful tool in finance for determining support and resistance levels based on a stock's extreme price points. It works by extrapolating probable price levels from a central value, typically an all-time or cyclical high o
Reversal ALGO
Muhammad Abdullah Bhatti
Reversal Algo – Technischer Indikator zur Marktumkehranalyse Reversal Algo ist ein fortschrittlicher technischer Indikator, der speziell entwickelt wurde, um potenzielle Wendepunkte in Markttrends zu identifizieren. Durch die detaillierte Analyse historischer Preisdaten erkennt er bedeutende Hochs und Tiefs, die auf eine bevorstehende Trendänderung hinweisen können. Dieser Indikator bietet klare visuelle Signale auf dem Chart, sodass Händler Schlüsselbereiche für mögliche Umkehrungen präzise bes
Super Zone indicator
Dmitriy Sotnikov
5 (1)
Super Zone   For several years of observing the principles of the market, Super Zone worked, both then and now, because the indicator  allows you to see the trading range of the  week and even the month that major market participants use. It’s very easy to use, we work on H4 in the weekly range (  in the tester it doesn’t work in the demo mode  ) - we sell from the upper zones, we buy from the lower ones. It marks the zones from the beginning of the week (month) that are  not redrawn  , works on
This indicator is based on the mathematics of the great trader W.D. Ganna. With its help, you can easily find strong levels by analyzing swings to find the optimal entry point. The indicator works on all instruments and all timeframes. The indicator is fully manual and has control buttons. All you need to do is press the NEW button, a segment will appear, which you can place on any movement, swing or even 1 candle that you want to analyze. By placing the segment, press the OK button. A grid (th
This indicator identifies and displays zones, as it were areas of strength, where the price will unfold. The indicator can work on any chart, any instrument, at any timeframe. The indicator has two modes. The indicator is equipped with a control panel with buttons for convenience and split into two modes. Manual mode: To work with manual mode, you need to press the NEW button, a segment will appear. This segment is stretched over the movement and the LVL button is pressed. The level is displayed
TrendMaestro5
Stefano Frisetti
note: this indicator is for METATRADER4, if you want the version for METATRADER5 this is the link:  https://www.mql5.com/it/market/product/108106 TRENDMAESTRO ver 2.4 TRENDMAESTRO recognizes a new TREND in the bud, he never makes mistakes. The certainty of identifying a new TREND is priceless. DESCRIPTION TRENDMAESTRO identifies a new TREND in the bud, this indicator examines the volatility, volumes and momentum to identify the moment in which there is an explosion of one or more of these data a
TMA Channel is a price channel obtained through a special calculation method based on traditional TMA . The channel has upper, middle, and lower tracks . When the price approaches or exceeds the upper track, it is already in an overbought state, and attention should be paid to the situation of reversal and decline; When the price approaches or falls below the lower track, it is already in an oversold state, and attention should be paid to the situation of reversal and rise . The indicator will
Seconds Charts
Aleksandr Goryachev
Micro  ******************* Секундные графики MT5 ********************** Более точного инструмента для входа в сделку вы не найдёте. Входные параметры: Timeframe, sek - период построения графика, секунды Displayed bars - отображаемые бары Step of price levels, pp, 0-off - шаг отрисовки ценовых уровней, пункты Scale points per bar, 0-off - масштаб в пунктах на бар Show lines - отображение текущих уровней Show comment - отображение комментария Standard color scheme - стандартная цветовая сх
Happy entries
Godwill Fortune Otieno Juma
The  product gives optimized entries for 3min ,1 hr and day timeframes  Does well with indices  ASIAN- HK50 AND CHINA A50 USA-US30,US100,US500 GER40 ,UK100 For stocks trade with the day timeframes Happy Entry employs advanced algorithms and real-time data analysis to identify optimal entry points with unprecedented accuracy. Its adaptive nature allows it to seamlessly adjust to changing market conditions, ensuring you never miss out on profitable opportunities. Whether you're a beginner or seas
Natürlich, hier ist die Übersetzung in Deutsch: Vorstellung des Astronomie-Indikators für   MT4 / MT5 : Dein ultimativer himmlischer Trading-Begleiter Bist du bereit, deine Trading-Erfahrung auf himmlische Höhen zu heben? Suche nicht weiter als unseren revolutionären Astronomie-Indikator für MT4. Dieses innovative Tool übertrifft herkömmliche Trading-Indikatoren und nutzt komplexe Algorithmen, um dir unvergleichliche astronomische Einblicke und präzise Berechnungen zu bieten. Ein Universum an In
Hello I Want to introduce The Forex Buy Sell Arrow Premium MT5 i recently release this premium indicator! its 1000% Non Repaint Indicator, It Work Perfectly Well,, i tested it day by day, Just mind blowing Result,  Including Powerful trend Algorithm! How It Work? well, it work market trend formula, when trend Bullish Or when trend Bearish,  Recommend Timeframe M30, H1 it work all timeframe, and all currency pair, 100% non repaint, How to take signal From Forex Buy Sell Arrow Premium Ind
No promises, no hype — just real edge if you’re fortunate enough to be using this stuff --- Join the group for updates and insights : https://t.me/TPTSyncX-Traderland Introduction! to the Indicator that Connects Trend , Pattern , and Candlestick Trigger. 3 Steps in Under 30 Seconds ️ Trade effortlessly — no analysis required, Your smart assistant is ready to simplify your workflow No more chart overload. Trade with confidence using smart bias detection. Compatible with all curren
AriBot
Arman Belassarov
AriMax   – AI-Powered Trading Robot AriMax is a cutting-edge AI-powered trading robot designed to help traders maximize profits while minimizing risk. Utilizing advanced machine learning algorithms and real-time market analysis, AriMax identifies high-probability trade opportunities with precision and speed. Key Features:     AI-Driven Market Analysis   – Analyzes market trends and patterns to make data-driven trading decisions.     Automated Execution   – Places trades seamlessly with optimiz
Big Player Range
Thalles Nascimento De Carvalho
5 (3)
Die Macht von "BigPlayerRange" entdecken: Ihr starker Verbündeter in der technischen Marktanalyse BigPlayerRange ist ein fortschrittliches technisches Analysetool, das dazu entwickelt wurde, institutionelle Interessensbereiche im Markt aufzudecken. Mit diesem leistungsstarken Werkzeug können Sie präzise feststellen, wo große Marktteilnehmer aktiv sind, und Ihre Handelsstrategien entsprechend verbessern. Hauptmerkmale: Kartierung institutioneller Interessensbereiche : BigPlayerRange hebt Z
Viking Strategy Signal Indicator
E Bahamlong Bagoudjare
5 (1)
Viking_Strategy_Signal Indicator is a solution I offer to beginner, amateur, and professional traders. My scalping robot :  https://www.mql5.com/fr/market/product/133191 By purchasing this indicator, you will first save time because it automatically analyzes the market based on Dow Theory and the Smart Money Concept (High (H), Low (L), Higher High (HH), Lower Low (LL), Break of Structure (BOS) to determine market structure and trend). It is built on my strategy, which relies on the NRTR theory t
The   Gann Scalping Gold Indicator   is a robust technical analysis tool designed for precision trading in gold markets. It leverages Gann-based methodologies to identify key price levels, enabling traders to anticipate potential market reversals, breakouts, and areas of consolidation. Daily Reset Logic: Automatically resets touch statuses at the start of a new trading day, ensuring that the indicator aligns with fresh daily trends. How It Works: The indicator draws horizontal lines at predefine
VTrende Pro
Andrii Diachenko
5 (1)
VTrende Pro - MTF indicator for trend trading with a display panel for MT5 *** Videos can be translated into any language using subtitles (video language - Russian) Although the signals of the VTrende Pro indicator can be used as signals of a full-fledged trading system, it is recommended to use them in conjunction with the Bill Williams TS. VTrende Pro is an extended version of the VTrende indicator. Difference between Pro version and VTrende: - Time zones - Signal V - signal 1-2 waves -    S
WanaScalper
Isaac Wanasolo
1 (1)
A scalping indicator based on mathematical patterns, which on average gives signals with relatively small SL, and also occasionally helps to catch big moves in the markets (more information in the video) This indicator has three main types of notifications: The first type warns of a possible/upcoming signal on the next bar The second type indicates the presence of a ready signal to enter the market/open a position The third type is for SL and TP levels - you will be notified every time price re
XCalper TFO
Aecio de Feo Flora Neto
This oscillator was developed exclusively by xCalper in 2015 based on moving averages calculations to indicate and try predicting oversold and overbought levels. The fast line (white, by default) oscillates basically between values -0.5 (oversold) and +0.5 (overbought). Whenever this line crosses upward value -0.5, it means an oversold price level. When it crosses downward value +0.5, it means an overbought price level. When fast line crosses value 0.0 and returns, it is a strong pull-back indic
The Expert Advisor and the video are attached in the Discussion tab . The robot applies only one order and strictly follows the signals to evaluate the indicator efficiency. Pan PrizMA CD Phase is an option based on the Pan PrizMA indicator. Details (in Russian). Averaging by a quadric-quartic polynomial increases the smoothness of lines, adds momentum and rhythm. Extrapolation by the sinusoid function near a constant allows adjusting the delay or lead of signals. The value of the phase - wave s
Классификатор силы тренда. Показания на истории не меняет. Изменяется классификация только незакрытого бара. По идее подобен полной системе ASCTrend, сигнальный модуль которой, точнее его аппроксимация в несколько "урезанном" виде, есть в свободном доступе, а также в терминале как сигнальный индикатор SilverTrend . Точной копией системы ASCTrend не является. Работает на всех инструментах и всех временных диапазонах. Индикатор использует несколько некоррелируемых между собой алгоритмов для класси
Currency Index Watcher is a simple and user-friendly tool for whoever wish to trade Forex using currencies indexes. Currency Index Watcher is configurable and usable directly from the panel. Indexes of 8 custom currencies EUR, USD, GBP, JPY, CHF, AUD, CAD, NZD (default) Any 3-chars symbol from your market watch could be used (BTC = bitcoin, RUB = ruble, CNH = yuan etc ...) : double click the symbol label  Ability to select which currencies and made-of pairs will be analyzed : check/uncheck wante
Forex Relative Performance indicator This indicator calculates the relative strength of major currencies against the US dollar. The basic idea behind this indicator is "to buy strong currency and to sell weak currency". This indicator allows you to quickly identify the best forex pair to trade according to your trading style (Intraday, Scalping, Swing, or Long Term)
The latest most requested Binary Options arrow indicator in the Garuda Signals product line is now on MT5! Binary options signal based on multiple time frame cross over analysis. Gets confirmation from the most consistent signals known to man; Ichimoku, SMA, Bollinger Bands; and also uses the 1 Hour time frame as trend confirmation , so you don't have to open up multiple chart and waste time. - Can be used for all time frames up to 1 hour, but is most POWERFUL for 1 and 5 min options. - Place yo
SuavizadorDePrecio
Cesar Juan Flores Navarro
Funciona identificando picos de máximos y mínimos, para luego eliminarlos haciendo una linea o curva, pudiendo el usuario ingresar el valor de que tanto puede suavizar. Nos facilita poder ver la tendencia así como ver el cruce que puede hacer con otros indicadores, mostrando a simple vista los inicios y salidas de una tendencia u operación. Así también facilita la visualización de subidas y bajadas.
Weitere Produkte dieses Autors
Bayesian Trend Indicator
Dominic Michael Frehner
Der Bayesian Trend Indikator färbt jede Kerze entsprechend einer Bayes’schen Trend-Inference ein. Er berechnet zunächst die “Prior”-Trendstärke aus vier Standard-Gleitenden Durchschnitten (EMA, SMA, DEMA, VWMA) Ihrer gewählten Länge, dann die “Likelihood” aus schnelleren Versionen derselben MAs (verkürzt durch einen “Gap”). Aus beiden Werten wird die Posterior-Wahrscheinlichkeit eines Aufwärtstrends gebildet. Die Kerzen werden wie folgt eingefärbt: Grün , wenn die Posterior-Wahrscheinlichkeit ei
Der Candle Smoother ist ein Indikator für den MetaTrader 5, der Ihnen hilft, die Kursbewegungen ruhiger und klarer zu sehen. Er entfernt unnötiges "Marktrauschen" und zeigt den echten Trend besser an. Was macht der "Candle Smoother Indikator"? Er glättet die klassischen Candlestick-Daten (Open, High, Low, Close). Dadurch werden chaotische, hektische Kerzen gefiltert . Zusätzlich wird eine EMA-Linie (exponentieller gleitender Durchschnitt) berechnet, basierend auf den geglätteten Kursen. So erke
Market Pulse Indicator
Dominic Michael Frehner
Der Market Pulse ist ein vielseitiger MT5‑Indikator, der mehrere Marktmetriken kombiniert, um Trendrichtung, Momentum, Volumenflüsse und wichtige Preisniveaus in einem Tool anzuzeigen. Ziel ist es, Tradern klare Signale und visuelle Hilfen zu bieten, um Ein‑ und Ausstiegspunkte zu erkennen. Überblick über den Indikator Dynamische Profit-Wave‑EMAs (schnell, mittel, langsam) Kauf- und Verkaufspfeile Farbige Kerzen (bullish/bearish) Unterstützungs‑ und Widerstandslinien Optionalen Preis­kanal Mone
Auswahl:
Keine Bewertungen
Antwort auf eine Rezension