Heikin Ashi RSI Oscillator
- インディケータ
- Dominic Michael Frehner
- バージョン: 1.0
- アクティベーション: 5
Let us introduce the Heikin Ashi RSI Oscillator!
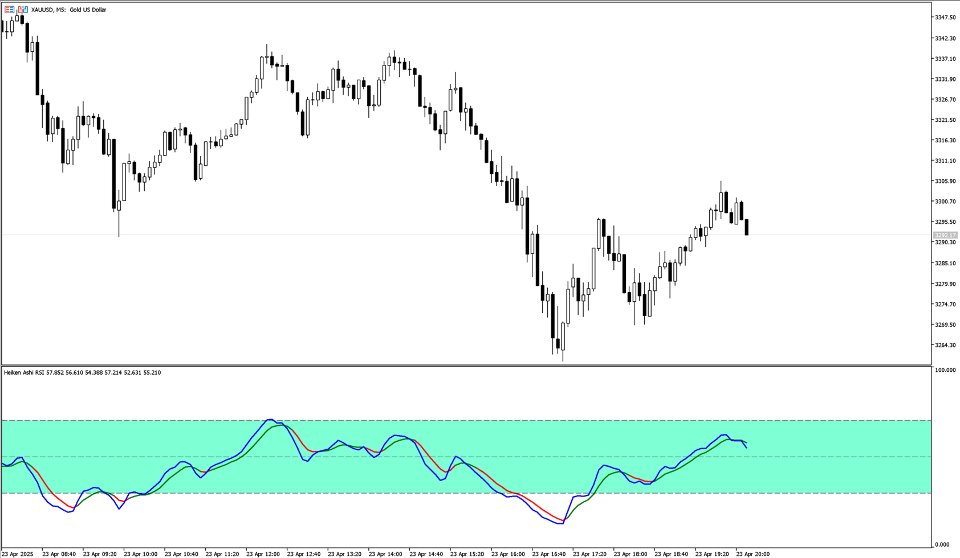
This indicator combines the concepts of Heikin Ashi candles with the RSI (Relative Strength Index) to produce an oscillator-like format that can be used to filter out some of the noise associated with standard RSI readings. This provides traders with a smoother representation of market conditions.
Here are some articles to read more about the RSI and Heikin Ashi candles:
Features
- The Heikin Ashi RSI is calculated using the RSI formula but applied to Heikin Ashi candlesticks. It aims to smooth the typical fluctuations of the RSI and provide a more stable reading.
-
Plot Options:
-
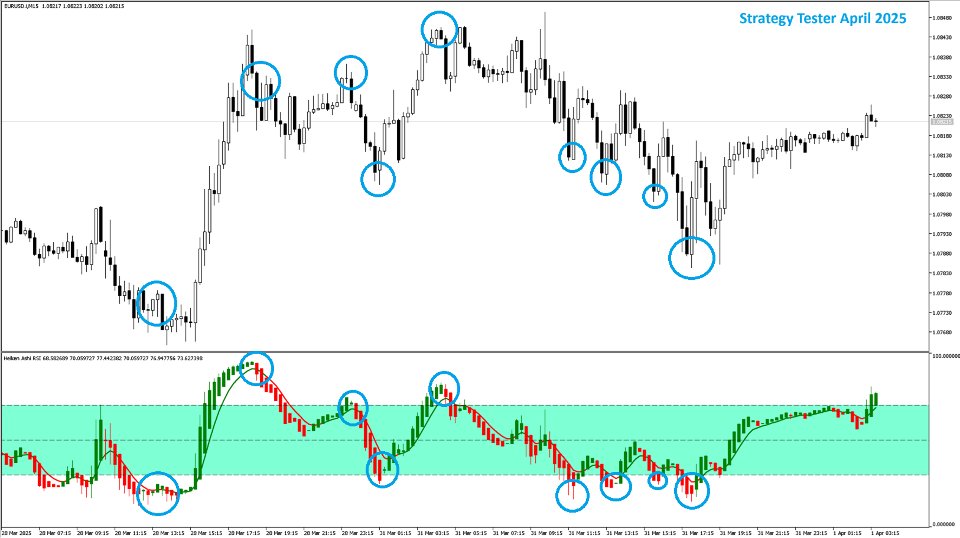
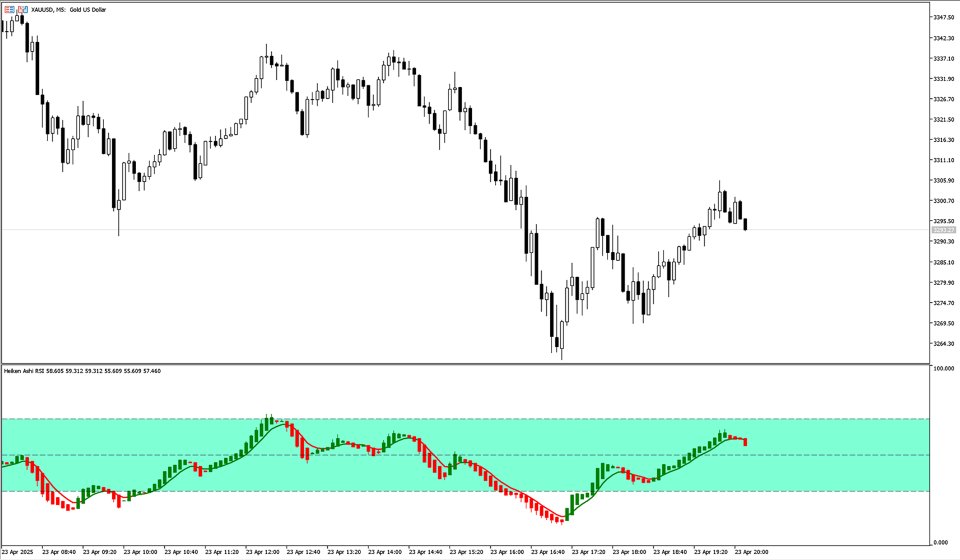
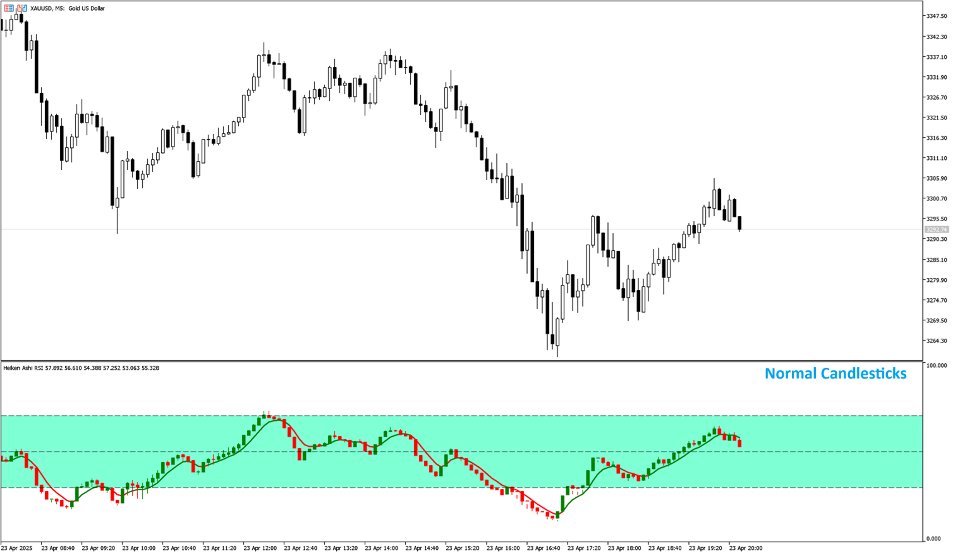
Heikin Ashi Candles: Overlaid on the separate chart window. This is also available for lines or normal candlesticks.
-
Smoothed RSI Variant: A version that is smoother and has its own separate length from the candles.
-
-
Customizable Inputs:
-
Length: Sets the period for the RSI and the candle calculations.
-
Smoothing: Controls the degree of smoothing applied to the RSI and the candles.
-
Moving Average Display: Option to enable or disable the display of a moving average.
-
Colors: Customize the colors of the plots and fill areas for easier visual analysis.
-
The Heiken Ashi RSI is a versatile indicator with the following components:
-
RSI Calculation:
-
The RSI is calculated for the open, high, low, and close prices, which are then used to generate the Heikin Ashi candlestick data (open, high, low, close). The RSI values are filtered through a smoothing algorithm to reduce noise.
-
-
Heikin Ashi Candlestick Calculation:
-
The Heikin Ashi candles are drawn based on the calculated RSI values. The colors of these candles change based on the RSI’s movement, offering a visual representation of market trends.
-
-
Moving Average (Optional):
-
A moving average can be displayed alongside the RSI data for further smoothing, allowing traders to identify trend directions.
-
-
Visualization:
-
The RSI values are presented as either an oscillator or in the form of Heikin Ashi candles, with customizable colors and styles. Additionally, the indicator can generate a histogram for better visualization of changes.
-
Interpretation:
-
The Heikin Ashi RSI aims to provide smoother and more reliable trend signals compared to the standard RSI. However, like all indicators, it should be used in conjunction with other analysis techniques.
-
Use the color changes in the Heikin Ashi candles to understand trend reversals. A green candle indicates upward momentum, while a red candle suggests downward momentum.
This is not financial advice! This is a realtime indicator and doesn't repaint.
