• Übersicht
  • Bewertungen
  • Diskussion

Heiken Ashi Ext

What is Heiken Ashi? 
 
Heiken Ashi is a charting method that can be used to predict future price movements. The indicator builds candlesticks similar to traditional ones. However, unlike a regular candlestick chart, the Heiken Ashi chart tries to filter out some of the market noise to better identify trend movements in the market.


How is Heiken Ashi calculated?

Heiken Ashi uses the COHL formula, which means "Close, Open, Maximum, Minimum". These are the four components that affect the shape, size and direction of candlesticks. The formula for their calculation is given below:
Y1. C = (C + O + H + L ) / 4.
2. O = (O_pred + C_pred) / 2.
3. H = The highest value of H , opening and closing.

4. L = The lowest value of L , opening or closing.

C , O , H , L - closing prices, opening price, highest price, lowest price. All these prices are taken from the current settlement bar.  
O pre , Spread - previous values of O and C.


What is the difference between the Heiken Ashi Ext indicator and the regular Heiken Ashi? 

In general, the calculation method of Heiken Ashi Ext is the same as that of a regular Heiken Ashi. But when calculating Heiken Ashi Ext, the price is subjected to additional filtering and smoothing.


How to use Heiken Ashi Ext?

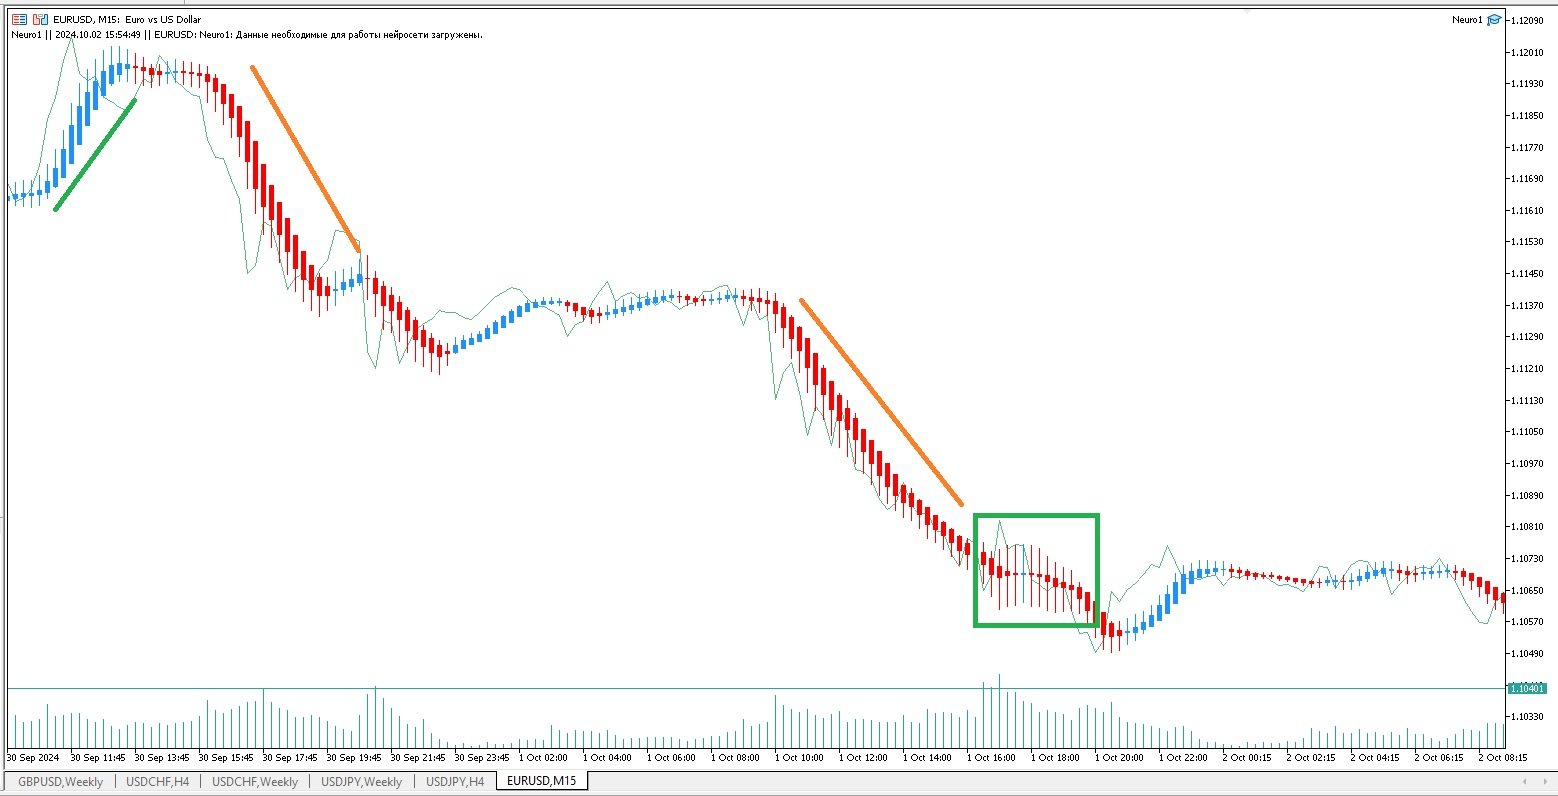
Although Heiken Ashi Ext is recommended to be considered as a trend indicator.

A distinctive feature of Heiken Ashi Ext is a small or absent shadow in the presence of pronounced movement. For bullish candles, we are talking about the lower shadows.  For "bearish" candles, we are talking about upper shadows. 

1. The formation of the first full-bodied candle (rising or falling) with a single shadow coinciding in the direction. This moment is considered as a possible beginning of a trend movement, ascending or descending. After such a candle, it is recommended to start searching for an entry point into the market in the direction of the trend indicated by the Heiken Ashi Ext candle. 

2. Forming a candle with a long body and both shadows. It is perceived as a sign of slowing down or a possible start of correction. In this case, traders are advised to close some of the positions open in the direction of the trend or to shift the Stop Loss order.

3. Formation of a doji candle with a short body and both long shadows. It is believed that this is a signal of the end of a trend (transition to a flat) or a reversal. It is recommended to close open positions and start searching for entry points in the opposite direction. 

You should not build your trading system only on the Heiken Ashi Ext indicator. The signals of this indicator require confirmation from other sources. 

The simplest strategy involves recognizing a signal as formed if it has received confirmation on at least two bars. For example, a position using this method is opened on the third full-bodied candle of the same color as the signal one. 

Together with Heiken Ashi Ext, various indicators are used, most often Stochastic or MACD oscillators. In this case, oscillators are the source of the signal, and Heiken Ashi Ext candlesticks are used for confirmation. 


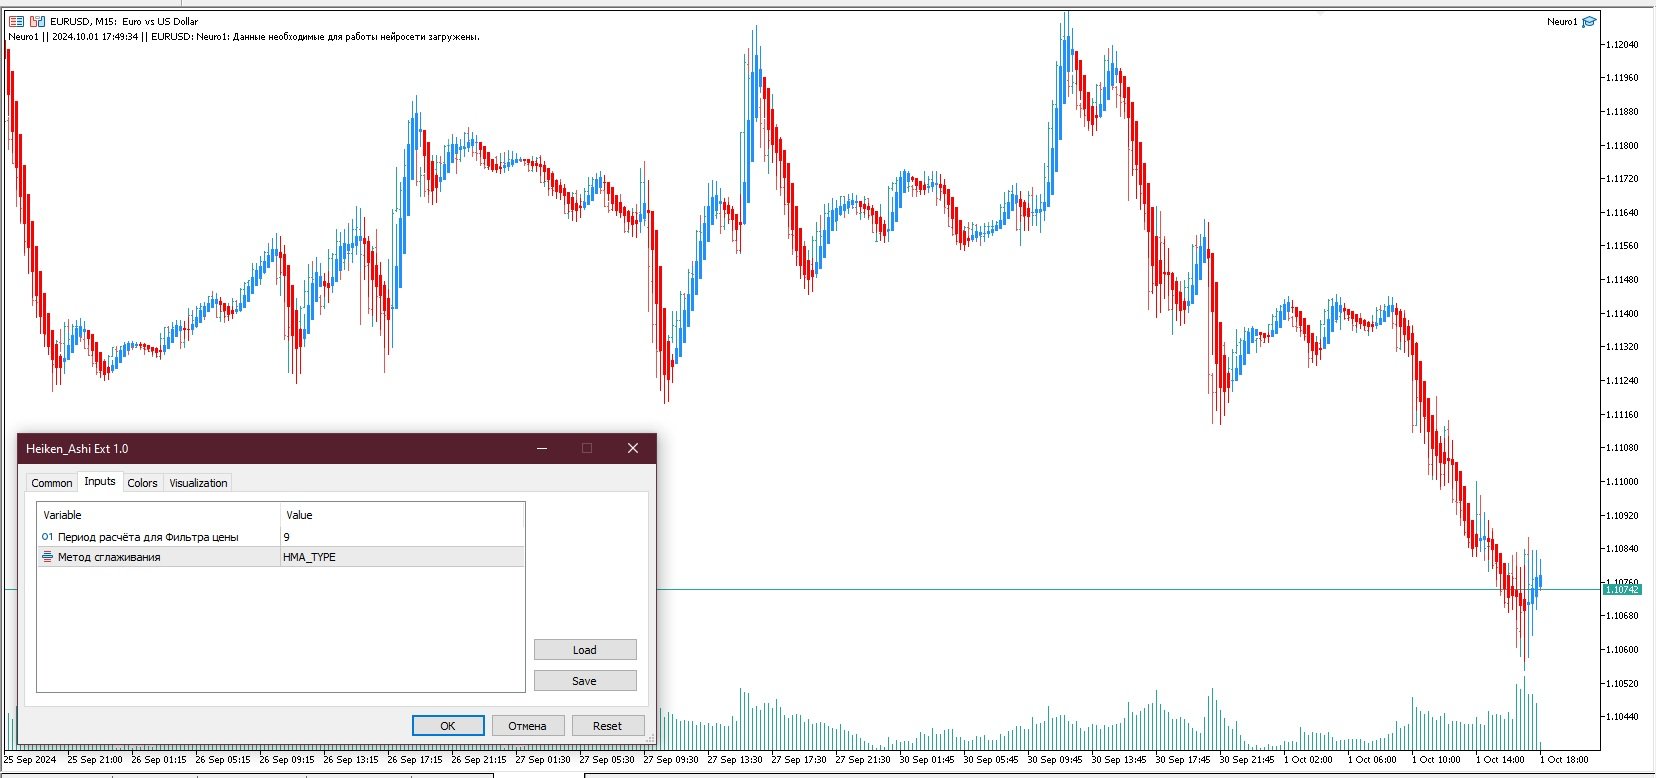
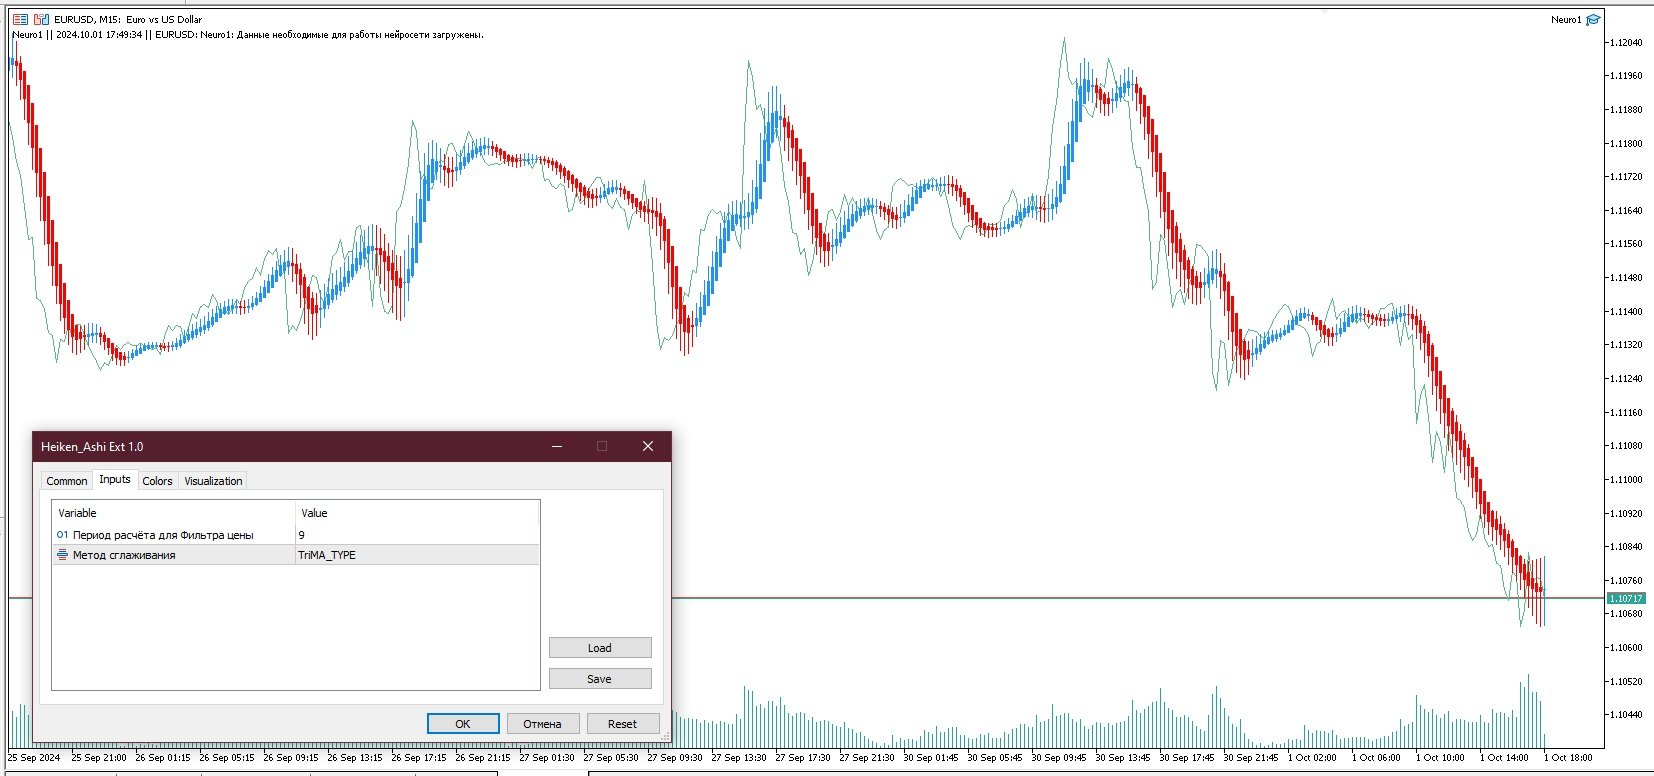
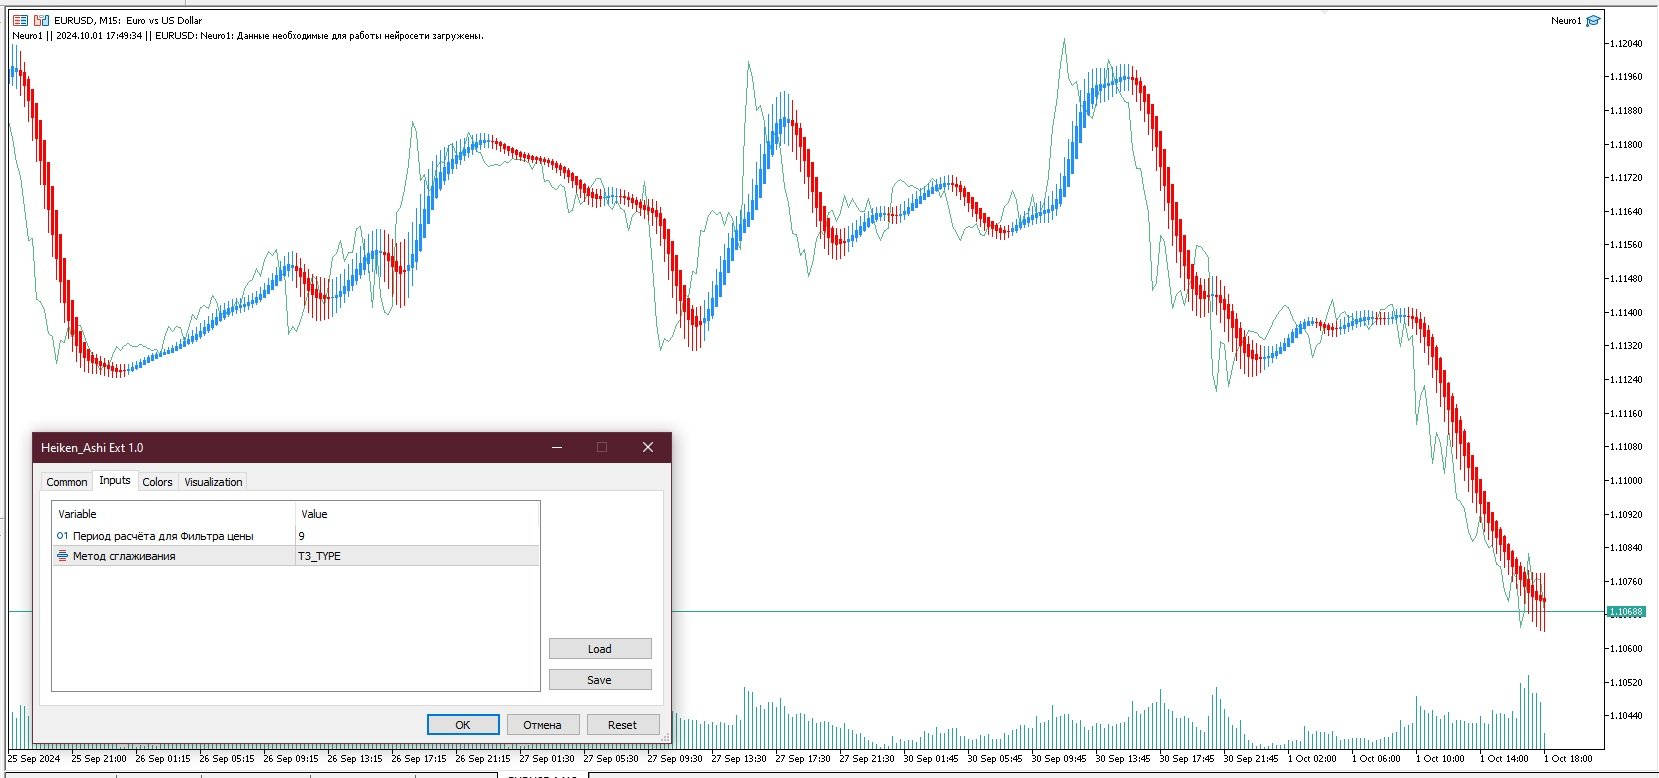
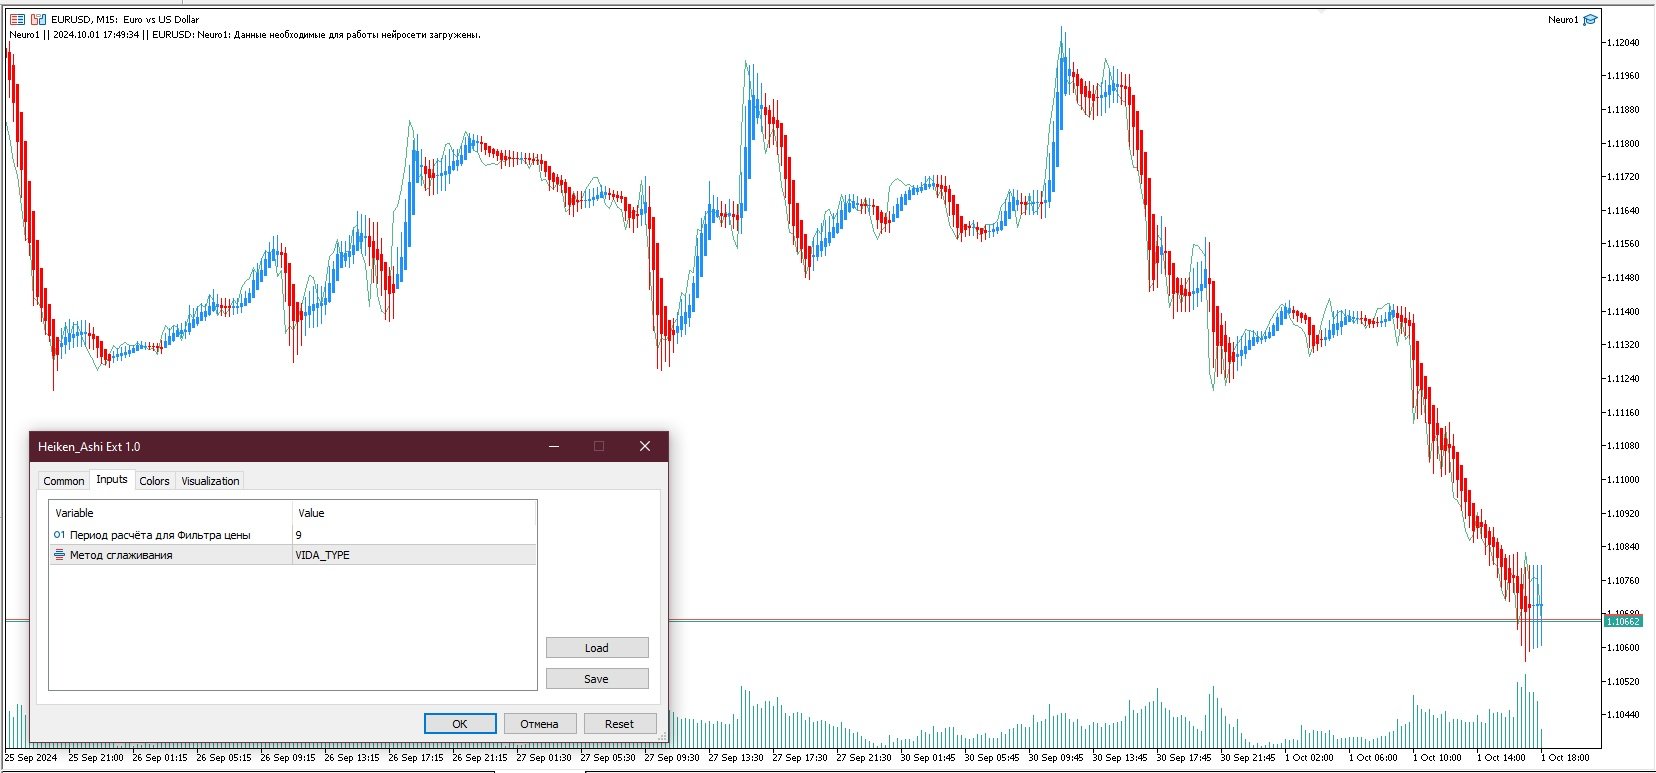
The Input Parameters

  • Calculation period for the Price Filter is the number of bars involved in filtering the current indicator value
  • Smoothing method is a method of smoothing the price values of a chart
Empfohlene Produkte
Owl Smart Levels MT5
Sergey Ermolov
4.07 (28)
MT4-Version  |  FAQ Der Owl Smart Levels Indikator ist ein komplettes Handelssystem innerhalb eines Indikators, der so beliebte Marktanalysetools wie die fortschrittlichen Fraktale von Bill Williams , Valable ZigZag, das die richtige Wellenstruktur des Marktes aufbaut, und Fibonacci-Levels , die die genauen Einstiegslevels markieren, enthält in den Markt und Orte, um Gewinne mitzunehmen. Detaillierte Strategiebeschreibung Anleitung zur Verwendung des Indikators Berater-Assistent im Handel Owl H
Trend Monitor MT5
Pavel Zamoshnikov
4.5 (2)
The indicator generates early signals basing on ADX reading data combined with elements of price patterns. Works on all symbols and timeframes. The indicator does not redraw its signals. You see the same things on history and in real time. For better visual perception signals are displayed as arrows (in order not to overload the chart). Features The best results are obtained when the indicator works on two timeframes. For example: M30 – the indicator shows the main trend; M5 – the indicator ge
Your Trend Friend
Luigi Nunes Labigalini
5 (1)
The trend is your friend! Look at the color of the indicator and trade on that direction. It does not  repaint. After each candle is closed, that's the color of the trend. You can focus on shorter faster trends or major trends, just test what's most suitable for the symbol and timeframe you trade. Simply change the "Length" parameter and the indicator will automatically adapt. You can also change the color, thickness and style of the lines. Download and give it a try! There are big movements
Renko Gold
Ignacio Agustin Mene Franco
Renko Gold! clearly indicates the floors and ceilings where it goes from 4 lines, the line below that marks the floor in green confirming with the thinnest line clarifies the purchase entry, the same is for sale, the top line marks the ceiling and the thinnest red line marks the sale, This indicator works for all temporalities! For Forex and Synthetic Indices markets! It also works for crypto markets! Good profit! World Investor.
Magic Finger can help you identify trends and trading opportunities clearly. The finger points to the open position signal, and the discoloration line is confirmed by the trend. If you are a day trader, you can choose to trade during a period of active trading, referring to the discoloration line as the basis for the next order, finger signal as a filter. If you are a trend trader, you can choose a period above H1, wait for the appearance of the finger signal in the key price area, and enter t
Atomic Analyst MT5
Issam Kassas
4.42 (19)
Zunächst einmal ist es erwähnenswert, dass dieser Handelsindikator nicht neu malt, nicht neu zeichnet und keine Verzögerung aufweist, was ihn sowohl für manuellen als auch für Roboterhandel ideal macht. Benutzerhandbuch: Einstellungen, Eingaben und Strategie. Der Atom-Analyst ist ein PA-Preisaktionsindikator, der die Stärke und das Momentum des Preises nutzt, um einen besseren Vorteil auf dem Markt zu finden. Ausgestattet mit fortschrittlichen Filtern, die helfen, Rauschen und falsche Signale z
Der Indikator zeigt harmonische Muster auf dem Chart,   ohne   mit minimaler Verzögerung neu zu zeichnen. Die Suche nach Indikator-Tops basiert auf dem Wellenprinzip der Preisanalyse. Mit den erweiterten Einstellungen können Sie Parameter für Ihren Handelsstil auswählen. Beim Öffnen einer Kerze (Bar) wird bei der Bildung eines neuen Musters ein Pfeil der wahrscheinlichen Richtung der Preisbewegung festgelegt, der unverändert bleibt. Der Indikator erkennt folgende Muster und deren Varianten: ABCD
PipFinite Trend PRO MT5
Karlo Wilson Vendiola
4.85 (574)
Breakthrough Solution For Trend Trading And Filtering With All Important Features Built Inside One Tool! Trend PRO's smart algorithm detects the trend, filters out market noise and gives entry signals with exit levels. The new features with enhanced rules for statistical calculation improved the overall performance of this indicator. Important Information Revealed Maximize the potential of Trend Pro, please visit www.mql5.com/en/blogs/post/713938 The Powerful Expert Advisor Version Automa
SolarTrade Suite Finanzindikator: Jupiter Market Indicator – Ihr zuverlässiger Führer in der Welt der Finanzmärkte! Dies ist ein Trendindikator, der spezielle innovative und fortschrittliche Algorithmen zur Berechnung seines Wertes verwendet und zudem ein ansprechendes Design aufweist. Die Messwerte dieses Indikators sind sehr leicht zu verstehen: Blau – Kaufen, Rot – Verkaufen. Sehen Sie sich unsere anderen Produkte aus der SolarTrade Suite-Reihe am Ende der Beschreibung an. Möchten Si
SolarTrade Suite Finanzindikator: Venus Market Indicator – Ihr zuverlässiger Führer in der Welt der Finanzmärkte! Dies ist ein Oszillator, der spezielle innovative und fortschrittliche Algorithmen zur Berechnung seines Wertes verwendet und zudem ein ansprechendes Design aufweist. Die Messwerte dieses Indikators sind sehr leicht zu verstehen: Blau – Kaufen, Rot – Verkaufen. Je heller die Farbe, desto stärker das Signal. Sehen Sie sich unsere anderen Produkte aus der SolarTrade Suite-Reih
US30NinjaMT5
Satyaseelan Shankarananda Moodley
US30 Ninja is a 5 minute scalping indicator that will let know you when there is a trade set up (buy or sell). Once the indicator gives the trade direction, you can open a trade and use a 30 pip stop loss and a 30 pip to 50 pip take profit. Please trade at own own risk. This indicator has been created solely for the US30 market and may not yield positive results on any other pair. 
Volality Index Scalper
Lesedi Oliver Seilane
5 (1)
Volality Index scalper indicator  Meant for Volality pairs such as Volality 10, 25, 50, 75 and 100 The indicator works on all timeframes from the 1 minute to the monthly timeframe the indicator is non repaint the indicator has 3 entry settings 1 color change on zero cross 2 color change on slope change 3 color change on signal line cross Orange line is your sell signal Blue line is your buy signal.
Indicator and Expert Adviser  EA Available in the comments section of this product. Download with Indicator must have indicator installed for EA to work. Mt5 indicator alerts for bollinger band and envelope extremes occurring at the same time. Buy signal alerts occur when A bullish candle has formed below both the lower bollinger band and the lower envelope  Bar must open and close below both these indicators. Sell signal occur when A bear bar is formed above the upper bollinger band and upp
TrendDetect
Pavel Gotkevitch
The Trend Detect indicator combines the features of both trend indicators and oscillators. This indicator is a convenient tool for detecting short-term market cycles and identifying overbought and oversold levels. A long position can be opened when the indicator starts leaving the oversold area and breaks the zero level from below. A short position can be opened when the indicator starts leaving the overbought area and breaks the zero level from above. An opposite signal of the indicator can
Noize Absorption Index - is the manual trading system that measures the difference of pressure between bears forces and bulls forces. Green line - is a noize free index that showing curent situation. Zero value of index shows totally choppy/flat market.Values above zero level shows how powerfull bullish wave is and values below zero measures bearish forces.Up arrow appears on bearish market when it's ready to reverse, dn arrow appears on weak bullish market, as a result of reverse expectation.
LT Rainbow Trend
Thiago Duarte
5 (1)
Do you, like me, like to trade with the trend? Then this indicator will help you! Rainbow Trend is a trend indicator, which uses several Moving Averages on the chart. It measures different trend strenght zones for different periods: very long term, long term, mid term, short term and very short term. Each zone has its color, and it is possible to have sound alert when the prices leaves a zone and enters another. Its configuration is very simple. If you find any bug or have any suggestions, co
Candle Pattern Finder MT5
Pavel Zamoshnikov
4.2 (5)
This indicator searches for candlestick patterns. Its operation principle is based on Candlestick Charting Explained: Timeless Techniques for Trading Stocks and Futures by Gregory L. Morris. If a pattern is detected, the indicator displays a message at a bar closure. If you trade using the MetaTrader 4 terminal, then you can download the full analogue of the " Candle Pattern Finder for MT4 " indicator It recognizes the following patterns: Bullish/Bearish (possible settings in brackets) : Hamme
The Jackson Auto Candlestick Pattern . It a powerful price action tool which auto detect and alert a hided powerful candlestick patterns . It came with few different chart skins. You can use this indicator alone to make profit, but it powerful when you combine it with trendlines, You can download The Jackson Auto Trendlines for free Link : UCRW695l9Wgg2ucnnf5DL5Vw  List of Candlestick Pattern it detect   1. Bullish & Bearish Engulfing's 2. Top and Bottom Tweezer 3. Bullish and Bearish Harams 4.
SolarTrade Suite Finanzindikator: Saturn Market Indicator – Ihr zuverlässiger Führer in der Welt der Finanzmärkte! Dies ist ein Preiskanalindikator, der spezielle innovative und fortschrittliche Algorithmen zur Berechnung seines Wertes verwendet und zudem ein ansprechendes Design aufweist. Das Verstehen der Messwerte dieses Indikators ist sehr einfach: Handeln Sie von den Grenzen aus sowohl bei einem Ausbruch als auch bei einem Rebound. Sehen Sie sich unsere anderen Produkte aus der Solar
Zunächst einmal ist es wichtig zu betonen, dass dieses Handelstool ein Nicht-Repaint-, Nicht-Redraw- und Nicht-Verzögerungsindikator ist, was es ideal für professionelles Trading macht. Online-Kurs, Benutzerhandbuch und Demo. Der Smart Price Action Concepts Indikator ist ein sehr leistungsstarkes Werkzeug sowohl für neue als auch erfahrene Händler. Er vereint mehr als 20 nützliche Indikatoren in einem und kombiniert fortgeschrittene Handelsideen wie die Analyse des Inner Circle Traders und S
DYJ Super Trend Wave ist ein hochpräzises Handelssystem für Spitzen und Wellen. Dieser Indikator sucht nach den höchsten und niedrigsten Punkten der Kerzenlinien, wenn sie in den Markt gehen. Der Eintrittspreis liegt in der Nähe des höchsten oder niedrigsten Punktes. Der Benachrichtigungstyp für das Signal wurde zu dyj supertrend hinzugefügt. Wenn mehrere räumliche Signale erzeugt werden, Die folgenden Typen von Benachrichtigungen können verwendet werden: Alert mailSend, MobilePush.
Dieser Indikator findet AB = CD-Retracement-Muster. Das AB = CD-Retracement-Muster ist eine 4-Punkte-Preisstruktur, bei der das anfängliche Preissegment teilweise zurückverfolgt wird, gefolgt von einer Bewegung mit gleichem Abstand vom Abschluss des Pullbacks, und die Basis für alle harmonischen Muster ist. [ Installationsanleitung | Update-Anleitung | Fehlerbehebung | FAQ | Alle Produkte ] Anpassbare Mustergrößen Anpassbare AC- und BD-Verhältnisse Anpassbare Pausenzeiten Anpassbare Linie
To download MT4 version please click here . - This is the exact conversion from TradingView: " PA-Adaptive Hull Parabolic " By "Loxx". - This is a non-repaint and light processing load indicator - You can message in private chat for further changes you need. - All input options are available. - Buffers are available for processing within EAs. - Highlight option is omitted as does not show good in Metatrader. 
The Gann Box (or Gann Square) is a market analysis method based on the "Mathematical formula for market predictions" article by W.D. Gann. This indicator can plot three models of Squares: 90, 52(104), 144. There are six variants of grids and two variants of arcs. You can plot multiple squares on one chart simultaneously. Parameters Square — selection of a square model: 90 — square of 90 (or square of nine); 52 (104) — square of 52 (or 104); 144 — universal square of 144; 144 (full) — "full"
An indicator of pattern #31 ("Long Island") from Encyclopedia of Chart Patterns by Thomas N. Bulkowski. The second gap is in the opposite direction. Parameters: Alerts - show alert when an arrow appears   Push - send a push notification when an arrow appears (requires configuration in the terminal) GapSize - minimum gap size in points ArrowType - a symbol from 1 to 17 ArrowVShift - vertical shift of arrows in points   ShowLevels - show levels ColUp - color of an upward line ColDn - color of a
Ultimate Divergence Scanner (Multi Pair And Multi Time Frame) :   ---LIMITED TIME OFFER: NEXT 25 CLIENTS ONLY ---46% OFF REGULAR PRICE AND 2 FREE BONUSES ---SEE BELOW FOR FULL DETAILS It is a widely known market principle that momentum generally precedes price.  Making divergence patterns a clear indication that price and momentum are not in agreement.  Divergence patterns are widely used by institutional traders around the world. As they allow you to manage  your trades within strictly de
Follow The Line MT5
Oliver Gideon Amofa Appiah
4.5 (28)
This indicator obeys the popular maxim that: "THE TREND IS YOUR FRIEND" It paints a GREEN line for BUY and also paints a RED line for SELL. (you can change the colors). It gives alarms and alerts of all kinds. IT DOES NOT REPAINT and can be used for all currency pairs and timeframes. Yes, as easy and simple as that. Even a newbie can use it to make great and reliable trades. NB: For best results, get my other premium indicators for more powerful and reliable signals. Get them here: https://www.m
FREE
HMA Trend Professional MT5
Pavel Zamoshnikov
4.25 (4)
Improved version of the free HMA Trend indicator (for MetaTrader 4) with statistical analysis. HMA Trend is a trend indicator based on the Hull Moving Average (HMA) with two periods. HMA with a slow period identifies the trend, while HMA with a fast period determines the short-term movements and signals in the trend direction. The main differences from the free version: Ability to predict the probability of a trend reversal using analysis of history data. Plotting statistical charts for analyz
Heiken Ashi Smoothed Strategy is a very simple but powerful system to get forex market trend direction. This indicator is actually 2 indicators in 1 pack, Heiken Ashi and Heiken Ashi Smoothed Moving Average both included. Because HA (Heiken Ashi) and HAS (Heiken Ashi Smoothed) are calculated in the same one system event with necessary buffers and loop only, so it is the FAST, OPTIMIZED and EFFICIENT HA having the combined indicator of MetaTrader 5. You can choose to display HA and HAS in the sam
Zunächst einmal ist es wichtig zu betonen, dass dieses Handelssystem ein Nicht-Repainting-, Nicht-Redrawing- und Nicht-Verzögerungsindikator ist, was es ideal für den professionellen Handel macht. Online-Kurs, Benutzerhandbuch und Demo. Das "Smart Support and Resistance Trading System" ist ein fortschrittlicher Indikator, der für neue und erfahrene Trader entwickelt wurde. Es ermöglicht Tradern Präzision und Vertrauen auf dem Devisenmarkt. Dieses umfassende System kombiniert mehr als 7 Strategi
Käufer dieses Produkts erwarben auch
TPSpro RFI Levels MT5
Roman Podpora
4.73 (11)
ANWEISUNGEN       Russland       -        ENG    Die Empfehlung basiert auf dem Indikator -   TPSpro   TREND PRO -   Version MT5 Die wichtigsten Elemente in der Branche sind entweder in Zonen oder in der Fabrik enthalten, oder sie führen zu einer Lösung bei einem Kauf oder dem Verkauf eines anderen Instruments. Wenn viele Menschen ihre Rechte nicht auf dem Händlerkonto verschlüsseln, werden die Folgen nicht schnell genug sein. Ich habe es damit abgeschlossen, dass ich diese Folgen nun noch inter
TPSproTREND PrO MT5
Roman Podpora
4.89 (9)
TPSpro TREND PRO   ist ein Trendindikator, der den Markt automatisch analysiert und Informationen über den Trend und jede seiner Änderungen liefert sowie Signale für den Einstieg in Geschäfte ohne Neuzeichnung gibt! Der Indikator verwendet jede Kerze und analysiert sie separat. bezieht sich auf verschiedene Impulse – Aufwärts- oder Abwärtsimpuls. Exakte Einstiegspunkte in Transaktionen für Währungen, Krypto, Metalle, Aktien, Indizes! Version MT5                   VOLLSTÄNDIGE BESCHREIBUNG DES I
Zunächst einmal ist es wichtig zu betonen, dass dieses Handelssystem ein Nicht-Repainting-, Nicht-Redrawing- und Nicht-Verzögerungsindikator ist, was es sowohl für manuelles als auch für automatisches Trading ideal macht. Online-Kurs, Handbuch und Vorlagen herunterladen. Das "Smart Trend Trading System MT5" ist eine umfassende Handelslösung, die für neue und erfahrene Trader maßgeschneidert ist. Es kombiniert über 10 Premium-Indikatoren und bietet mehr als 7 robuste Handelsstrategien, was es zu
Gold Stuff mt5
Vasiliy Strukov
4.92 (166)
Gold Stuff mt5-Ein Trendindikator, der speziell für Gold entwickelt wurde, kann auch auf allen Finanzinstrumenten verwendet werden. Der Indikator wird nicht neu gezeichnet und verzögert sich nicht. Empfohlener Zeitrahmen H1. WICHTIG! Kontaktieren Sie mich sofort nach dem Kauf, um Anweisungen und Bonus zu erhalten!     Sie können eine kostenlose Kopie unseres Strong Support- und Trendscanner-Indikators erhalten, bitte senden Sie uns eine persönliche Nachricht. Mich! DATEN Draw Arrow - in
FX Power MT5 NG
Daniel Stein
5 (5)
Erhalten Sie Ihr tägliches Marktupdate mit Details und Screenshots über unser Morning Briefing hier auf mql5 und auf Telegram ! FX Power MT5 NG ist die nächste Generation unseres langjährig sehr beliebten Währungsstärkemessers FX Power. Und was bietet dieser Stärkezähler der nächsten Generation? Alles, was Sie am ursprünglichen FX Power geliebt haben PLUS GOLD/XAU-Stärkeanalyse Noch präzisere Berechnungsergebnisse Individuell konfigurierbare Analysezeiträume Anpassbares Berechnungslimit für noc
Quantum Trend Sniper
Bogdan Ion Puscasu
4.8 (49)
Wir stellen vor       Quantum Trend Sniper Indicator   , der bahnbrechende MQL5-Indikator, der die Art und Weise, wie Sie Trendumkehrungen erkennen und handeln, verändert! Entwickelt von einem Team erfahrener Händler mit über 13 Jahren Handelserfahrung,       Quantum Trend Sniper-Indikator       wurde entwickelt, um Ihre Trading-Reise mit seiner innovativen Methode zur Identifizierung von Trendumkehrungen mit extrem hoher Genauigkeit auf ein neues Niveau zu heben. ***Kaufe Quantum Trend Snipe
FxaccurateLS
Shiv Raj Kumawat
WHY IS OUR FXACCCURATE LS MT5 THE PROFITABLE ? PROTECT YOUR CAPITAL WITH RISK MANAGEMENT Gives entry, stop and target levels from time to time. It finds Trading opportunities by analyzing what the price is doing during established trends. POWERFUL INDICATOR FOR A RELIABLE STRATEGIES We have made these indicators with a lot of years of hard work. It is made at a very advanced level. Established trends provide dozens of trading opportunities, but most trend indicators completely ignore them!
Trend Screener Pro MT5
STE S.S.COMPANY
4.87 (63)
Nutzen Sie die Macht des Trendhandels mit Trend Screener Indicator: Ihrer ultimativen Trendhandelslösung, die auf Fuzzy-Logik und einem System mit mehreren Währungen basiert! Steigern Sie Ihren Trendhandel mit Trend Screener, dem revolutionären Trendindikator mit Fuzzy-Logik. Es handelt sich um einen leistungsstarken Trendfolgeindikator, der über 13 Premium-Tools und -Funktionen sowie 3 Handelsstrategien kombiniert und ihn zu einer vielseitigen Wahl macht, um Ihren Metatrader in einen Trendanaly
Dieses Dashboard zeigt die   neuesten verfügbaren harmonischen   Muster für die ausgewählten Symbole, so dass Sie Zeit sparen und effizienter sein werden /   MT4-Version . Kostenloser Indikator:   Basic Harmonic Pattern Spalten des Indikators Symbol:   die ausgewählten Symbole werden angezeigt Trend:   bullish oder bearish Pattern :   Art des Musters (Gartley, Schmetterling, Fledermaus, Krabbe, Hai, Cypher oder ABCD) Entry :   Einstiegskurs SL:   Stop-Loss-Kurs TP1:   1. Take-Profit-Kurs
Dies ist ein Indikator für MT5, der genaue Signale für den Einstieg in einen Handel ohne Repainting (Neuzeichnen) liefert. Er kann auf alle Finanzwerte angewendet werden: Forex, Kryptowährungen, Metalle, Aktien, Indizes. Er liefert ziemlich genaue Schätzungen und sagt Ihnen, wann es am besten ist, eine Position zu eröffnen und zu schließen. Sehen Sie sich das Video (6:22) mit einem Beispiel für die Verarbeitung nur eines Signals an, das sich für den Indikator gelohnt hat! Die meisten Händler ver
Advanced Supply Demand MT5
Bernhard Schweigert
4.5 (14)
Derzeit 33% Rabatt! Die beste Lösung für jeden Anfänger oder erfahrenen Händler! Dieser Indikator ist ein einzigartiges, qualitativ hochwertiges und erschwingliches Trading-Tool, da wir eine Reihe von proprietären Funktionen und eine neue Formel integriert haben. Mit diesem Update werden Sie in der Lage sein, doppelte Zeitrahmenzonen anzuzeigen. Sie können nicht nur einen höheren TF (Zeitrahmen) anzeigen, sondern sowohl den Chart-TF als auch den höheren TF: SHOWING NESTED ZONES. Alle Supply Dema
Auto Order Block with break of structure based on ICT and Smart Money Concepts (SMC) Futures Break of Structure ( BoS )             Order block ( OB )            Higher time frame Order block / Point of Interest ( POI )    shown on current chart           Fair value Gap ( FVG ) / Imbalance   -  MTF      ( Multi Time Frame )    HH/LL/HL/LH  -  MTF      ( Multi Time Frame )  Choch  MTF      ( Multi Time Frame )  Volume Imbalance     ,  MTF          vIMB Gap’s Power of 3 Equal High
Der Forex TPA Indikator deckt die wahren Aktionen der Marktmacher auf, immer dann wenn sie passieren. "Kämpfe nicht gegen die Marktmacher an, sondern folge ihnen", ist wohl der beste Rat, den ein Trader bekommen kann. Der TPA Indikator zeigt jedesmal seine Signale an wenn die Bullen definitiv stärker sind als die Bären und umgekehrt. Dieser Indikator wurde VON Tradern FÜR Trader gemacht und ist 100% NICHT NACHZEICHNEND! Signale werden STRENG am Schluss einer Kerze  generiert. Das sagen unsere Ku
AT Forex Indicator MT5
Marzena Maria Szmit
5 (4)
The AT Forex Indicator MT5 is a sophisticated trading tool designed to provide traders with a comprehensive analysis of multiple currency pairs. This powerful indicator simplifies the complex nature of the forex market, making it accessible for both novice and experienced traders. AT Forex Indicator uses advanced algorithms to detect trends, patterns and is an essential tool for traders aiming to enhance their forex trading performance. With its robust features, ease of use, and reliable signal
ICT, SMC, SMART MONEY CONCEPTS, SMART MONEY, Smart Money Concept, Support and Resistance, Trend Analysis, Price Action, Market Structure, Order Blocks, BOS/CHoCH,   Breaker Blocks ,  Momentum Shift,   Supply&Demand Zone/Order Blocks , Strong Imbalance,   HH/LL/HL/LH,    Fair Value Gap, FVG,  Premium  &   Discount   Zones, Fibonacci Retracement, OTE, Buy Side Liquidity, Sell Side Liquidity, BSL/SSL Taken, Equal Highs & Lows, MTF Dashboard, Multiple Time Frame, BigBar, HTF OB, HTF Market Structure
Fxaccurate TCT
Shiv Raj Kumawat
WHY IS OUR FXACCCURATE TCT MT5 THE PROFITABLE ? Gives entry, stop and target levels from time to time. It finds Trading opportunities by analyzing what the price is doing during established trends. We have made these indicators with a lot of years of hard work. It is made at a very advanced level. Established trends provide dozens of trading opportunities, but most trend indicators completely ignore them! The trend reveals trading indicator represents an average of 10 different trades per trend
PZ Swing Trading MT5
PZ TRADING SLU
5 (4)
Swing Trading ist der erste Indikator, der Schwankungen in Trendrichtung und mögliche Umkehrschwankungen erkennt. Es wird der in der Handelsliteratur weit verbreitete Baseline-Swing-Trading-Ansatz verwendet. Der Indikator untersucht mehrere Preis- und Zeitvektoren, um die aggregierte Trendrichtung zu verfolgen und erkennt Situationen, in denen der Markt überverkauft oder überkauft ist und zur Korrektur bereit ist. [ Installationsanleitung | Update-Anleitung | Fehlerbehebung | FAQ | Alle Produkte
Was: $249  Now: $99   Market Profile defines a number of day types that can help the trader to determine market behaviour. A key feature is the Value Area, representing the range of price action where 70% of trading took place. Understanding the Value Area can give traders valuable insight into market direction and establish the higher odds trade. It is an excellent addition to any system you may be using. Inspired by Jim Dalton’s book “Mind Over Markets”, this indicator is designed to suit the
MetaForecast M5
Vahidreza Heidar Gholami
5 (2)
MetaForecast prognostiziert und visualisiert die Zukunft eines beliebigen Marktes basierend auf den Harmonien in den Preisdaten. Obwohl der Markt nicht immer vorhersehbar ist, kann MetaForecast, wenn es ein Muster im Preis gibt, die Zukunft so genau wie möglich voraussagen. Im Vergleich zu ähnlichen Produkten kann MetaForecast durch die Analyse von Markttrends genauere Ergebnisse erzeugen. Eingabeparameter Past size (Vergangene Größe) Gibt an, wie viele Balken MetaForecast verwendet, um ein Mo
Blahtech Supply Demand MT5
Blahtech Limited
4.54 (13)
Was: $299  Now: $99   Supply Demand uses previous price action to identify potential imbalances between buyers and sellers. The key is to identify the better odds zones, not just the untouched ones. Blahtech Supply Demand indicator delivers functionality previously unavailable on any trading platform. This 4-in-1 indicator not only highlights the higher probability zones using a multi-criteria strength engine, but also combines it with multi-timeframe trend analysis, previously confirmed swings
FX Volume MT5
Daniel Stein
4.93 (14)
Erhalten Sie Ihr tägliches Marktupdate mit Details und Screenshots über unser Morning Briefing hier auf mql5 und auf Telegram ! FX Volume ist der ERSTE und EINZIGE Volumenindikator, der einen ECHTEN Einblick in die Marktstimmung aus Sicht eines Brokers bietet. Es bietet fantastische Einblicke in die Positionierung von institutionellen Marktteilnehmern, wie z.B. Brokern, auf dem Forex-Markt, viel schneller als COT-Berichte. Diese Informationen direkt auf Ihrem Chart zu sehen, ist der wahre Game
Stratos Pali mt5
Michela Russo
5 (1)
Stratos Pali Indicator is a revolutionary tool designed to enhance your trading strategy by accurately identifying market trends. This sophisticated indicator uses a unique algorithm to generate a complete histogram, which records when the trend is Long or Short. When a trend reversal occurs, an arrow appears, indicating the new direction of the trend. Important Information Revealed Leave a review and contact me via mql5 message to receive My Top 5 set files for Stratos Pali at no cost ! Do
Gartley Hunter Multi
Siarhei Vashchylka
5 (8)
Gartley Hunter Multi - An indicator for searching for harmonic patterns simultaneously on dozens of trading instruments and on all possible timeframes. Manual (Be sure to read before purchasing) | Version for MT4 Advantages 1. Patterns: Gartley, Butterfly, Shark, Crab. Bat, Alternate Bat, Deep Crab, Cypher 2. Simultaneous search for patterns on dozens of trading instruments and on all possible timeframes 3. Search for patterns of all possible sizes. From the smallest to the largest 4. A
IX Power MT5
Daniel Stein
4.17 (6)
IX Power   bringt die unschlagbare Präzision von FX Power endlich auch zu Nicht-Forex-Symbolen. Es bestimmt präzise die Intensität von kurz-, mittel- und langfristigen Trends in Ihren Lieblingsindizes, Aktien, Rohstoffen, ETFs und sogar Kryptowährungen. Sie können   alles analysieren, was   Ihr Terminal zu bieten hat. Probieren Sie es aus und erleben Sie, wie   sich Ihr Timing   beim Handel   deutlich verbessert . IX Power Hauptmerkmale 100% präzise, nicht nachpinselnde Berechnungsergebni
Matrix Arrow Indicator MT5
Juvenille Emperor Limited
5 (12)
Matrix Arrow Indicator MT5   ist ein einzigartiger 10-in-1-Trend, der zu   100 % nicht neu gezeichnet   werden kann. Multi-Timeframe-Indikator, der für alle Symbole/Instrumente verwendet werden kann:   Forex ,   Rohstoffe ,   Kryptowährungen ,   Indizes ,   Aktien .  Der  Matrix Arrow Indicator MT5  wird den aktuellen Trend in seinen frühen Stadien bestimmen und Informationen und Daten von bis zu 10 Standardindikatoren sammeln, die sind: Durchschnittlicher Richtungsbewegungsindex (ADX) Rohstoff
Market Structure MT5
Reza Aghajanpour
5 (3)
**   All Symbols   x   All Timeframes   scan just by pressing scanner button ** *** Contact me  to send you instruction and add you in "Market Structure group" for sharing or seeing experiences with other users. Introduction: Market structure is important for both new and professional traders since it can influence the liquidity and price action of a market. It’s also one of the most commonly used techniques to understand trends, identify potential reversal points, and get a feel for current mar
Golden Spikes Premium
Kwaku Bondzie Ghartey
5 (1)
Golden Spikes Detector Acknowledgement and Dedications:  The name of this indicator was Inspired by an Original; Mr Grant Koopman; a Knowledgeable and experienced Synthetics trader. I dedicate this indicator to Mr Grant.  Overview: The Golden Spikes Premium is a groundbreaking trading indicator meticulously crafted for the Boom and Crash indices on the Deriv market. Tailored to meet the needs of discerning traders, this powerful tool operates exclusively on the one-minute timeframe, providin
TrendMaestro5
Stefano Frisetti
note: this indicator is for METATRADER4, if you want the version for METATRADER5 this is the link:  https://www.mql5.com/it/market/product/108106 TRENDMAESTRO ver 2.4 TRENDMAESTRO recognizes a new TREND in the bud, he never makes mistakes. The certainty of identifying a new TREND is priceless. DESCRIPTION TRENDMAESTRO identifies a new TREND in the bud, this indicator examines the volatility, volumes and momentum to identify the moment in which there is an explosion of one or more of these data a
FX Trend MT5
Daniel Stein
4.63 (32)
Sie wollen ein konstant profitabler 5-Sterne-Forex-Händler werden? 1. Lesen Sie die grundlegende Beschreibung unseres einfachen Trading Systems und sowie das große Strategie-Update im Jahr 2020 2. Senden Sie einen Screenshot Ihres Kaufs, um Ihre persönliche Einladung zu unserem exklusiven Trading-Chat zu erhalten FX Trend zeigt Ihnen die Trendrichtung, Dauer, Intensität und die daraus resultierende Trendbewertung für alle Zeitrahmen in Echtzeit an. Sie sehen auf einen Blick, in welche Richtu
Trend Forecaster
Alexey Minkov
5 (6)
The Trend Forecaster indicator utilizes a unique proprietary algorithm to determine entry points for a breakout trading strategy. The indicator identifies price clusters, analyzes price movement near levels, and provides a signal when the price breaks through a level. The Trend Forecaster indicator is suitable for all financial assets, including currencies (Forex), metals, stocks, indices, and cryptocurrencies. You can also adjust the indicator to work on any time frames, although it is recommen
Weitere Produkte dieses Autors
Heiken Ashi DA
Vitaly Dodonov
4 (1)
Что такое Heiken Ashi?    Heiken Ashi — это метод построения графиков, который можно использовать для прогнозирования будущего движения цены. Он похож на традиционные свечные графики. Однако в отличие от обычного свечного графика, график Heiken Ashi пытается отфильтровать часть рыночного шума для лучшего определения трендовых движений на рынке. Как рассчитать Heiken Ashi? Heiken Ashi использует формулу COHL, которая означает «Закрытие, Открытие, Максимум, Минимум». Это четыре компонента, кото
FREE
Что такое Awesome Oscillator?   Создателем данного индикатора является Билл Вильямс. Этот трейдер разработал собственную торговую систему. Её основой служит постулат: «Рынок движется хаотично. Какие-либо закономерности этого движения вывести довольно сложно, так как многое зависит от психологических факторов.» Поэтому Вильямс разработал собственные инструменты для анализа рынка. Одним из таких инструментов и является индикатор АО. Это осциллятор, который дает возможность выявить силу текущего
FREE
Что такое Stochastic?  Осциллятор стохастик (Stochastic) – это индикатор импульса, который сравнивает конкретную цену закрытия инструмента с его диапазоном максимумов и минимумов за определенное количество периодов.    Основная идея индикатора заключается в том, что импульс предшествует цене, поэтому стохастический осциллятор может давать сигналы о фактическом движении цены непосредственно перед тем, как оно произойдет.   Stochastic является осциллятором с привязкой к диапазону от 0 до 100 (по
FREE
Что такое CCI индикатор?    Стандартный Индикатор CCI (Commodity Channel Index) – это осциллятор, который измеряет силу, стоящую за тем или иным движением цены. Он помогает определить, кто находятся у руля: быки или медведи.  Как и многие осцилляторы импульса, CCI работает, сравнивая текущую цену с предыдущими показателями, и на основе этого сравнения он решает, насколько сильное движение цены вверх/вниз.  Как рассчитать CCI? Метод расчета стандартного индикатора представляет собой оригинальн
FREE
OsMA DA
Vitaly Dodonov
5 (1)
Что такое OsMA DA?   Индикатор OsMA DA – это осциллятор, который построен на показаниях другого осциллятора – MACD. OsMA DA показывает расхождение между сигнальной линией MACD и его гистограммой. Момент пересечения гистограммы и линии – это нулевая отметка OsMA.   Если гистограмма MACD поднимается выше линии, то гистограмма самого OsMA DA поднимается выше нулевой отметки. В обратной ситуации OsMA DA демонстрирует отрицательные значения.   OsMA DA более узконаправленный индикатор, чем MACD. OsMA
FREE
Rsi DA
Vitaly Dodonov
5 (2)
Что такое RSI?  Индикатор RSI (Relative Strength Index, индекс относительной силы) — это индикатор, который измеряет соотношение восходящих и нисходящих движений. Расчет ведётся таким образом, что индекс выражается в диапазоне от 0 до 100. Как понять RSI? Если значение RSI находится равно 70 и больше, считается, что инструмент находится в состоянии перекупленности (ситуация, когда цены выросли выше, нежели того ожидал рынок). Значение RSI на уровне 30 и ниже считается сигналом о том, что инст
FREE
MaCD DA
Vitaly Dodonov
Что такое MACD?  Обычный MACD – это осциллятор хотя его часто называют трендовым индикатором, или даже «трендовым осциллятором». Происходит это потому, что MACD строится на основе показаний двух скользящих средних. Чем отличается MACD DA?   В MACD DA используется специальный ценовой фильтр. Только после фильтрации строится индикатор. Гистограмма отображает степень расхождения двух скользящих средних: если одна удаляется от другой, то растут и столбики гистограммы, если сближаются, тогда столбц
FREE
Momentum DA
Vitaly Dodonov
Что такое Momentum DA?  Индикатор Momentum DA- это инструмент техническго анализа, который измеряет скорость, с которой меняются цены активов за определенный период времени.  Является модификацией обчного Momentum.   Основная идея этого индикатора заключается в том, чтобы помочь трейдерам определить возможные точки разворота ценового тренда, определяя моменты ускорения или замедления роста или падения цен.    Он основан на предположении, что быстрое увеличение цены будет вероятно сопровождаться
FREE
Зачем нужен этот индикатор? Думаю вы замечали каким «хаотичным» может быть дви- жение цены. Бывают периоды, когда цена движется направле- но, почти без коррекций. В такие периоды трендовые страте- гии работают очень хорошо.  Но  как только направленное движение заканчивается, торговая стратегия перестаёт работать. Появляется очень  много ложных сигналов, что приводит к большому количеству отрицательных сделок.  Тогда возникла мысль: «А что если создать индикатор,  который смог бы заменить ценов
FREE
How often have you had to open deals or place pending orders, and then sit at the monitor and wait for the price to behave further? After all, you can miss the right moment and a profitable deal could easily become unprofitable. And all this is due to the fact that they did not tighten the stop loss, did not set a take profit. Or the price movement was so strong and fast that you missed the moment when the pending order was triggered. And then your entire trading plan was disrupted. Orders Inter
You've probably noticed how unpredictable price movements can be. Sometimes the price moves in a certain direction with almost no corrections. Trend strategies work well during such periods. However, as soon as the directional movement is completed, the trading strategy ceases to be effective. Price movements become abrupt and "chaotic". The price abruptly changes its direction. Trend strategies start to give out a lot of false signals, and this leads to a large number of unprofitable trades.
Auswahl:
Keine Bewertungen
Antwort auf eine Rezension