Heiken Ashi Ext
- Indicatori
- Vitaly Dodonov
- Versione: 1.0
- Attivazioni: 10
What is Heiken Ashi?
Heiken Ashi is a charting method that can be used to predict future price movements. The indicator builds candlesticks similar to traditional ones. However, unlike a regular candlestick chart, the Heiken Ashi chart tries to filter out some of the market noise to better identify trend movements in the market.
How is Heiken Ashi calculated?
Heiken Ashi uses the COHL formula, which means "Close, Open, Maximum, Minimum". These are the four components that affect the shape, size and direction of candlesticks. The formula for their calculation is given below:
Y1. C = (C + O + H + L ) / 4.
2. O = (O_pred + C_pred) / 2.
3. H = The highest value of H , opening and closing.
4. L = The lowest value of L , opening or closing.
C , O , H , L - closing prices, opening price, highest price, lowest price. All these prices are taken from the current settlement bar.
O pre , Spread - previous values of O and C.
What is the difference between the Heiken Ashi Ext indicator and the regular Heiken Ashi?
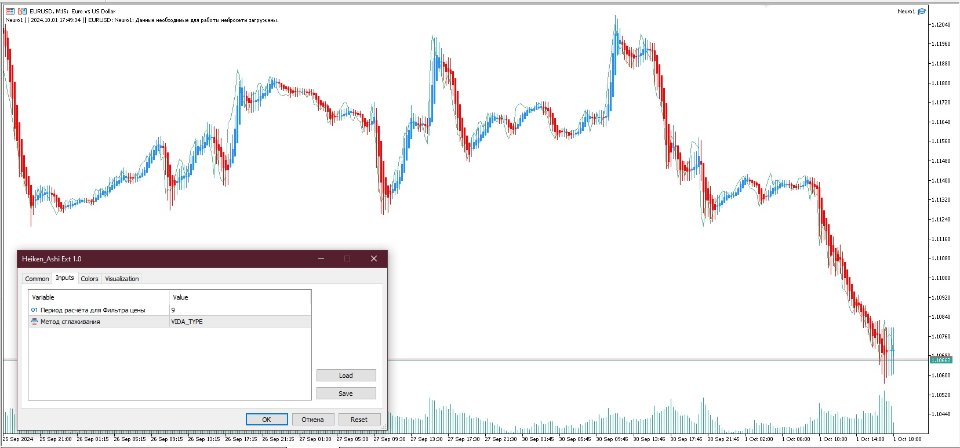
In general, the calculation method of Heiken Ashi Ext is the same as that of a regular Heiken Ashi. But when calculating Heiken Ashi Ext, the price is subjected to additional filtering and smoothing.
How to use Heiken Ashi Ext?
Although Heiken Ashi Ext is recommended to be considered as a trend indicator.
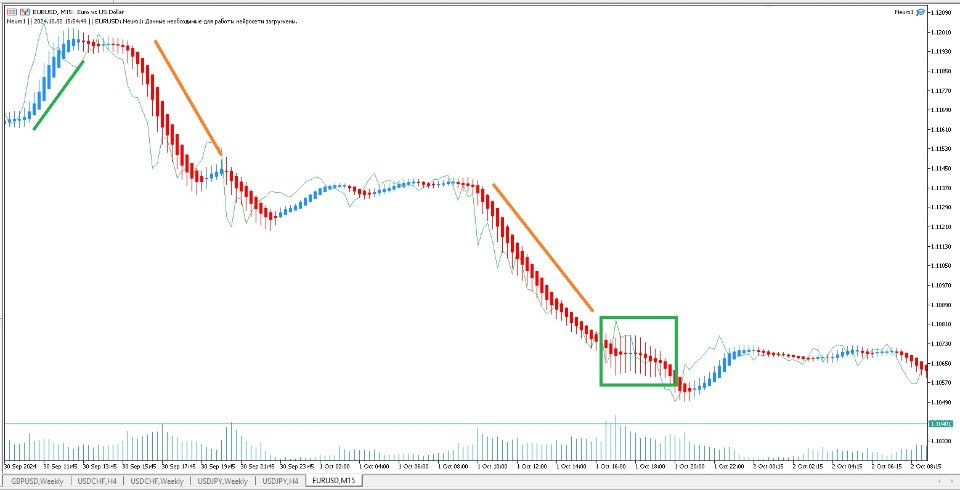
A distinctive feature of Heiken Ashi Ext is a small or absent shadow in the presence of pronounced movement. For bullish candles, we are talking about the lower shadows. For "bearish" candles, we are talking about upper shadows.
1. The formation of the first full-bodied candle (rising or falling) with a single shadow coinciding in the direction. This moment is considered as a possible beginning of a trend movement, ascending or descending. After such a candle, it is recommended to start searching for an entry point into the market in the direction of the trend indicated by the Heiken Ashi Ext candle.
2. Forming a candle with a long body and both shadows. It is perceived as a sign of slowing down or a possible start of correction. In this case, traders are advised to close some of the positions open in the direction of the trend or to shift the Stop Loss order.
3. Formation of a doji candle with a short body and both long shadows. It is believed that this is a signal of the end of a trend (transition to a flat) or a reversal. It is recommended to close open positions and start searching for entry points in the opposite direction.
You should not build your trading system only on the Heiken Ashi Ext indicator. The signals of this indicator require confirmation from other sources.
The simplest strategy involves recognizing a signal as formed if it has received confirmation on at least two bars. For example, a position using this method is opened on the third full-bodied candle of the same color as the signal one.
Together with Heiken Ashi Ext, various indicators are used, most often Stochastic or MACD oscillators. In this case, oscillators are the source of the signal, and Heiken Ashi Ext candlesticks are used for confirmation.
The Input Parameters
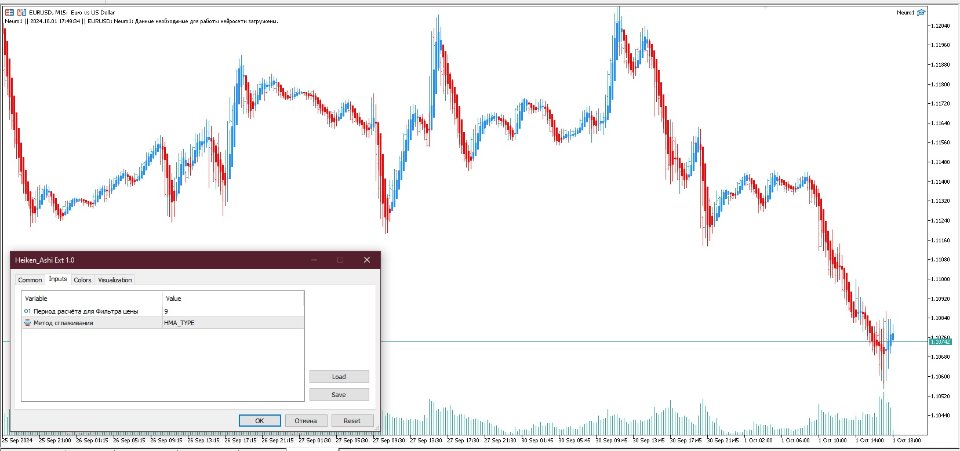
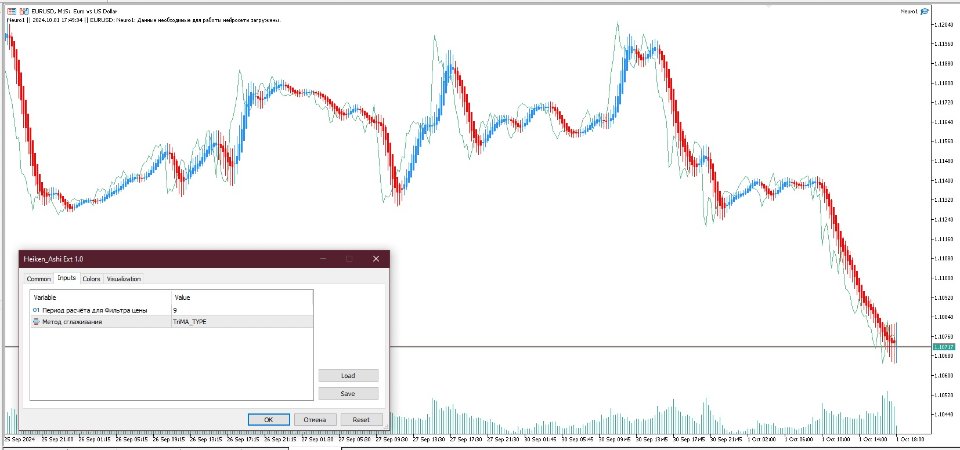
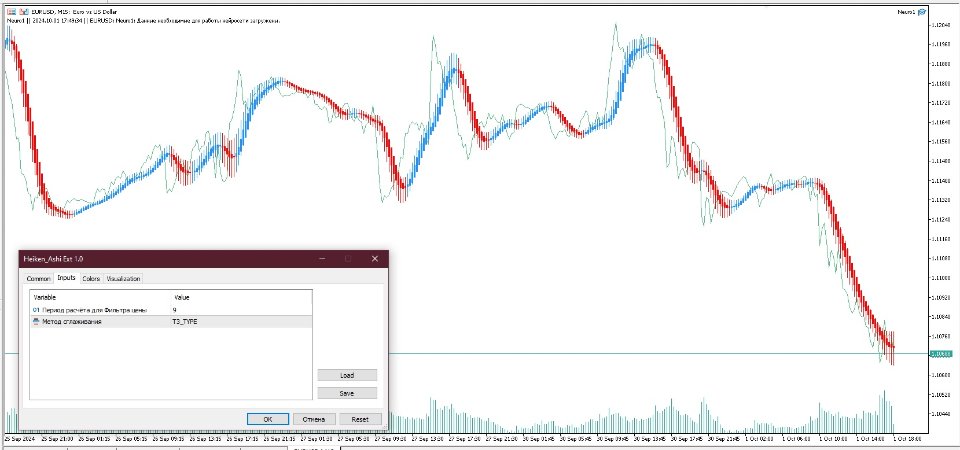
- Calculation period for the Price Filter is the number of bars involved in filtering the current indicator value
- Smoothing method is a method of smoothing the price values of a chart
