• Übersicht
  • Bewertungen
  • Diskussion

CVD SmoothFlow

CVD SmoothFlow - Vereinfachen Sie die Volumenanalyse mit Präzision für BTCUSD!

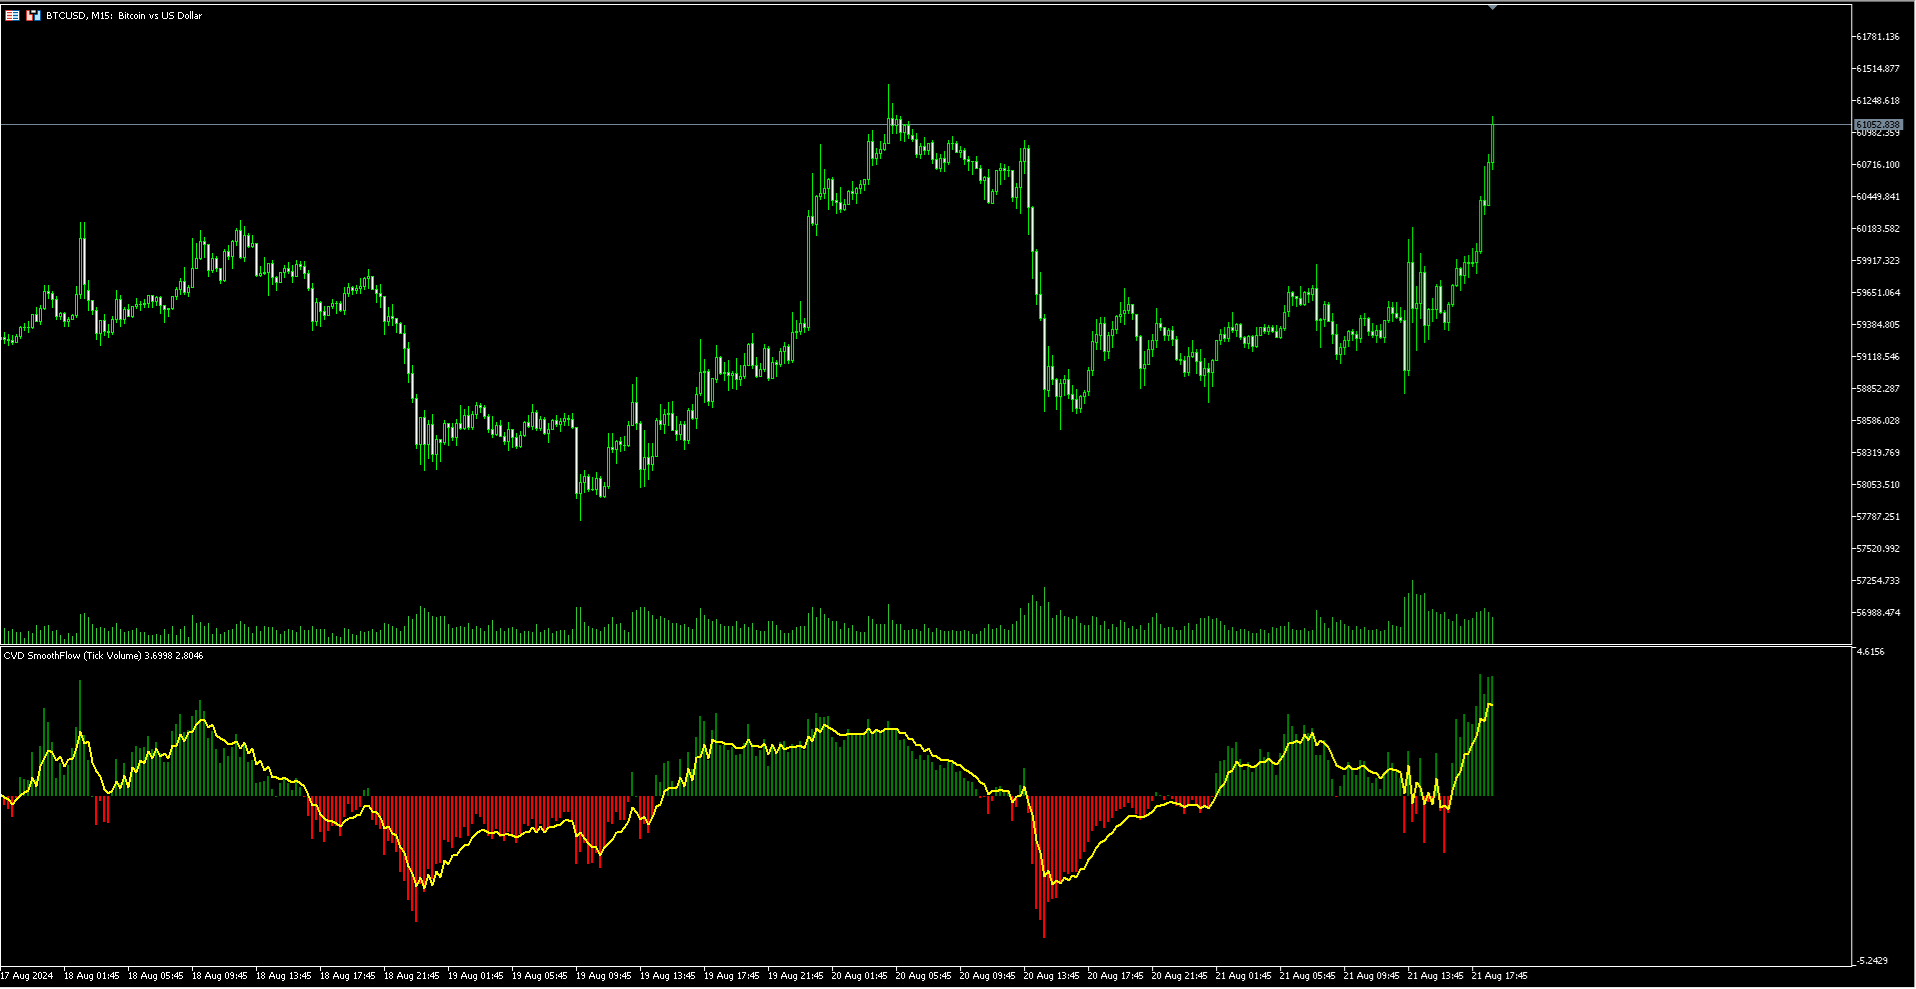
CVD SmoothFlow ist ein technischer Indikator, der speziell für Trader entwickelt wurde, die das Paar BTCUSD handeln. Durch die Nutzung der Berechnung von Cumulative Volume Delta (CVD) wird eine fortschrittliche Rauschfilterung angewendet, um eine klare und präzise Marktanalyse zu bieten.

🔍 Was bietet CVD SmoothFlow?

  • 📊 Klare Analyse: Filtert Marktrauschen heraus, damit Sie sich auf die relevantesten und bedeutendsten Volumenbewegungen konzentrieren können.
  • ⚙️ Präzise Berechnung: Überwacht die Unterschiede zwischen Käufen und Verkäufen und bietet eine detaillierte Ansicht des Volumenverhaltens bei BTCUSD.
  • 💡 Intuitive Benutzeroberfläche: Erleichtert das Verständnis der Daten und macht die Volumenanalyse zugänglich und effizient.
  • 📈 Trendidentifikation: Identifizieren Sie Marktentwicklungen mit mehr Vertrauen und treffen Sie fundierte Entscheidungen.

💼 Praktische Anwendungen:

  • Überwachen Sie das Gleichgewicht zwischen Käufern und Verkäufern in Echtzeit.
  • Erkennen Sie Trendwenden basierend auf Volumen.
  • Nutzen Sie die Filterung, um sich auf relevante Bewegungen bei BTCUSD zu konzentrieren.

⚠️ Hinweis: CVD SmoothFlow ist ausschließlich für das Paar BTCUSD verfügbar.

🔓 Pro-Version verfügbar!

Für diejenigen, die CVD SmoothFlow auf anderen Paaren und Vermögenswerten nutzen möchten, bietet die Pro-Version alle Funktionen ohne Einschränkungen! Nutzen Sie diese Gelegenheit, um Ihre Marktanalyse zu erweitern.

🔗 Holen Sie sich die Pro-Version hier: CVD SmoothFlow Pro


Empfohlene Produkte
VWAP Simple
Deibson Carvalho
4.06 (34)
The Volume Weighted Average Price is similar to a moving average, except volume is included to weight the average price over a period.    Volume-Weighted Average Price [VWAP] is a dynamic, weighted average designed to more accurately reflect  a security’s true average price over a given period . Mathematically, VWAP is the summation of money (i.e., Volume x Price) transacted divided by the total volume over any time horizon, typically from market open to market close. VWAP reflects the capital
FREE
Market Momentum
Flavio Javier Jarabeck
3.86 (7)
The Market Momentum indicator is based on the Volume Zone Oscillator (VZO), presented by Waleed Aly Khalil in the 2009 edition of the International Federation of Technical Analysts journal, and presents a fresh view of this market valuable data that is oftenly misunderstood and neglected: VOLUME. With this new approach of "seeing" Volume data, traders can infer more properly market behavior and increase their odds in a winning trade. "The VZO is a leading volume oscillator; its basic usefulnes
FREE
Weis Waves
Flavio Javier Jarabeck
3.15 (26)
The original author is David Weis, an expert in the Wyckoff Method. The Weis Wave is a modern adaptation of the 1930's Wyckoff Method, another expert in Tape Reading techniques and Chart Analysis. Weis Waves takes market volume and stacks it into waves according to price conditions giving the trader valuable insights about the market conditions. If you want to learn more about this subject you can find tons of videos in YouTube. Just look for "The Wickoff Method", "Weis Wave" and "Volume Spread
FREE
ADX consolidado
OTAVIO AGUIAR CAMPOS Aguiar
4.8 (5)
Mostra a média móvel quando ADX > 20 e pinta de verde ou vermelho quando os valores de ADX estão subindo indicando tendência. Quando o ADX é menor que 20 indica movimento lateral consolidado. O indicador não define pontos de entrada, somente mostra a média colorida quando a tendência está se fortalecendo. Faz parte do grupo de indicadores do Indicador Tavim.
FREE
Supports And Resistances Lines
Francisco Gomes Da Silva
4.76 (41)
Indikator für Unterstützungs- und Widerstandszonen MT5 Dieser Indikator kann Hochs und Tiefs automatisch erkennen. Dieser Unterstützungs- und Widerstandsindikator erstellt Unterstützungslinien und Widerstandslinien basierend auf Hochs und Tiefs. wie man Unterstützungs- und Widerstandslinien erstellt. Dies ist ein Indikator, um automatische Unterstützungs- und Widerstandslinien zu erstellen. wie man das Unterstützungsniveau mit dem Indikator findet. Dieser Indikator findet automatisch Hochs und T
FREE
MIDAS Super VWAP
Flavio Javier Jarabeck
4.29 (14)
Imagine VWAP, MVWAP and MIDAS in one place... Well, you found it! Now you can track the movement of Big Players in various ways, as they in general pursue the benchmarks related to this measuring, gauging if they had good execution or poor execution on their orders. Traders and analysts use the VWAP to eliminate the noise that occurs throughout the day, so they can measure what prices buyers and sellers are really trading. VWAP gives traders insight into how a stock trades for that day and deter
FREE
Stackable VWAP
Flavio Javier Jarabeck
3.33 (6)
Volume Weighted Average Price (VWAP) is a trading benchmark commonly used by Big Players that gives the average price a Symbol has traded throughout the day. It is based on both Volume and price. Additionally we put in this indicator the MVWAP (Moving Volume Weighted Average Price). For those who do not know the usage and the importance od this indicator I recommend a great article about this subject at Investopedia ( https://www.investopedia.com/articles/trading/11/trading-with-vwap-mvwap.asp
FREE
Aggression Volume
Flavio Javier Jarabeck
3.91 (22)
Aggression Volume Indicator is the kind of indicator that is rarely found in the MQL5 community because it is not based on the standard Volume data provided by the Metatrader 5 platform. It requires the scrutiny of all traffic Ticks requested on the platform... That said, Aggression Volume indicator requests all Tick Data from your Broker and processes it to build a very special version of a Volume Indicator, where Buyers and Sellers aggressions are plotted in a form of Histogram. Additionally,
FREE
VWAP and MVWAP
Flavio Javier Jarabeck
4.17 (6)
Volume Weighted Average Price (VWAP) is a trading benchmark commonly used by Big Players that gives the average price a Symbol has traded throughout the day. It is based on both Volume and price. Additionally we put in this indicator the MVWAP (Moving Volume Weighted Average Price). For those who do not know the usage and the importance od this indicator I recommend a great article about this subject at Investopedia ( https://www.investopedia.com/articles/trading/11/trading-with-vwap-mvwap.asp )
FREE
Wave Box Market Frenquency
Jean Jacques Huve Ribeiro
4.83 (6)
Totally linked to the result of a movement and the duration he had. Its height records how many ticks the asset walked during a given movement, its width shows us the duration that movement had. Its configuration must be in line with the Weis Wave Indicator configuration to observe the movement force and can indicate a possible accumulation or distribution of the movement;
FREE
FT ADX Color Candles
FELIPE MISAEL MORAES KRUGER
4.86 (7)
Trades zu machen kann ziemlich anstrengend sein, wenn Sie mehrere Dinge gleichzeitig betrachten müssen. Format von Kerzen, Unterstützungen, Widerständen, Zeitplänen, Nachrichten und Indikatoren. Dieses Tool soll die Analyse des ADX-Indikators erleichtern. Es färbt die Kerzen basierend auf den Pegeln des Indikators und den DI-Linien. Der Zeitraum, die Grenze des Indikators und die Farben der Kerzen sind anpassbar. Sie können auch eine visuelle Hilfe unten rechts im Diagramm platzieren, um
FREE
Value Chart Candlesticks
Flavio Javier Jarabeck
4.7 (10)
The idea of a Value Chart indicator was presented in the very good book I read back in 2020 , " Dynamic Trading Indicators: Winning with Value Charts and Price Action Profile ", from the authors Mark Helweg and David Stendahl. The idea is simple and the result is pure genius: Present candlestick Price analysis in a detrended way! HOW TO READ THIS INDICATOR Look for Overbought and Oversold levels. Of course, you will need to test the settings a lot to find the "correct" one for your approach.
FREE
The Volume Plus indicator for MT5 can be effectively used for detecting imbalances in supply and demand. The indicator improves on the typical volume histogram by coloring the bars. Bar colors (colors are customizable): Neutral - DimGray Wide Spread (Range) Bar on High Volume - MediumBlue Narrow Spread, High Volume - MidnightBlue Wide Spread, Low Volume - ForestGreen Narrow Spread, Low Volume - DarkGreen Very/Ultra Wide Spread, Low Volume - Aqua Narrow Spread, Ultra High Volume - Purple V
FREE
Weis Waves RSJ
JETINVEST
4.67 (9)
The Weis Waves RSJ Indicator sums up volumes in each wave. This is how we receive a bar chart of cumulative volumes of alternating waves. Namely the cumulative volume makes the Weis wave charts unique. It allows comparing the relation of the wave sequence characteristics, such as correspondence of the applied force (expressed in the volume) and received result (the price progress). If you still have questions, please contact me by direct message:  https://www.mql5.com/en/users/robsjunqueira/
FREE
Midas VWAP
Paulo Henrique Faquineli Garcia
4 (1)
Volume Weighted Average Price (VWAP) is a trading benchmark commonly used by Big Players that gives the average price a Symbol has traded throughout the day. It is based on both Volume and price. This indicator contains Daily VWAP and MIDAS' VWAP, which means you are able to anchor the beggining of MIDAS' calculations and, therefore you will be able to use this methodology to study price versus volume moves after anchor point. You will be able to anchor up to 3 HIGH MIDAS VWAP's and 3 LOW. Wis
FREE
Donchian Pro
Paulo Henrique Faquineli Garcia
5 (2)
The Donchian Channel Channels are among the most popular tools of technical analysis, as they visually convey to the analyst the limits within which most price movement tends to occur. Channel users know that valuable information can be obtained at any time, whether prices are in the central region of a band or close to one of the border lines. One of the best known techniques to explore these concepts is Bollinger Bands. However, John Bollinger was not the only one to research the applicatio
FREE
BetterTickVolume
Zoltan Nemet
5 (2)
Market tops are characterized by Volume Climax Up bars, High Volume Churn and Low Volume Up bars (also called Testing). Market bottoms are characterized by Volume Climax Down bars, High Volume Churn and Low Volume Down bars (Testing). Pullbacks, in either up or down trends, are similar to market topping or bottoming patterns, but shorter in duration and with simpler volume patterns.
FREE
Quantitative Candlesticks Qstick
Flavio Javier Jarabeck
4 (3)
Qstick is a way to objectively quantify candlestick analysis and improve the interpretation of candlestick patterns. Qstick was developed by Tushar Chande and published in his book " The New Technical Trader - Boost Your Profit by Plugging Into the Latest Indicators (1994) ". Qstick is built based on a moving average of the difference between the Open and Close prices. The basis of the idea is that the Opening and Closing prices are the heart of candlestick analysis. We strongly recommend the re
FREE
Cybertrade Double Bollinger Bands - MT5  The Bollinger Bands indicator shows the levels of different highs and lows that a security price has reached in a given duration and also their relative strength, where the highs are close to the upper line and the lows are close to the lower line. Our differential is to present this indicator in a double form, with the availability of its values ​​to simplify automation. It works on periods longer than the period visible on the chart. All values ​​are
FREE
FRB Support and Resistance
Fernando Baratieri
5 (2)
FRB Trader - Our mission is to provide the best support to customers through conted and tools so that they can achieve the expected results FRB Support and Resistance - Indicator places lines on the chart to show Support and Resistance regions. - You can choose the timeframe you want to calculate, as well as the colors of the lines. - Algorithm calculates the points where the strengths of the asset are considered and are extremely important for decision making.
FREE
Hull MA
Flavio Javier Jarabeck
4.6 (20)
The Hull Moving Average is not very well know in novice and maybe in intermediate trading circles, but it is a very nice solution created by the trader Alan Hull - please visit www.AlanHull.com for full details of his creation. The purpose of this moving average is to solve both problems that all famouse and common moving averages have: Lag and Choppiness . The implementation we did has, apart of the Period configuration and Price type to use in the calculations, a "velocity" factor, which could
FREE
QuantumAlert RSI Navigator is a free indicator available for MT4/MT5 platforms, its work is to provide "alerts" when the market is inside "overbought and oversold" regions in the form of "buy or sell" signals. This indicator comes with many customization options mentioned in the parameter section below, user can customise these parameters as needful. Join our MQL5 group , where we share important news and updates. You are also welcome to join our private channel as well, contact me for the priva
FREE
VWAP Indicator
LUC JACOBUS A VERHEECKE
4.32 (25)
Volume Weighted Average Price (VWAP) The volume weighted average price (VWAP) is a  trading   benchmark  used by traders that gives the average price a security has traded at throughout the day, based on both volume and price. It is important because it provides traders with insight into both the trend and value of a security. This indicator VWAP V2 is free and is the manual version of the extended Easy VWAP indicator (30 Euro), where the date and time properties are automatically entered. With
FREE
This indicator sums up the difference between the sells aggression and the buys aggression that occurred in each Candle, graphically plotting the waves of accumulation of the aggression volumes.   Through these waves an exponential average is calculated that indicates the direction of the business flow. Note: This indicator DOES NOT WORK for Brokers and/or Markets WITHOUT the type of aggression (BUY or SELL).   Be sure to try our Professional version with configurable features and alerts:  Agr
FREE
IMA Finder MT5
Mubashir Mohamed Quraish Albarakat
1 (1)
This indicator is designed based on the Moving Origin indicator When the moving origin indicator breaks the price, this indicator gives a signal It is useful for better viewing of signals and analysis on them Attributes: Can be used in all symbols Can be used in all time frames Too many signals Simple and quick settings Easy way to work Settings: period: like moving average settings alarmShow: If you want to receive an alert in Metatrader after receiving the signal, enable this setting a
FREE
Tabajara V5
Flavio Javier Jarabeck
4.88 (42)
Metatrader 5 version of the famous Andre Machado's Tabajara indicator. If you don't know Andre Machado's Technical Analysis work you don't need this indicator... For those who need it and for those several friend traders who asked this porting from other platforms, here it is... FEATURES 8-period Moving Average 20-period Moving Average 50-period Moving Average 200-period Moving Average Colored candles according to the inflexion of the 20-period MA SETTINGS You can change the Period of all M
FREE
Simple Weis Wave
Jean Jacques Huve Ribeiro
4.2 (5)
One of the best tools for analyzing volume, Weis Wave was idelized by David Weis, to facilitate the reading of directional flow. For the VSA method disciples it is an evolution of the practices created by Richard Wycoff, facilitating a predictive reading of the market, always seeking an accumulation and distribution of the negotiated contracts. Cumulative wave volume  Range of wave ( removed) Average Wave volume Ref "Tim Ord lectures" ( removed)
FREE
DMC Average Volume
Deibson Carvalho
4 (1)
516/5000 Average volume indicator to calculate the average volume for a given period. Useful as a filter to measure the strength of a trend, or false breaks in support or resistance. It does not give a signal to buy or sell, it only acts as a filter to avoid entering into transactions with a drop in volume, or below-average volume, which may indicate disinterest in trading at the price level. It has only the parameters of period, method of calculating the average and type of volume.
FREE
LT Weis Waves
Thiago Duarte
5 (11)
The Weis Wave first takes the market volume and then organizes it with the price into Wave charts. It is the only software that will present the true picture of the market before you. If anyone of you, has watched an intraday price movement then you must know that it unfolds in a series of selling as well as buying waves-a procedures tearing down and building up. Wave analysis is an integral part of the trading method. The indicator helps to deal with today’s volatile market. Moreover, it works
FREE
Activity Power
Zoltan Nemet
5 (5)
Multi time frame, multy currency special swing volume indicator with engulfing waves too. Simpler to use compare to Weis Wave. User don't need to adjust wave size. Just use of the basic or the upper time frames. As a multi time frame indikator user can do  very complex time frame analysyses. As well as a multy currency indicator one can make market sector-segment analysyses. Use with Wckoff principles.
FREE
Käufer dieses Produkts erwarben auch
Atomic Analyst MT5
Issam Kassas
4.79 (19)
Zunächst einmal ist es erwähnenswert, dass dieser Handelsindikator nicht neu malt, nicht neu zeichnet und keine Verzögerung aufweist, was ihn sowohl für manuellen als auch für Roboterhandel ideal macht. Benutzerhandbuch: Einstellungen, Eingaben und Strategie. Der Atom-Analyst ist ein PA-Preisaktionsindikator, der die Stärke und das Momentum des Preises nutzt, um einen besseren Vorteil auf dem Markt zu finden. Ausgestattet mit fortschrittlichen Filtern, die helfen, Rauschen und falsche Signale z
Atbot
Zaha Feiz
4.96 (28)
AtBot: Wie es funktioniert und wie man es benutzt ### Wie es funktioniert Der "AtBot"-Indikator für die MT5-Plattform generiert Kauf- und Verkaufssignale mithilfe einer Kombination von technischen Analysetools. Er integriert den einfachen gleitenden Durchschnitt (SMA), den exponentiellen gleitenden Durchschnitt (EMA) und den Durchschnitt der wahren Reichweite (ATR)-Index, um Handelsmöglichkeiten zu identifizieren. Darüber hinaus kann er Heikin Ashi-Kerzen verwenden, um die Signalgenauigkeit zu
Zunächst einmal ist es wichtig zu betonen, dass dieses Handelssystem ein Nicht-Repainting-, Nicht-Redrawing- und Nicht-Verzögerungsindikator ist, was es sowohl für manuelles als auch für automatisches Trading ideal macht. Online-Kurs, Handbuch und Vorlagen herunterladen. Das "Smart Trend Trading System MT5" ist eine umfassende Handelslösung, die für neue und erfahrene Trader maßgeschneidert ist. Es kombiniert über 10 Premium-Indikatoren und bietet mehr als 7 robuste Handelsstrategien, was es zu
Gold Stuff mt5
Vasiliy Strukov
4.9 (185)
Gold Stuff mt5-Ein Trendindikator, der speziell für Gold entwickelt wurde, kann auch auf allen Finanzinstrumenten verwendet werden. Der Indikator wird nicht neu gezeichnet und verzögert sich nicht. Empfohlener Zeitrahmen H1. WICHTIG! Kontaktieren Sie mich sofort nach dem Kauf, um Anweisungen und Bonus zu erhalten!     Sie können eine kostenlose Kopie unseres Strong Support- und Trendscanner-Indikators erhalten, bitte senden Sie uns eine persönliche Nachricht. Mich! DATEN Draw Arrow - in
TPSproTREND PrO MT5
Roman Podpora
4.89 (9)
TPSpro TREND PRO   ist ein Trendindikator, der den Markt automatisch analysiert und Informationen über den Trend und jede seiner Änderungen liefert sowie Signale für den Einstieg in Geschäfte ohne Neuzeichnung gibt! Der Indikator verwendet jede Kerze und analysiert sie separat. bezieht sich auf verschiedene Impulse – Aufwärts- oder Abwärtsimpuls. Exakte Einstiegspunkte in Transaktionen für Währungen, Krypto, Metalle, Aktien, Indizes! Version MT5                   VOLLSTÄNDIGE BESCHREIBUNG DES I
TPSpro RFI Levels MT5
Roman Podpora
4.67 (9)
Umkehr der ersten Impulsniveaus (RFI)       ANWEISUNGEN       Russland       -        ENG    Die Empfehlung basiert auf dem Indikator -   TPSpro   TREND PRO -   Version MT5 Die wichtigsten Elemente in der Branche sind entweder in Zonen oder in der Fabrik enthalten, oder sie führen zu einer Lösung bei einem Kauf oder dem Verkauf eines anderen Instruments. Wenn viele Menschen ihre Rechte nicht auf dem Händlerkonto verschlüsseln, werden die Folgen nicht schnell genug sein. Ich habe es damit abgesch
Dies ist ein Indikator für MT5, der genaue Signale für den Einstieg in einen Handel ohne Repainting (Neuzeichnen) liefert. Er kann auf alle Finanzwerte angewendet werden: Forex, Kryptowährungen, Metalle, Aktien, Indizes. Er liefert ziemlich genaue Schätzungen und sagt Ihnen, wann es am besten ist, eine Position zu eröffnen und zu schließen. Sehen Sie sich das Video (6:22) mit einem Beispiel für die Verarbeitung nur eines Signals an, das sich für den Indikator gelohnt hat! Die meisten Händler ver
Zunächst einmal ist es wichtig zu betonen, dass dieses Handelstool ein Nicht-Repaint-, Nicht-Redraw- und Nicht-Verzögerungsindikator ist, was es ideal für professionelles Trading macht. Online-Kurs, Benutzerhandbuch und Demo. Der Smart Price Action Concepts Indikator ist ein sehr leistungsstarkes Werkzeug sowohl für neue als auch erfahrene Händler. Er vereint mehr als 20 nützliche Indikatoren in einem und kombiniert fortgeschrittene Handelsideen wie die Analyse des Inner Circle Traders und S
Quantum Trend Sniper
Bogdan Ion Puscasu
4.92 (48)
Wir stellen vor       Quantum Trend Sniper Indicator   , der bahnbrechende MQL5-Indikator, der die Art und Weise, wie Sie Trendumkehrungen erkennen und handeln, verändert! Entwickelt von einem Team erfahrener Händler mit über 13 Jahren Handelserfahrung,       Quantum Trend Sniper-Indikator       wurde entwickelt, um Ihre Trading-Reise mit seiner innovativen Methode zur Identifizierung von Trendumkehrungen mit extrem hoher Genauigkeit auf ein neues Niveau zu heben. ***Kaufe Quantum Trend Snipe
Trend Screener Pro MT5
STE S.S.COMPANY
4.88 (67)
Nutzen Sie die Macht des Trendhandels mit Trend Screener Indicator: Ihrer ultimativen Trendhandelslösung, die auf Fuzzy-Logik und einem System mit mehreren Währungen basiert! Steigern Sie Ihren Trendhandel mit Trend Screener, dem revolutionären Trendindikator mit Fuzzy-Logik. Es handelt sich um einen leistungsstarken Trendfolgeindikator, der über 13 Premium-Tools und -Funktionen sowie 3 Handelsstrategien kombiniert und ihn zu einer vielseitigen Wahl macht, um Ihren Metatrader in einen Trendanaly
FX Power MT5 NG
Daniel Stein
5 (6)
Erhalten Sie Ihr tägliches Marktupdate mit Details und Screenshots über unser Morning Briefing hier auf mql5 und auf Telegram ! FX Power MT5 NG ist die nächste Generation unseres langjährig sehr beliebten Währungsstärkemessers FX Power. Und was bietet dieser Stärkezähler der nächsten Generation? Alles, was Sie am ursprünglichen FX Power geliebt haben PLUS GOLD/XAU-Stärkeanalyse Noch präzisere Berechnungsergebnisse Individuell konfigurierbare Analysezeiträume Anpassbares Berechnungslimit für noc
FX Volume MT5
Daniel Stein
4.94 (17)
Erhalten Sie Ihr tägliches Marktupdate mit Details und Screenshots über unser Morning Briefing hier auf mql5 und auf Telegram ! FX Volume ist der ERSTE und EINZIGE Volumenindikator, der einen ECHTEN Einblick in die Marktstimmung aus Sicht eines Brokers bietet. Es bietet fantastische Einblicke in die Positionierung von institutionellen Marktteilnehmern, wie z.B. Brokern, auf dem Forex-Markt, viel schneller als COT-Berichte. Diese Informationen direkt auf Ihrem Chart zu sehen, ist der wahre Game
IX Power MT5
Daniel Stein
4.17 (6)
IX Power   bringt die unschlagbare Präzision von FX Power endlich auch zu Nicht-Forex-Symbolen. Es bestimmt präzise die Intensität von kurz-, mittel- und langfristigen Trends in Ihren Lieblingsindizes, Aktien, Rohstoffen, ETFs und sogar Kryptowährungen. Sie können   alles analysieren, was   Ihr Terminal zu bieten hat. Probieren Sie es aus und erleben Sie, wie   sich Ihr Timing   beim Handel   deutlich verbessert . IX Power Hauptmerkmale 100% präzise, nicht nachpinselnde Berechnungsergebni
XQ Indicator MetaTrader 5
Marzena Maria Szmit
3.5 (2)
Step into the realm of Forex trading with confidence and precision using XQ, a cutting-edge Forex indicator designed to elevate your trading game to unprecedented heights. Whether you're a seasoned trader or just stepping into the world of currency exchange, XQ Forex Indicator empowers you with the insights and signals needed to make informed trading decisions. The signal conditions are a combination of three indicators, and XQ Forex Indicator only display  medium and long-term trends . The ind
Easy By Sell is a market indicator for opening and closing positions. It becomes easy to track market entries with alerts. It indicates trend reversal points when a price reaches extreme values ​​and the most favorable time to enter the market. it is as effective as a Fibonacci to find a level but it uses different tools such as an algorithm based on ATR indicators and Stochastic Oscillator. You can modify these two parameters as you wish to adapt the settings to the desired period. My othe
Dieses Dashboard zeigt die   neuesten verfügbaren harmonischen   Muster für die ausgewählten Symbole, so dass Sie Zeit sparen und effizienter sein werden /   MT4-Version . Kostenloser Indikator:   Basic Harmonic Pattern Spalten des Indikators Symbol:   die ausgewählten Symbole werden angezeigt Trend:   bullish oder bearish Pattern :   Art des Musters (Gartley, Schmetterling, Fledermaus, Krabbe, Hai, Cypher oder ABCD) Entry :   Einstiegskurs SL:   Stop-Loss-Kurs TP1:   1. Take-Profit-Kurs
TrendMaestro5
Stefano Frisetti
note: this indicator is for METATRADER4, if you want the version for METATRADER5 this is the link:  https://www.mql5.com/it/market/product/108106 TRENDMAESTRO ver 2.4 TRENDMAESTRO recognizes a new TREND in the bud, he never makes mistakes. The certainty of identifying a new TREND is priceless. DESCRIPTION TRENDMAESTRO identifies a new TREND in the bud, this indicator examines the volatility, volumes and momentum to identify the moment in which there is an explosion of one or more of these data a
Golden Spikes Premium
Kwaku Bondzie Ghartey
Golden Spikes Detector Overview: The Golden Spikes Premium is a groundbreaking trading indicator meticulously crafted for the Boom and Crash indices on the Deriv market. Tailored to meet the needs of discerning traders, this powerful tool operates exclusively on the one-minute timeframe, providing timely and precise signals to maximize your trading potential. The Golden Spikes Detector stands out in its ability to deliver accurate signals, ensuring that you capitalize on market opportunities wit
Gartley Hunter Multi
Siarhei Vashchylka
5 (8)
Gartley Hunter Multi - An indicator for searching for harmonic patterns simultaneously on dozens of trading instruments and on all possible timeframes. Manual (Be sure to read before purchasing) | Version for MT4 Advantages 1. Patterns: Gartley, Butterfly, Shark, Crab. Bat, Alternate Bat, Deep Crab, Cypher 2. Simultaneous search for patterns on dozens of trading instruments and on all possible timeframes 3. Search for patterns of all possible sizes. From the smallest to the largest 4. A
Sind Sie es leid, Unterstützungs- und Widerstandslinien zu zeichnen? Der Unterstützungswiderstand ist ein Multi-Zeitrahmen-Indikator, der Unterstützungs- und Widerstandslinien mit einer sehr interessanten Wendung automatisch erkennt und zeichnet: Wenn das Preisniveau im Laufe der Zeit getestet wird und seine Bedeutung zunimmt, werden die Linien dicker und dunkler. [ Installationsanleitung | Update-Anleitung | Fehlerbehebung | FAQ | Alle Produkte ] Steigern Sie Ihre technische Analyse über Nacht
Matrix Arrow Indicator MT5
Juvenille Emperor Limited
5 (14)
Matrix Arrow Indicator MT5   ist ein einzigartiger 10-in-1-Trend, der zu   100 % nicht neu gezeichnet   werden kann. Multi-Timeframe-Indikator, der für alle Symbole/Instrumente verwendet werden kann:   Forex ,   Rohstoffe ,   Kryptowährungen ,   Indizes ,   Aktien .  Der  Matrix Arrow Indicator MT5  wird den aktuellen Trend in seinen frühen Stadien bestimmen und Informationen und Daten von bis zu 10 Standardindikatoren sammeln, die sind: Durchschnittlicher Richtungsbewegungsindex (ADX) Rohstoff
Volume by Price MT5
Brian Collard
3.6 (5)
The Volumebyprice.com Indicator for MetaTrader 5 features Volume Profile and Market Profile TPO (Time Price Opportunity). Volume and TPO histogram bar and line charts. Volume Footprint charts. TPO letter and block marker collapsed and split structure charts. Static, dynamic and flexible range segmentation and compositing methods with relative and absolute visualizations. Session hours filtering and segment concatenation with Market Watch and custom user specifications. Graphical layering, posit
ICT, SMC, SMART MONEY CONCEPTS, SMART MONEY, Smart Money Concept, Support and Resistance, Trend Analysis, Price Action, Market Structure, Order Blocks, BOS/CHoCH,   Breaker Blocks ,  Momentum Shift,   Supply&Demand Zone/Order Blocks , Strong Imbalance,   HH/LL/HL/LH,    Fair Value Gap, FVG,  Premium  &   Discount   Zones, Fibonacci Retracement, OTE, Buy Side Liquidity, Sell Side Liquidity, BSL/SSL Taken, Equal Highs & Lows, MTF Dashboard, Multiple Time Frame, BigBar, HTF OB, HTF Market Structure
Das Volatility Trend System ist ein Handelssystem, das Signale für Einstiege liefert. Das Volatilitätssystem liefert lineare und punktuelle Signale in Richtung des Trends sowie Signale zum Verlassen des Trends, ohne Neuzeichnung oder Verzögerungen. Der Trendindikator überwacht die Richtung des mittelfristigen Trends, zeigt die Richtung und deren Änderung an. Der Signalindikator basiert auf Änderungen der Volatilität und zeigt Markteintritte an. Der Indikator ist mit mehreren Arten von Warn
Blahtech Supply Demand MT5
Blahtech Limited
4.54 (13)
Was: $299  Now: $99   Supply Demand uses previous price action to identify potential imbalances between buyers and sellers. The key is to identify the better odds zones, not just the untouched ones. Blahtech Supply Demand indicator delivers functionality previously unavailable on any trading platform. This 4-in-1 indicator not only highlights the higher probability zones using a multi-criteria strength engine, but also combines it with multi-timeframe trend analysis, previously confirmed swings
Gold TMAF MTF - dies ist ein bester technischer Indikator für Aktien. Der Algorithmus des Indikators analysiert die Preisbewegung eines Vermögenswertes und spiegelt die Volatilität und potenzielle Einstiegszonen wider. Die besten Indikatorsignale: - Für VERKAUF = rote obere Begrenzung von TMA2 über der roten oberen Begrenzung von TMA1 + roter Fraktalindikator oben + gelber SR-Signalpfeil in die gleiche Richtung. - Für KAUFEN = blaue untere Grenze von TMA2 unterhalb der blauen unteren Gr
Automated Trendlines MT5
Georgios Kalomoiropoulos
Trendlinien sind das wichtigste Werkzeug der technischen Analyse im Devisenhandel. Leider zeichnen die meisten Händler sie nicht richtig. Der automatische Trendlinien-Indikator ist ein professionelles Tool für ernsthafte Trader, das Ihnen hilft, die Trendbewegung der Märkte zu visualisieren. Es gibt zwei Arten von Trendlinien Bullische Trendlinien und Bärische Trendlinien. Im Aufwärtstrend wird die Forex-Trendlinie durch die niedrigsten Swing-Punkte der Preisbewegung gezogen. Wenn man m
Der Forex TPA Indikator deckt die wahren Aktionen der Marktmacher auf, immer dann wenn sie passieren. "Kämpfe nicht gegen die Marktmacher an, sondern folge ihnen", ist wohl der beste Rat, den ein Trader bekommen kann. Der TPA Indikator zeigt jedesmal seine Signale an wenn die Bullen definitiv stärker sind als die Bären und umgekehrt. Dieser Indikator wurde VON Tradern FÜR Trader gemacht und ist 100% NICHT NACHZEICHNEND! Signale werden STRENG am Schluss einer Kerze  generiert. Das sagen unsere Ku
** All Symbols x All Timeframes scan just by pressing scanner button ** ***Contact me after purchase to send you instructions and add you in "123 scanner group" for sharing or seeing experiences with other users. After 17 years of experience in the markets and programming, Winner indicator is ready. I would like to share with you! Introduction The 123 Pattern Scanner indicator with a special enhanced algorithm is a very repetitive common pattern finder with a high success rate . Interestingly,
Auto Order Block with break of structure based on ICT and Smart Money Concepts (SMC) Futures Break of Structure ( BoS )             Order block ( OB )            Higher time frame Order block / Point of Interest ( POI )    shown on current chart           Fair value Gap ( FVG ) / Imbalance   -  MTF      ( Multi Time Frame )    HH/LL/HL/LH  -  MTF      ( Multi Time Frame )  Choch  MTF      ( Multi Time Frame )  Volume Imbalance     ,  MTF          vIMB Gap’s Power of 3 Equal High
Weitere Produkte dieses Autors
AI Channel
Thalles Nascimento De Carvalho
4 (4)
Einleitung: Willkommen zur Präsentation des AI Channel Indikators, einem leistungsstarken Tool, das künstliche Intelligenz für die Analyse von Preisbereichen auf dem Finanzmarkt verwendet. In dieser Sitzung werden wir erforschen, wie dieser revolutionäre Indikator Anlegern und Händlern dabei helfen kann, fundiertere und strategischere Entscheidungen zu treffen. Fangen wir an! I. Was ist der AI Channel Indikator? AI Channel ist ein Indikator, der auf fortschrittlichen künstlichen Intelligenzalgor
FREE
Master OBV FX
Thalles Nascimento De Carvalho
5 (1)
MasterOBV: Beherrschen Sie die Markttrends mit Präzision! MasterOBV ist ein technischer Analyseindikator , der Volumen , positive Korrelation und einen Gleitenden Durchschnitt (MA) kombiniert, um die Identifizierung von Trends auf den Finanzmärkten zu verfeinern. Hauptmerkmale: Intelligentes Volumen: Analysiert das Handelsvolumen, um bedeutende Änderungen in der Trendstärke zu identifizieren. Positive Korrelation: Bezieht korrelierte Vermögenswerte ein, um eine umfassendere und genau
FREE
Long Short
Thalles Nascimento De Carvalho
4.67 (3)
Long & Short Indikator: Das ultimative Werkzeug zur Marktbewegungsanalyse Hohe Trefferquote mit Echtzeitinformationen Verfolgen Sie die Bewegungen von Vermögenswerten mit hoher Genauigkeit und treffen Sie Ihre Entscheidungen basierend auf aktuellen Daten. ️ Sicherere Handelspositionen Nutzen Sie positive und negative Korrelationen, um sicherere und fundiertere Handelsentscheidungen zu treffen. Erleichtert die Kurz- und Langzeitanalyse Ideal für kurzfristige und langfristige St
FREE
Swing Point Volume
Thalles Nascimento De Carvalho
Swing Point Volume, the indicator that signals weakness and strength at the tops and bottoms. This indicador can be for used the Wyckoff Method. Information provided; - Swing on customized ticks. - Volume and points in each balance sheet. - Percentage of Displacement. - Sound alert option on top and bottom breaks. - Volume in ticks and Real Volume. - Volume HL (extreme) or (opening and closing) - Customized volume shapes.
Atr Projection
Thalles Nascimento De Carvalho
O Indicador ATR Projeção destaca-se como uma ferramenta robusta na análise técnica, projetada para fornecer insights precisos sobre os limites potenciais de movimentação dos preços no mercado financeiro. Sua abordagem flexível permite aos usuários customizar as métricas de análise de forma intuitiva, adaptando-se às necessidades específicas de cada ativo operado. Funcionamento Personalizável: Por padrão, o ATR Projeção opera considerando 30% da média dos últimos 100 candles. Essa flexibili
Box Weis Wave
Thalles Nascimento De Carvalho
5 (1)
Verbessern Sie Ihre Analyse mit dem Weis Wave Box! Wenn Sie Präzision und Klarheit in Ihrem Handel suchen, ist der Weis Wave Box das Werkzeug, das Sie benötigen. Dieser fortschrittliche Indikator bietet eine detaillierte visuelle Analyse von Volumenwellen und Swing-Punkten und hilft Ihnen, die Beziehung zwischen Aufwand und Ergebnissen auf dem Markt besser zu verstehen. Hauptmerkmale des Weis Wave Box: Anpassbare Volumenwellen: Passen Sie die Volumenwellen in Ticks an Ihre Handelsstrateg
Long Short Pro
Thalles Nascimento De Carvalho
Long & Short Indikator - Pro Version: Entfesseln Sie das unbegrenzte Potenzial Ihrer Marktanalyse! Keine Einschränkungen für Alle Assets Die Pro-Version des Long & Short Indikators bietet Ihnen die völlige Freiheit, ihn auf jedem Finanzinstrument zu verwenden. Keine Einschränkungen mehr – wenden Sie denselben Indikator auf all Ihren bevorzugten Assets an! Keine Einschränkungen Genießen Sie alle Funktionen des Indikators ohne jegliche Einschränkungen. Die Pro-Version bietet ein vol
Reversal Vol Propagation
Thalles Nascimento De Carvalho
Sind Sie es leid, Handelsmöglichkeiten zu verpassen, weil Sie Preisumkehrungen nicht rechtzeitig erkennen können? Möchten Sie Ihre Gewinne maximieren und informierte Handelsentscheidungen treffen? Wir präsentieren Ihnen den Reversal Vol Propagation Indikator, das revolutionäre Tool, das neuronale Netzwerke und Volumendaten verwendet, um mögliche Preisumkehrungen vorherzusagen. Basierend auf einer leistungsstarken Kombination aus fortschrittlichen Algorithmen und modernster Technologie analysiert
Didi Index Volume
Thalles Nascimento De Carvalho
Wir stellen Ihnen den Didi Index Volume vor, einen technischen Analyseindikator, der vom brasilianischen Trader Odir Aguiar entwickelt wurde und sich durch einen fortgeschrittenen und leistungsstarken Ansatz zur Identifizierung von Chancen auf dem Finanzmarkt auszeichnet. Der Didi Index Volume ist auf verschiedenen Plattformen verfügbar und hat sich zu einem unverzichtbaren Werkzeug für Trader entwickelt, die präzise Einblicke und wertvolle Informationen für ihre Handelsstrategien suchen. Der
Smart Binary Volume
Thalles Nascimento De Carvalho
Der Smart Binary Volume-Indikator ist ein vielseitiges Werkzeug, das den Handelsvolumen-Analysen mit maschinellem Lernen kombiniert. Er kann auf verschiedenen Märkten und Strategien angewendet werden, einschließlich Scalping und anderen Arten von kurzfristigen Handelsgeschäften. Durch den Einsatz fortschrittlicher maschineller Lernalgorithmen erkennt der Indikator komplexe Muster und generiert präzisere Kauf- und Verkaufssignale. Buffer to Create EA. Buffer Line Gold = 0. Buffer Line Red = 2
TimeChannel
Thalles Nascimento De Carvalho
The "Timechannel" is a powerful technical analysis tool designed specifically for traders who want to gain deeper and more accurate insights into price movements across multiple timeframes (multi-timeframe). This indicator is an essential addition to the toolbox of any serious trader seeking to make informed and data-driven trading decisions. Key Features: Advanced Multi-Timeframe Analysis : Timechannel allows traders to analyze price movements on different timeframes simultaneously. This is cr
DeltaBook
Thalles Nascimento De Carvalho
Der Delta Book-Indikator ist ein leistungsstarkes Instrument zur Marktanalyse, das die Verwendung von Volumen-Delta mit Informationen aus dem Orderbuch kombiniert, um Preisbewegungen in Finanzmärkten wie Aktien, Futures und Kryptowährungen zu erkennen. Es ist wichtig zu beachten, dass der Delta Book-Zugang zu Echtzeitvolumendaten und Orderbuchinformationen erfordert, um sein volles Potenzial auszuschöpfen. Die Hauptmerkmale des Delta Book sind seine fortschrittliche Marktanalysestrategie, die es
Big Player Range
Thalles Nascimento De Carvalho
5 (2)
Entdecken Sie die Kraft von "BigPlayerRange": Ihr Verbündeter in der technischen Marktanalyse Wir stellen Ihnen BigPlayerRange vor, ein fortschrittliches Werkzeug für die technische Analyse, das entwickelt wurde, um die Interessenbereiche institutioneller Anleger auf dem Markt aufzudecken. Mit diesem Tool können Sie präzise identifizieren, wo die Hauptakteure aktiv sind und wie sich dies auf Ihre Handelsstrategien auswirken kann. Hauptmerkmale: Kartierung von Interessenbereichen institution
Master OBV
Thalles Nascimento De Carvalho
MasterOBV: Beherrschen Sie die Markttrends mit Präzision! MasterOBV ist ein technischer Analyseindikator , der Volumen , positive Korrelation und einen Gleitenden Durchschnitt (MA) kombiniert, um die Identifizierung von Trends auf den Finanzmärkten zu verfeinern. Hauptmerkmale: Intelligentes Volumen: Analysiert das Handelsvolumen, um bedeutende Änderungen in der Trendstärke zu identifizieren. Positive Korrelation: Bezieht korrelierte Vermögenswerte ein, um eine umfassendere und genau
Smart Delta Volume
Thalles Nascimento De Carvalho
Smart Delta Volume: Präzise und Anpassungsfähig an Dynamische Marktbedingungen Der Smart Delta Volume ist ein fortschrittlicher technischer Indikator, der entwickelt wurde, um präzise und anpassungsfähige Analysen in einem sich ständig verändernden Marktumfeld zu bieten. Durch die Nutzung dynamischer Niveaus, die sich automatisch an die Volatilität anpassen, liefert dieser Indikator eine umfassendere und verlässlichere Sicht auf das Zusammenspiel von Volumenfluss und Preisbewegungen. Diese An
VolaMetrics VSA
Thalles Nascimento De Carvalho
VolaMetrics VSA | Ein Mächtiger Verbündeter in der Technischen Analyse Der VolaMetrics VSA ist ein technischer Analyseindikator, der die Volume Spread Analysis (VSA) Methode mit einer detaillierten Analyse des Handelsvolumens kombiniert. Entwickelt, um signifikante Preisbewegungen zu identifizieren und zu verfolgen , nutzt der VolaMetrics VSA die Interaktion zwischen Volumen und Preisspread , um wertvolle Einblicke zu bieten, die bei Handelsentscheidungen unterstützen können. Grundlagen der V
SwingVolumePro
Thalles Nascimento De Carvalho
Überblick SwingVolumePro ist ein fortschrittlicher und vielseitiger Indikator, der für eine breite Palette von Finanzinstrumenten entwickelt wurde und verschiedene Handelsstile unterstützt. Basierend auf strengen Analysen von Volumen und Preis bietet er klare und präzise Signale, die es Händlern aller Erfahrungsstufen ermöglichen, informierte Entscheidungen auf Grundlage hochwertiger Daten zu treffen. Hauptmerkmale Vielseitigkeit: SwingVolumePro kann auf verschiedenen Assets angewendet
CVD SmoothFlow Pro
Thalles Nascimento De Carvalho
CVD SmoothFlow Pro - Unbegrenzte Volumenanalyse für jedes Asset! CVD SmoothFlow Pro ist die ultimative Lösung für Trader, die eine präzise und unbegrenzte Volumenanalyse suchen. Mit der Berechnung des Cumulative Volume Delta (CVD) und fortschrittlicher Rauschfilterung bietet die Pro-Version die Flexibilität und Genauigkeit, die für den Handel mit jedem Finanzinstrument erforderlich sind. Was bietet CVD SmoothFlow Pro? Klarer Analyse : Filtert Marktrauschen und hebt signifikante Volumenbewe
Auswahl:
Keine Bewertungen
Antwort auf eine Rezension