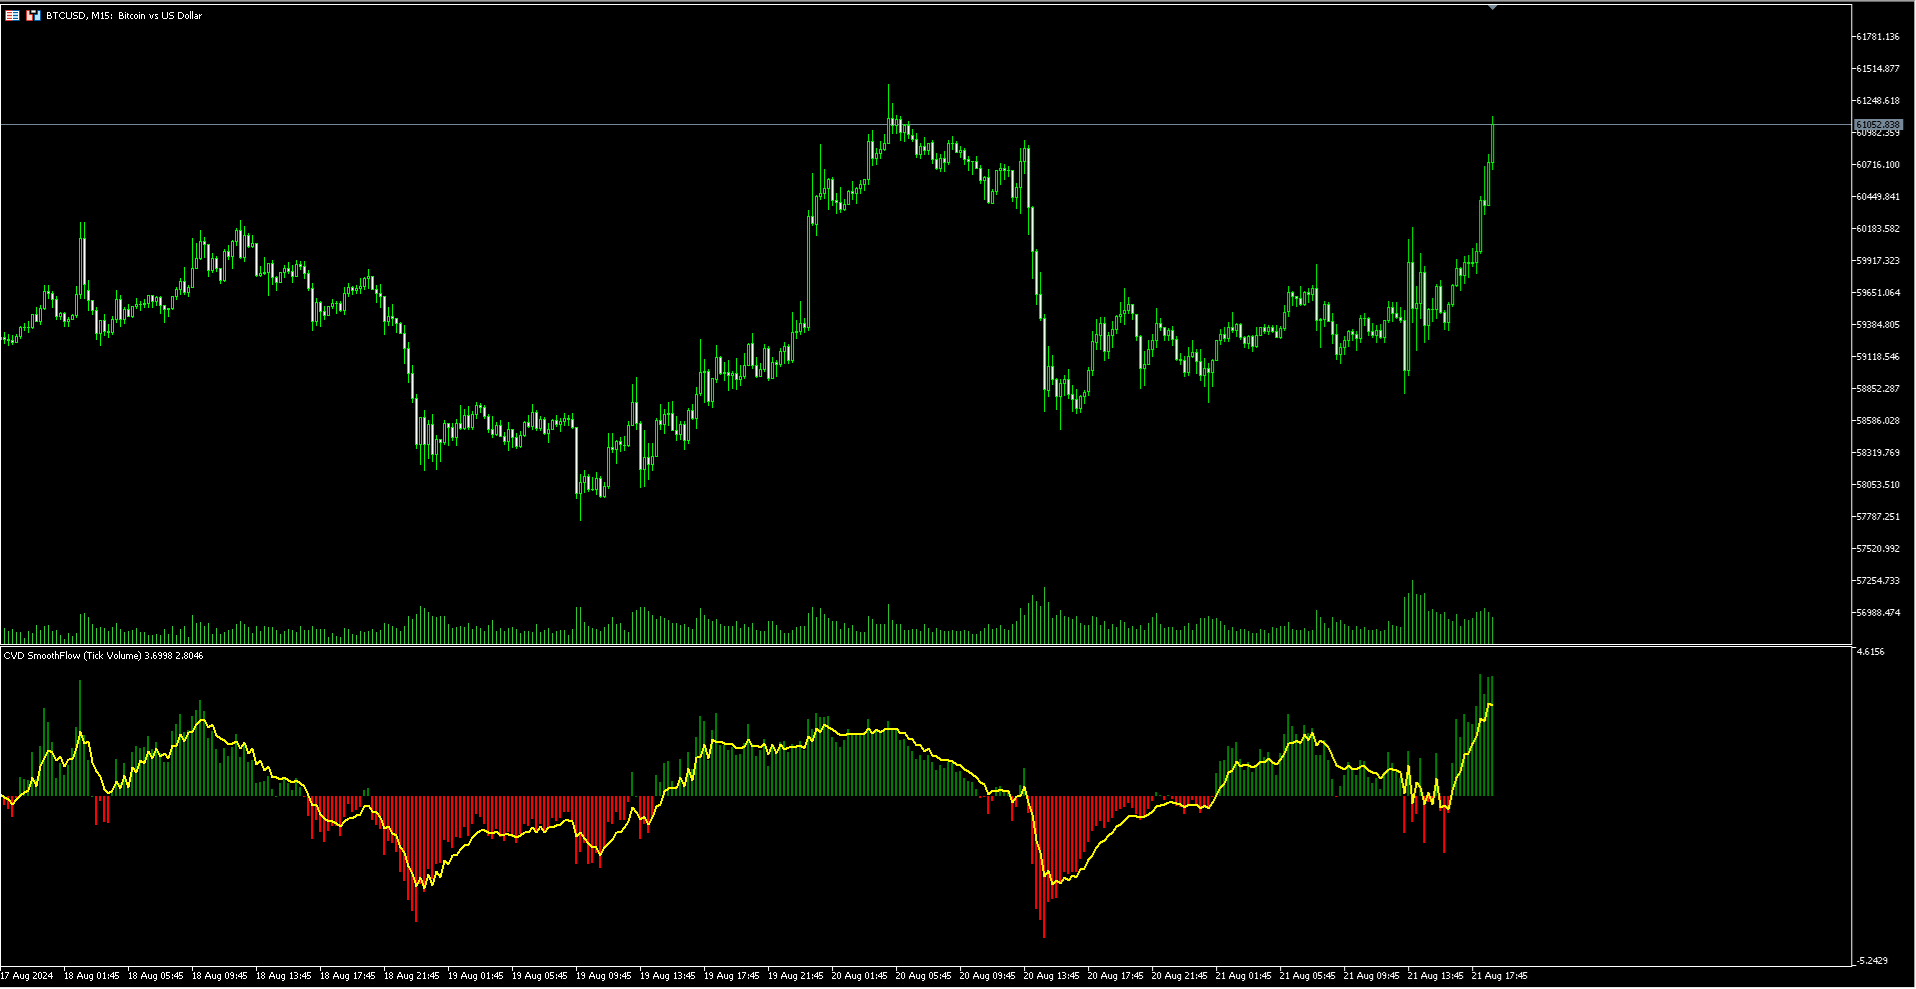
• 미리보기
  • 리뷰
  • 코멘트

CVD SmoothFlow

CVD SmoothFlow - BTCUSD를 위한 정밀한 거래량 분석 간소화!

CVD SmoothFlowBTCUSD 페어를 거래하는 트레이더를 위해 특별히 개발된 기술 지표입니다. Cumulative Volume Delta (CVD) 계산을 활용하여 고급 노이즈 필터링을 적용, 시장을 명확하고 정확하게 분석합니다.

🔍 CVD SmoothFlow가 제공하는 것:

  • 📊 명확한 분석: 시장의 노이즈를 필터링하여 가장 관련 있고 중요한 거래량 변동에 집중할 수 있습니다.
  • ⚙️ 정밀한 계산: 매수와 매도 간의 차이를 모니터링하여 BTCUSD에서의 거래량 행동에 대한 자세한 정보를 제공합니다.
  • 💡 직관적인 인터페이스: 데이터 이해를 용이하게 하여 거래량 분석을 접근하기 쉽고 효율적으로 만듭니다.
  • 📈 트렌드 식별: 더 확신을 가지고 시장 트렌드를 식별하고 정보에 기반한 결정을 지원합니다.

💼 실용적인 용도:

  • 실시간으로 매수자와 매도자 간의 균형을 모니터링합니다.
  • 거래량을 기반으로 트렌드 반전을 식별합니다.
  • 필터링 기능을 사용하여 BTCUSD의 관련 시장 동향에 집중합니다.

⚠️ 주의: CVD SmoothFlowBTCUSD 페어 전용입니다.

🔓 Pro 버전 이용 가능!

다른 페어와 자산에서 CVD SmoothFlow를 사용하고자 하는 경우, Pro 버전이 모든 기능을 제한 없이 제공합니다! 이 기회를 통해 시장 분석을 확장해 보세요.

🔗 Pro 버전 구입하기: CVD SmoothFlow Pro


추천 제품
VWAP Simple
Deibson Carvalho
4.06 (34)
The Volume Weighted Average Price is similar to a moving average, except volume is included to weight the average price over a period.    Volume-Weighted Average Price [VWAP] is a dynamic, weighted average designed to more accurately reflect  a security’s true average price over a given period . Mathematically, VWAP is the summation of money (i.e., Volume x Price) transacted divided by the total volume over any time horizon, typically from market open to market close. VWAP reflects the capital
FREE
Market Momentum
Flavio Javier Jarabeck
3.86 (7)
The Market Momentum indicator is based on the Volume Zone Oscillator (VZO), presented by Waleed Aly Khalil in the 2009 edition of the International Federation of Technical Analysts journal, and presents a fresh view of this market valuable data that is oftenly misunderstood and neglected: VOLUME. With this new approach of "seeing" Volume data, traders can infer more properly market behavior and increase their odds in a winning trade. "The VZO is a leading volume oscillator; its basic usefulnes
FREE
Weis Waves
Flavio Javier Jarabeck
3.15 (26)
The original author is David Weis, an expert in the Wyckoff Method. The Weis Wave is a modern adaptation of the 1930's Wyckoff Method, another expert in Tape Reading techniques and Chart Analysis. Weis Waves takes market volume and stacks it into waves according to price conditions giving the trader valuable insights about the market conditions. If you want to learn more about this subject you can find tons of videos in YouTube. Just look for "The Wickoff Method", "Weis Wave" and "Volume Spread
FREE
ADX consolidado
OTAVIO AGUIAR CAMPOS Aguiar
4.8 (5)
Mostra a média móvel quando ADX > 20 e pinta de verde ou vermelho quando os valores de ADX estão subindo indicando tendência. Quando o ADX é menor que 20 indica movimento lateral consolidado. O indicador não define pontos de entrada, somente mostra a média colorida quando a tendência está se fortalecendo. Faz parte do grupo de indicadores do Indicador Tavim.
FREE
Supports And Resistances Lines
Francisco Gomes Da Silva
4.76 (41)
지원 및 저항 구역 표시기 MT5 이 표시기는 상단과 하단을 자동으로 식별하는 방법을 알고 있습니다. 이 지지선과 저항선 표시기는 상단과 하단을 기준으로 지지선과 저항선을 만듭니다. 지지선과 저항선을 만드는 방법. 자동 지지선과 저항선을 만드는 지표입니다. 지표로 지원 수준을 찾는 방법 이 표시기는 자동으로 상단과 하단을 찾습니다. 지그재그(ZigZag)가 자동으로 바닥을 생성하거나 새로운 바닥을 이전 바닥보다 낮게 만들 때마다 표시기가 자동으로 지지선을 생성하므로 표시기가 자동으로 화면에 자동 지지선을 그립니다. 저항선을 만드는 방법. 지그재그(ZigZag)가 새로운 최고점이나 최고점을 이전 최고점보다 높게 만들 때마다 표시기가 지지선을 생성하는 것과 같은 방식으로 자동으로 저항선을 생성하므로 표시기가 자동으로 새로운 저항을 생성하므로 사용자가 상단과 하단 레벨이 어디에 있는지 걱정해야 합니다. 이 지표는 트레이더가 차트에 지지와 저항을 표시할 수 있는 쉬운 방법입니다. 상단 표시
FREE
MIDAS Super VWAP
Flavio Javier Jarabeck
4.29 (14)
Imagine VWAP, MVWAP and MIDAS in one place... Well, you found it! Now you can track the movement of Big Players in various ways, as they in general pursue the benchmarks related to this measuring, gauging if they had good execution or poor execution on their orders. Traders and analysts use the VWAP to eliminate the noise that occurs throughout the day, so they can measure what prices buyers and sellers are really trading. VWAP gives traders insight into how a stock trades for that day and deter
FREE
Stackable VWAP
Flavio Javier Jarabeck
3.33 (6)
Volume Weighted Average Price (VWAP) is a trading benchmark commonly used by Big Players that gives the average price a Symbol has traded throughout the day. It is based on both Volume and price. Additionally we put in this indicator the MVWAP (Moving Volume Weighted Average Price). For those who do not know the usage and the importance od this indicator I recommend a great article about this subject at Investopedia ( https://www.investopedia.com/articles/trading/11/trading-with-vwap-mvwap.asp
FREE
Aggression Volume
Flavio Javier Jarabeck
3.91 (22)
Aggression Volume Indicator is the kind of indicator that is rarely found in the MQL5 community because it is not based on the standard Volume data provided by the Metatrader 5 platform. It requires the scrutiny of all traffic Ticks requested on the platform... That said, Aggression Volume indicator requests all Tick Data from your Broker and processes it to build a very special version of a Volume Indicator, where Buyers and Sellers aggressions are plotted in a form of Histogram. Additionally,
FREE
VWAP and MVWAP
Flavio Javier Jarabeck
4.17 (6)
Volume Weighted Average Price (VWAP) is a trading benchmark commonly used by Big Players that gives the average price a Symbol has traded throughout the day. It is based on both Volume and price. Additionally we put in this indicator the MVWAP (Moving Volume Weighted Average Price). For those who do not know the usage and the importance od this indicator I recommend a great article about this subject at Investopedia ( https://www.investopedia.com/articles/trading/11/trading-with-vwap-mvwap.asp )
FREE
Wave Box Market Frenquency
Jean Jacques Huve Ribeiro
4.83 (6)
Totally linked to the result of a movement and the duration he had. Its height records how many ticks the asset walked during a given movement, its width shows us the duration that movement had. Its configuration must be in line with the Weis Wave Indicator configuration to observe the movement force and can indicate a possible accumulation or distribution of the movement;
FREE
FT ADX Color Candles
FELIPE MISAEL MORAES KRUGER
4.86 (7)
Trading can be quite tiring when you need to look at several things at the same time. Format of candles, supports, resistances, schedules, news and indicators. This tool aims to facilitate the analysis of the ADX indicator. It colors the candles based on the levels of the indicator and the DI lines. The period, the limit of the indicator and the colors of the candles are customizable. You can also place a visual aid on the lower right side of the graph to view the values of ADX, DI + and
FREE
Value Chart Candlesticks
Flavio Javier Jarabeck
4.7 (10)
The idea of a Value Chart indicator was presented in the very good book I read back in 2020 , " Dynamic Trading Indicators: Winning with Value Charts and Price Action Profile ", from the authors Mark Helweg and David Stendahl. The idea is simple and the result is pure genius: Present candlestick Price analysis in a detrended way! HOW TO READ THIS INDICATOR Look for Overbought and Oversold levels. Of course, you will need to test the settings a lot to find the "correct" one for your approach.
FREE
The Volume Plus indicator for MT5 can be effectively used for detecting imbalances in supply and demand. The indicator improves on the typical volume histogram by coloring the bars. Bar colors (colors are customizable): Neutral - DimGray Wide Spread (Range) Bar on High Volume - MediumBlue Narrow Spread, High Volume - MidnightBlue Wide Spread, Low Volume - ForestGreen Narrow Spread, Low Volume - DarkGreen Very/Ultra Wide Spread, Low Volume - Aqua Narrow Spread, Ultra High Volume - Purple V
FREE
Weis Waves RSJ
JETINVEST
4.67 (9)
The Weis Waves RSJ Indicator sums up volumes in each wave. This is how we receive a bar chart of cumulative volumes of alternating waves. Namely the cumulative volume makes the Weis wave charts unique. It allows comparing the relation of the wave sequence characteristics, such as correspondence of the applied force (expressed in the volume) and received result (the price progress). If you still have questions, please contact me by direct message:  https://www.mql5.com/en/users/robsjunqueira/
FREE
Midas VWAP
Paulo Henrique Faquineli Garcia
4 (1)
Volume Weighted Average Price (VWAP) is a trading benchmark commonly used by Big Players that gives the average price a Symbol has traded throughout the day. It is based on both Volume and price. This indicator contains Daily VWAP and MIDAS' VWAP, which means you are able to anchor the beggining of MIDAS' calculations and, therefore you will be able to use this methodology to study price versus volume moves after anchor point. You will be able to anchor up to 3 HIGH MIDAS VWAP's and 3 LOW. Wis
FREE
Donchian Pro
Paulo Henrique Faquineli Garcia
5 (2)
The Donchian Channel Channels are among the most popular tools of technical analysis, as they visually convey to the analyst the limits within which most price movement tends to occur. Channel users know that valuable information can be obtained at any time, whether prices are in the central region of a band or close to one of the border lines. One of the best known techniques to explore these concepts is Bollinger Bands. However, John Bollinger was not the only one to research the applicatio
FREE
BetterTickVolume
Zoltan Nemet
5 (2)
Market tops are characterized by Volume Climax Up bars, High Volume Churn and Low Volume Up bars (also called Testing). Market bottoms are characterized by Volume Climax Down bars, High Volume Churn and Low Volume Down bars (Testing). Pullbacks, in either up or down trends, are similar to market topping or bottoming patterns, but shorter in duration and with simpler volume patterns.
FREE
Quantitative Candlesticks Qstick
Flavio Javier Jarabeck
4 (3)
Qstick is a way to objectively quantify candlestick analysis and improve the interpretation of candlestick patterns. Qstick was developed by Tushar Chande and published in his book " The New Technical Trader - Boost Your Profit by Plugging Into the Latest Indicators (1994) ". Qstick is built based on a moving average of the difference between the Open and Close prices. The basis of the idea is that the Opening and Closing prices are the heart of candlestick analysis. We strongly recommend the re
FREE
Cybertrade Double Bollinger Bands - MT5  The Bollinger Bands indicator shows the levels of different highs and lows that a security price has reached in a given duration and also their relative strength, where the highs are close to the upper line and the lows are close to the lower line. Our differential is to present this indicator in a double form, with the availability of its values ​​to simplify automation. It works on periods longer than the period visible on the chart. All values ​​are
FREE
FRB Support and Resistance
Fernando Baratieri
5 (2)
FRB Trader - Our mission is to provide the best support to customers through conted and tools so that they can achieve the expected results FRB Support and Resistance - Indicator places lines on the chart to show Support and Resistance regions. - You can choose the timeframe you want to calculate, as well as the colors of the lines. - Algorithm calculates the points where the strengths of the asset are considered and are extremely important for decision making.
FREE
Hull MA
Flavio Javier Jarabeck
4.6 (20)
The Hull Moving Average is not very well know in novice and maybe in intermediate trading circles, but it is a very nice solution created by the trader Alan Hull - please visit www.AlanHull.com for full details of his creation. The purpose of this moving average is to solve both problems that all famouse and common moving averages have: Lag and Choppiness . The implementation we did has, apart of the Period configuration and Price type to use in the calculations, a "velocity" factor, which could
FREE
QuantumAlert RSI Navigator is a free indicator available for MT4/MT5 platforms, its work is to provide "alerts" when the market is inside "overbought and oversold" regions in the form of "buy or sell" signals. This indicator comes with many customization options mentioned in the parameter section below, user can customise these parameters as needful. Join our MQL5 group , where we share important news and updates. You are also welcome to join our private channel as well, contact me for the priva
FREE
VWAP Indicator
LUC JACOBUS A VERHEECKE
4.32 (25)
Volume Weighted Average Price (VWAP) The volume weighted average price (VWAP) is a  trading   benchmark  used by traders that gives the average price a security has traded at throughout the day, based on both volume and price. It is important because it provides traders with insight into both the trend and value of a security. This indicator VWAP V2 is free and is the manual version of the extended Easy VWAP indicator (30 Euro), where the date and time properties are automatically entered. With
FREE
Aggression Wave RSJ
JETINVEST
4.38 (8)
This indicator sums up the difference between the sells aggression and the buys aggression that occurred in each Candle, graphically plotting the waves of accumulation of the aggression volumes.   Through these waves an exponential average is calculated that indicates the direction of the business flow. Note: This indicator DOES NOT WORK for Brokers and/or Markets WITHOUT the type of aggression (BUY or SELL).   Be sure to try our Professional version with configurable features and alerts:  Agr
FREE
IMA Finder MT5
Mubashir Mohamed Quraish Albarakat
1 (1)
This indicator is designed based on the Moving Origin indicator When the moving origin indicator breaks the price, this indicator gives a signal It is useful for better viewing of signals and analysis on them Attributes: Can be used in all symbols Can be used in all time frames Too many signals Simple and quick settings Easy way to work Settings: period: like moving average settings alarmShow: If you want to receive an alert in Metatrader after receiving the signal, enable this setting a
FREE
Tabajara V5
Flavio Javier Jarabeck
4.88 (42)
Metatrader 5 version of the famous Andre Machado's Tabajara indicator. If you don't know Andre Machado's Technical Analysis work you don't need this indicator... For those who need it and for those several friend traders who asked this porting from other platforms, here it is... FEATURES 8-period Moving Average 20-period Moving Average 50-period Moving Average 200-period Moving Average Colored candles according to the inflexion of the 20-period MA SETTINGS You can change the Period of all M
FREE
Simple Weis Wave
Jean Jacques Huve Ribeiro
4.2 (5)
One of the best tools for analyzing volume, Weis Wave was idelized by David Weis, to facilitate the reading of directional flow. For the VSA method disciples it is an evolution of the practices created by Richard Wycoff, facilitating a predictive reading of the market, always seeking an accumulation and distribution of the negotiated contracts. Cumulative wave volume  Range of wave ( removed) Average Wave volume Ref "Tim Ord lectures" ( removed)
FREE
DMC Average Volume
Deibson Carvalho
4 (1)
516/5000 Average volume indicator to calculate the average volume for a given period. Useful as a filter to measure the strength of a trend, or false breaks in support or resistance. It does not give a signal to buy or sell, it only acts as a filter to avoid entering into transactions with a drop in volume, or below-average volume, which may indicate disinterest in trading at the price level. It has only the parameters of period, method of calculating the average and type of volume.
FREE
LT Weis Waves
Thiago Duarte
5 (11)
The Weis Wave first takes the market volume and then organizes it with the price into Wave charts. It is the only software that will present the true picture of the market before you. If anyone of you, has watched an intraday price movement then you must know that it unfolds in a series of selling as well as buying waves-a procedures tearing down and building up. Wave analysis is an integral part of the trading method. The indicator helps to deal with today’s volatile market. Moreover, it works
FREE
Activity Power
Zoltan Nemet
5 (5)
Multi time frame, multy currency special swing volume indicator with engulfing waves too. Simpler to use compare to Weis Wave. User don't need to adjust wave size. Just use of the basic or the upper time frames. As a multi time frame indikator user can do  very complex time frame analysyses. As well as a multy currency indicator one can make market sector-segment analysyses. Use with Wckoff principles.
FREE
이 제품의 구매자들이 또한 구매함
Atomic Analyst MT5
Issam Kassas
4.79 (19)
우선적으로 언급할 점은이 거래 지표가 다시 그리지 않고 지연되지 않으며 이를 통해 수동 및 로봇 거래 모두에 이상적이라는 점입니다. 사용자 매뉴얼: 설정, 입력 및 전략. Atomic Analyst는 가격의 강도와 모멘텀을 활용하여 시장에서 더 나은 이점을 찾는 PA Price Action Indicator입니다. 고급 필터를 장착하여 잡음과 거짓 신호를 제거하고 거래 잠재력을 높이는 데 도움이 됩니다. 복잡한 지표의 다중 레이어를 사용하여 Atomic Analyst는 차트를 스캔하고 복잡한 수학적 계산을 간단한 신호와 색상으로 변환하여 초보 트레이더가 이해하고 일관된 거래 결정을 내릴 수 있도록합니다. "Atomic Analyst"는 새로운 및 경험이 풍부한 트레이더를위한 종합적인 거래 솔루션입니다. 프리미엄 지표와 최고 수준의 기능을 하나의 거래 전략에 결합하여 모든 종류의 트레이더에 대한 다재다능한 선택지가되었습니다. 인트라데이 거래 및 스캘핑 전략 : 빠르고 정확한
Atbot
Zaha Feiz
4.96 (28)
AtBot: 작동 방식 및 사용 방법 ### 작동 방식 MT5 플랫폼용 "AtBot" 지표는 기술 분석 도구의 조합을 사용하여 매수 및 매도 신호를 생성합니다. 01:37 단순 이동 평균(SMA), 지수 이동 평균(EMA), 평균 진폭 범위(ATR) 지수를 통합하여 거래 기회를 식별합니다. 또한 Heikin Ashi 캔들을 사용하여 신호의 정확성을 향상시킬 수 있습니다. 구매 후 리뷰를 남기면 특별 보너스 선물을 받게 됩니다. ### 주요 기능: - 비재표시: 신호는 플로팅 후 변경되지 않습니다. - 비재작성: 신호는 일관되며 변경되지 않습니다. - 지연 없음: 지연 없이 시기적절한 신호를 제공합니다. - 다양한 시간대: 거래 전략에 맞게 모든 시간대에서 사용할 수 있습니다. ### 운영 단계: #### 입력 및 설정: - firstkey (TrendValue): 추세 감지의 민감도를 조정합니다. - Secondkey (SignalValue): 매수/매도 신호 생성의 민감도를 정의
우선 이 거래 시스템이 리페인팅, 리드로잉 및 레이그 인디케이터가 아니라는 점을 강조하는 것이 중요합니다. 이는 수동 및 로봇 거래 모두에 이상적인 것으로 만듭니다. 온라인 강좌, 설명서 및 프리셋 다운로드. "스마트 트렌드 트레이딩 시스템 MT5"은 새로운 및 경험이 풍부한 트레이더를 위해 맞춤형으로 제작된 종합적인 거래 솔루션입니다. 10개 이상의 프리미엄 인디케이터를 결합하고 7개 이상의 견고한 거래 전략을 특징으로 하여 다양한 시장 조건에 대한 다목적 선택이 가능합니다. 트렌드 추종 전략: 효과적인 트렌드 추이를 타기 위한 정확한 진입 및 손절 관리를 제공합니다. 반전 전략: 잠재적인 트렌드 반전을 식별하여 트레이더가 범위 시장을 활용할 수 있게 합니다. 스캘핑 전략: 빠르고 정확한 데이 트레이딩 및 단기 거래를 위해 설계되었습니다. 안정성: 모든 인디케이터가 리페인팅, 리드로잉 및 레이그가 아니므로 신뢰할 수 있는 신호를 보장합니다. 맞춤화: 개별 거래 선호도를 고려한 맞춤
Gold Stuff mt5
Vasiliy Strukov
4.9 (185)
Gold Stuff mt5는 금을 위해 특별히 설계된 추세 지표이며 모든 금융 상품에서도 사용할 수 있습니다. 표시기가 다시 그려지지 않고 지연되지 않습니다. 권장 기간 H1. 설정 및 개인 보너스를 받으려면 구매 후 즉시 저에게 연락하십시오!     강력한 지원 및 트렌드 스캐너 표시기의 무료 사본을 받으실 수 있습니다. 메시지를 보내주세요. 나!   설정 화살표 그리기 - 켜기 끄기. 차트에 화살표 그리기. 경고 - 가청 경고를 끕니다. 이메일 알림 - 켜기 끄기. 이메일 알림. Puch-notification - 켜기 끄기. 푸시 알림. 다음으로 색 영역을 조정합니다. Gold Stuff mt5는 금을 위해 특별히 설계된 추세 지표이며 모든 금융 상품에서도 사용할 수 있습니다. 표시기가 다시 그려지지 않고 지연되지 않습니다. 권장 기간 H1. 설정 및 개인 보너스를 받으려면 구매 후 즉시 저에게 연락하십시오!   설정 화살표 그리기 - 켜기 끄기. 차트에
TPSproTREND PrO MT5
Roman Podpora
4.89 (9)
TPSpro TREND PRO  - is a trend indicator that automatically analyzes the market and provides information about the trend and each of its changes, as well as giving signals for entering trades without redrawing! The indicator uses each candle, analyzing them separately. referring to different impulses - up or down impulse. Exact entry points into transactions for currencies, crypto, metals, stocks, indices!  Version MT4               DETAILED DESCRIPTION               R ecommended to use with an
TPSpro RFI Levels MT5
Roman Podpora
4.67 (9)
Reversal First Impulse levels (RFI)      INSTRUCTIONS        RUS       -       ENG              R ecommended to use with an indicator   -   TPSpro  TREND PRO -  Version MT4                 A key element in trading is zones or levels from which decisions to buy or sell a trading instrument are made. Despite attempts by major players to conceal their presence in the market, they inevitably leave traces. Our task was to learn how to identify these traces and interpret them correctly. Main functi
Entry Points Pro for MT5
Yury Orlov
4.56 (163)
다시 색을 칠하지 않고 거래에 진입할 수 있는 정확한 신호를 제공하는 MT5용 지표입니다. 외환, 암호화폐, 금속, 주식, 지수 등 모든 금융 자산에 적용할 수 있습니다. 매우 정확한 추정값을 제공하고 매수와 매도의 가장 좋은 시점을 알려줍니다. 하나의 시그널로 수익을 내는 지표의 예와 함께 비디오 (6:22)시청하십시오! 대부분의 거래자는 Entry Points Pro 지표의 도움으로 첫 거래 주 동안 트레이딩 결과를 개선합니다. 저희의   Telegram Group 을 구독하세요! Entry Points Pro 지표의 좋은점. 재도색이 없는 진입 신호 신호가 나타나고 확인되면(시그널 캔들이 완성된 경우) 신호는 더 이상 사라지지 않습니다. 여타 보조지표의 경우 신호를 표시한 다음 제거되기 때문에 큰 재정적 손실로 이어집니다. 오류 없는 거래 게시 알고리즘을 통해 트레이드(진입 또는 청산)를 할 이상적인 순간을 찾을 수 있으며, 이를 통해 이를 사용하는 모든 거래자의
우선적으로, 이 거래 도구는 전문적인 거래에 이상적인 비-다시 그리기 및 지연되지 않는 지표입니다.  온라인 강좌, 사용자 매뉴얼 및 데모. 스마트 가격 액션 컨셉트 인디케이터는 신규 및 경험 많은 트레이더 모두에게 매우 강력한 도구입니다. Inner Circle Trader Analysis 및 Smart Money Concepts Trading Strategies와 같은 고급 거래 아이디어를 결합하여 20가지 이상의 유용한 지표를 하나로 결합합니다. 이 인디케이터는 스마트 머니 컨셉트에 중점을 두어 대형 기관의 거래 방식을 제공하고 이동을 예측하는 데 도움을 줍니다.  특히 유동성 분석에 뛰어나 기관이 어떻게 거래하는지 이해하는 데 도움을 줍니다. 시장 트렌드를 예측하고 가격 변동을 신중하게 분석하는 데 탁월합니다. 귀하의 거래를 기관 전략에 맞추어 시장의 동향에 대해 더 정확한 예측을 할 수 있습니다. 이 인디케이터는 시장 구조를 분석하고 중요한 주문 블록을 식별하
Quantum Trend Sniper
Bogdan Ion Puscasu
4.92 (48)
소개       Quantum Trend Sniper Indicator는   추세 반전을 식별하고 거래하는 방식을 변화시키는 획기적인 MQL5 지표입니다! 13년 이상의 거래 경험을 가진 숙련된 트레이더 팀이 개발한       Quantum Trend Sniper 표시기       매우 높은 정확도로 추세 반전을 식별하는 혁신적인 방법으로 거래 여정을 새로운 차원으로 끌어올리도록 설계되었습니다. ***Quantum Trend Sniper Indicator를 구입하면 Quantum Breakout Indicator를 무료로 받을 수 있습니다!*** Quantum Trend Sniper Indicator는 추세 반전을 식별하고 세 가지 이익실현 수준을 제안할 때 경고, 신호 화살표를 제공합니다. 초보자 거래자와 전문 거래자 모두에게 적합합니다. Quantum EA 채널:       여기를 클릭하세요 MT4 버전:       여기를 클릭하세요
Trend Screener Pro MT5
STE S.S.COMPANY
4.88 (67)
트렌드 표시기, 트렌드 트레이딩 및 필터링을 위한 획기적인 고유 솔루션, 하나의 도구 안에 내장된 모든 중요한 트렌드 기능! Forex, 상품, 암호 화폐, 지수 및 주식과 같은 모든 기호/도구에 사용할 수 있는 100% 다시 칠하지 않는 다중 시간 프레임 및 다중 통화 표시기입니다. Trend Screener는 차트에 점이 있는 화살표 추세 신호를 제공하는 효율적인 지표 추세 추종 지표입니다. 추세 분석기 표시기에서 사용할 수 있는 기능: 1. 트렌드 스캐너. 2. 최대 이익 분석이 있는 추세선. 3. 추세 통화 강도 측정기. 4. 경고가 있는 추세 반전 점. 5. 경고가 있는 강력한 추세 점. 6. 추세 화살표 Trend Screener Indicator가 있는 일일 분석 예, 일일 신호 성능...등은 여기에서 찾을 수 있습니다. 여기를 클릭하십시오. LIMITED TIME OFFER : Trend Screener Indicator는 50$ 및 평생 동안만 사용할 수 있습니다
FX Power MT5 NG
Daniel Stein
5 (6)
모닝 브리핑 여기 mql5 와 텔레그램에서 FX Power MT5 NG 는 오랫동안 인기 있는 통화 강도 측정기인 FX Power의 차세대 버전입니다. 이 차세대 강도 측정기는 무엇을 제공합니까? 기존 FX Power에서 좋아했던 모든 것 PLUS GOLD/XAU 강도 분석 더욱 정밀한 계산 결과 개별 구성 가능한 분석 기간 더 나은 성능을 위한 사용자 정의 가능한 계산 한도 특별 멀티더 많은 것을보고 싶은 사람들을위한 특별한 다중 인스턴스 설정 모든 차트에서 좋아하는 색상을위한 끝없는 그래픽 설정 수많은 알림 옵션, 중요한 것을 다시는 놓치지 않도록 Windows 11 및 macOS 스타일의 둥근 모서리가 있는 새로운 디자인 마법처럼 움직이는 인디케이터 패널 FX 파워 키 특징 모든 주요 통화의 완전한 강세 이력 모든 시간대에 걸친 통화 강세 이력 모든 브로커 및 차트에서 고유 계산 결과 100% 신뢰할 수있는 실시간100 % 신뢰할 수있는 실시간 계산-> 다시 칠하지 않음
FX Volume MT5
Daniel Stein
4.94 (17)
모닝 브리핑을 통해 세부 정보와 스크린샷으로 매일 시장 업데이트를 받으세요 여기 mql5 및 텔레그램에서 FX 거래량은 브로커의 관점에서 시장 심리에 대한 실제 통찰력을 제공하는 최초이자 유일한 거래량 지표입니다. 브로커와 같은 기관 시장 참여자가 외환 시장에서 어떤 포지션을 취하고 있는지에 대한 훌륭한 통찰력을 COT 보고서보다 훨씬 빠르게 제공합니다. 차트에서 이 정보를 직접 확인하는 것은 트레이딩의 진정한 판도를 바꾸고 획기적인 솔루션입니다. 다음과 같은 고유한 시장 데이터 인사이트의 이점 비율 는 통화의 매수/매도 포지션 비율을 백분율로 표시 비율 변화 는 선택한 기간 내 매수 비율과 비율 변화를 표시 총 거래량 는 해당 통화의 총 거래량(롱 및 숏)을 로트 단위로 보여줍니다 Volumes Long 는 해당 통화의 모든 롱 포지션의 거래량을 보여줍니다 Volumes Short 는 해당 통화의 모든 숏 포지션의 거래량을 보여줍니다 Net Long 는 순 롱 포지션의 거래량
IX Power MT5
Daniel Stein
4.17 (6)
IX Power는   마침내 FX Power의 탁월한 정밀도를 외환이 아닌 기호에도 적용했습니다. 좋아하는 지수, 주식, 원자재, ETF, 심지어 암호화폐까지 단기, 중기, 장기 추세의 강도를 정확하게 파악할 수 있습니다. 단말기가 제공하는   모든 것을 분석할   수 있습니다. 사용해 보고 트레이딩   타이밍이 크게 향상되는   것을 경험해 보세요. IX Power 주요 특징 단말기에서 사용 가능한 모든 거래 심볼에 대해 100% 정확한 비재도장 계산 결과 제공 사전 구성 및 추가적으로 개별 구성 가능한 강도 분석 기간의 드롭다운 선택 가능 이메일, 메시지, 모바일 알림을 통한 다양한 알림 옵션 제공 EA 요청을 위한 액세스 가능한 버퍼 더 나은 성능을 위한 사용자 지정 가능한 계산 한도 더 많은 것을 보고 싶은 사용자를 위한 특별 다중 인스턴스 설정 모든 차트에서 좋아하는 색상을 위한 무한한 그래픽 설정 가능 Windows 11 및 macOS 스타일의 둥
XQ Indicator MetaTrader 5
Marzena Maria Szmit
3.5 (2)
Step into the realm of Forex trading with confidence and precision using XQ, a cutting-edge Forex indicator designed to elevate your trading game to unprecedented heights. Whether you're a seasoned trader or just stepping into the world of currency exchange, XQ Forex Indicator empowers you with the insights and signals needed to make informed trading decisions. The signal conditions are a combination of three indicators, and XQ Forex Indicator only display  medium and long-term trends . The ind
Easy Buy Sell Signal Alert
Franck Martin
4.86 (7)
Easy By Sell is a market indicator for opening and closing positions. It becomes easy to track market entries with alerts. It indicates trend reversal points when a price reaches extreme values ​​and the most favorable time to enter the market. it is as effective as a Fibonacci to find a level but it uses different tools such as an algorithm based on ATR indicators and Stochastic Oscillator. You can modify these two parameters as you wish to adapt the settings to the desired period. My othe
이 대시보드는 선택한 심볼에 대해 사용 가능한 최신 고조파 패턴을 표시하므로 시간을 절약하고 더 효율적으로 사용할 수 있습니다 /   MT4 버전 . 무료 인디케이터:   Basic Harmonic Pattern 인디케이터 열 Symbol :   선택한 심볼이 나타납니다 Trend :   강세 또는 약세 Pattern :   패턴 유형(가틀리, 나비, 박쥐, 게, 상어, 사이퍼 또는 ABCD) Entry :   진입 가격 SL:   스톱로스 가격 TP1:   1차 테이크프로핏 가격 TP2:   2차 테이크프로핏 가격 TP3:   3차 테이크프로핏 가격 Current price:   현재 가격 Age (in bars):   마지막으로 그려진 패턴의 나이 주요 입력 Symbols :   "28개 주요 통화쌍" 또는 "선택한 심볼" 중에서 선택합니다. Selected Symbols :   쉼표로 구분하여 모니터링하려는 원하는 심볼("EURUSD,GBPUSD,XAUUSD")
TrendMaestro5
Stefano Frisetti
note: this indicator is for METATRADER4, if you want the version for METATRADER5 this is the link:  https://www.mql5.com/it/market/product/108106 TRENDMAESTRO ver 2.4 TRENDMAESTRO recognizes a new TREND in the bud, he never makes mistakes. The certainty of identifying a new TREND is priceless. DESCRIPTION TRENDMAESTRO identifies a new TREND in the bud, this indicator examines the volatility, volumes and momentum to identify the moment in which there is an explosion of one or more of these data a
Golden Spikes Premium
Kwaku Bondzie Ghartey
Golden Spikes Detector Overview: The Golden Spikes Premium is a groundbreaking trading indicator meticulously crafted for the Boom and Crash indices on the Deriv market. Tailored to meet the needs of discerning traders, this powerful tool operates exclusively on the one-minute timeframe, providing timely and precise signals to maximize your trading potential. The Golden Spikes Detector stands out in its ability to deliver accurate signals, ensuring that you capitalize on market opportunities wit
Gartley Hunter Multi
Siarhei Vashchylka
5 (8)
Gartley Hunter Multi - An indicator for searching for harmonic patterns simultaneously on dozens of trading instruments and on all possible timeframes. Manual (Be sure to read before purchasing) | Version for MT4 Advantages 1. Patterns: Gartley, Butterfly, Shark, Crab. Bat, Alternate Bat, Deep Crab, Cypher 2. Simultaneous search for patterns on dozens of trading instruments and on all possible timeframes 3. Search for patterns of all possible sizes. From the smallest to the largest 4. A
PZ Support Resistance MT5
PZ TRADING SLU
4.17 (6)
Unlock key market insights with automated support and resistance lines Special Offer: Purchase now to receive free bonuses worth $89! (Read more for details) Tired of plotting support and resistance lines? This is a multi-timeframe indicator that detects and plots supports and resistance lines in the chart with the same precision as a human eye would. As price levels are tested over time and its importance increases, the lines become thicker and darker, making price leves easy to glance and ev
Matrix Arrow Indicator MT5
Juvenille Emperor Limited
5 (14)
매트릭스 화살표 표시기 MT5 는 외환, 상품, 암호 화폐, 지수, 주식과 같은 모든 기호/도구에 사용할 수 있는 100% 다시 칠하지 않는 다중 기간 표시기를 따르는 고유한 10 in 1 추세입니다.  Matrix Arrow Indicator MT5 는 다음과 같은 최대 10개의 표준 지표에서 정보와 데이터를 수집하여 초기 단계에서 현재 추세를 결정합니다. 평균 방향 이동 지수(ADX) 상품 채널 지수(CCI) 클래식 하이켄 아시 캔들 이동 평균 이동 평균 수렴 발산(MACD) 상대 활력 지수(RVI) 상대 강도 지수(RSI) 포물선 SAR 스토캐스틱 오실레이터 윌리엄스의 백분율 범위 모든 지표가 유효한 매수 또는 매도 신호를 제공하면 강력한 상승/하락 추세를 나타내는 다음 캔들/막대가 시작될 때 해당 화살표가 차트에 인쇄됩니다. 사용자는 사용할 표시기를 선택하고 각 표시기의 매개변수를 개별적으로 조정할 수 있습니다. 매트릭스 화살표 표시기 MT5는 선택한 표시기에서만 정보를 수
Volume by Price MT5
Brian Collard
3.6 (5)
The Volumebyprice.com Indicator for MetaTrader 5 features Volume Profile and Market Profile TPO (Time Price Opportunity). Volume and TPO histogram bar and line charts. Volume Footprint charts. TPO letter and block marker collapsed and split structure charts. Static, dynamic and flexible range segmentation and compositing methods with relative and absolute visualizations. Session hours filtering and segment concatenation with Market Watch and custom user specifications. Graphical layering, posit
ICT, SMC, SMART MONEY CONCEPTS, SMART MONEY, Smart Money Concept, Support and Resistance, Trend Analysis, Price Action, Market Structure, Order Blocks, BOS/CHoCH,   Breaker Blocks ,  Momentum Shift,   Supply&Demand Zone/Order Blocks , Strong Imbalance,   HH/LL/HL/LH,    Fair Value Gap, FVG,  Premium  &   Discount   Zones, Fibonacci Retracement, OTE, Buy Side Liquidity, Sell Side Liquidity, BSL/SSL Taken, Equal Highs & Lows, MTF Dashboard, Multiple Time Frame, BigBar, HTF OB, HTF Market Structure
Volatility Trend System - a trading system that gives signals for entries. The volatility system gives linear and point signals in the direction of the trend, as well as signals to exit it, without redrawing and delays. The trend indicator monitors the direction of the medium-term trend, shows the direction and its change. The signal indicator is based on changes in volatility and shows market entries. The indicator is equipped with several types of alerts. Can be applied to various trading in
Blahtech Supply Demand MT5
Blahtech Limited
4.54 (13)
Was: $299  Now: $99   Supply Demand uses previous price action to identify potential imbalances between buyers and sellers. The key is to identify the better odds zones, not just the untouched ones. Blahtech Supply Demand indicator delivers functionality previously unavailable on any trading platform. This 4-in-1 indicator not only highlights the higher probability zones using a multi-criteria strength engine, but also combines it with multi-timeframe trend analysis, previously confirmed swings
금 TMAF MTF - 최고의 주식 기술 지표입니다. 지표 알고리즘은 자산의 가격 움직임을 분석하고 변동성과 잠재적 진입 구간을 반영합니다. 최고의 지표 신호입니다: - 매도 = TMA1의 빨간색 상한선 위의 TMA2의 빨간색 상한선 + 위의 빨간색 프랙탈 인디케이터 + 같은 방향의 노란색 SR 신호 화살표. - 매수 = TMA2의 파란색 하한선 아래 TMA1의 파란색 하한선 + 아래에서 파란색 프랙탈 표시기 + 같은 방향의 아쿠아 SR 신호 화살표. 인디케이터의 장점 1. 이 인디케이터는 높은 정확도로 신호를 생성합니다. 2. 확인 된 화살표 신호는 다시 그려지지 않으며 프랙탈 신호는 절반 기간 동안 다시 그릴 수 있습니다. 3. 모든 브로커의 메타트레이더 5 거래 플랫폼에서 거래할 수 있습니다. 4. 모든 자산(통화, 금속, 암호화폐, 주식, 지수 등)을 거래할 수 있습니다. 5. M30-H1 차트주기(중기 트레이딩)에서 거래하는 것이 좋습니다. 6
Automated Trendlines MT5
Georgios Kalomoiropoulos
추세선은 외환 거래에서 기술적 분석의 가장 필수적인 도구입니다. 불행히도, 대부분의 거래자는 올바르게 그리지 않습니다. 자동 추세선 표시기는 시장의 추세 움직임을 시각화하는 데 도움이 되는 진지한 거래자를 위한 전문 도구입니다. 추세선 강세 추세선과 약세 추세선에는 두 가지 유형이 있습니다. 상승 추세에서 Forex 추세선은 가격 움직임의 가장 낮은 스윙 포인트를 통해 그려집니다. 최소 두 개의 "최저 저점"을 연결하면 추세선이 생성됩니다. 하락 추세에서 추세선은 가격 움직임의 가장 높은 스윙 포인트를 통해 그려집니다. 최소 두 개의 "최고 최고점"을 연결하면 추세선이 생성됩니다. 추세선이 깨질 때? 강세 추세선은 약세 양초가 강세 추세선 아래에서 닫히고 양초의 고점이 추세선 위에 있을 때 깨집니다. 약세 추세선은 강세 양초가 약세 추세선 위로 마감되고 양초 저점이 추세선 아래에 있을 때 깨집니다. 추세선이 삭제되면? 강세 추
TPA True Price Action indicator reveals the true price action of the market makers through 100% non-repainting signals strictly at the close of a candle! TPA shows entries and re-entries, every time the bulls are definitely stronger than the bears and vice versa. Not to confuse with red/green candles. The shift of power gets confirmed at the earliest stage and is ONE exit strategy of several. There are available now two free parts of the TPA User Guide for our customers. The first "The Basics"
The 1 2 3 Pattern Scanner MT5
Reza Aghajanpour
5 (16)
** All Symbols x All Timeframes scan just by pressing scanner button ** ***Contact me after purchase to send you instructions and add you in "123 scanner group" for sharing or seeing experiences with other users. After 17 years of experience in the markets and programming, Winner indicator is ready. I would like to share with you! Introduction The 123 Pattern Scanner indicator with a special enhanced algorithm is a very repetitive common pattern finder with a high success rate . Interestingly,
Auto Order Block with break of structure based on ICT and Smart Money Concepts (SMC) Futures Break of Structure ( BoS )             Order block ( OB )            Higher time frame Order block / Point of Interest ( POI )    shown on current chart           Fair value Gap ( FVG ) / Imbalance   -  MTF      ( Multi Time Frame )    HH/LL/HL/LH  -  MTF      ( Multi Time Frame )  Choch  MTF      ( Multi Time Frame )  Volume Imbalance     ,  MTF          vIMB Gap’s Power of 3 Equal High
제작자의 제품 더 보기
AI Channel
Thalles Nascimento De Carvalho
4 (4)
Welcome to the presentation of the AI Channel indicator, a powerful tool that uses artificial intelligence for price channel analysis in the financial market. In this session, we will explore how this revolutionary indicator can assist investors and traders in making more informed and strategic decisions. Let's get started! I. What is the AI Channel indicator? AI Channel is an indicator developed based on advanced artificial intelligence algorithms. It utilizes historical price data of financial
FREE
Master OBV FX
Thalles Nascimento De Carvalho
5 (1)
MasterOBV: 시장 트렌드를 정확하게 파악하세요! MasterOBV 는 거래량 , 긍정적 상관관계 및 **이동 평균선(MA)**을 결합한 기술 분석 지표 로, 금융 시장에서 트렌드를 식별하는 능력을 향상시킵니다. 주요 기능: 스마트 거래량: 거래량을 분석하여 트렌드 강도의 중요한 변화를 식별합니다. 긍정적 상관관계: 상관된 자산을 포함하여 보다 넓고 정확한 시각을 제공하며, 쌍의 거래량을 기반으로 가격 이동 잠재력을 강화합니다. 비주얼 채널: 비주얼 채널을 사용하여 트렌드의 지속성과 반전 가능성을 명확하고 정확하게 평가하며 직관적인 시각 분석을 제공합니다. 스무딩 이동 평균선: MA는 가격의 변동을 부드럽게 하여 기본 트렌드 방향을 더 쉽게 식별할 수 있게 합니다. 왜 MasterOBV를 선택해야 하는가? 결정에 대한 자신감: 여러 요소를 통합하여 신뢰를 가지고 진입 및 퇴출 결정을 내릴 수 있도록 도와줍니다. 종합 분석: 가격뿐만
FREE
Long Short
Thalles Nascimento De Carvalho
4.67 (3)
롱 & 숏 인디케이터: 시장 동향 분석을 위한 궁극의 도구 실시간 정보로 높은 적중률 자산의 움직임을 높은 정확도로 추적하고 최신 데이터에 기반하여 의사 결정을 내립니다. ️ 더 안전한 거래 진입 양수 및 음수 상관관계를 활용하여 더 안전하고 정보에 기반한 거래 진입을 실현합니다. 단기 및 장기 분석 용이 단기 및 장기 전략 모두에 적합하며, 거래 요구에 맞게 조정 가능합니다. 특정 수준에 대한 알림 옵션 알림을 활성화하여 중요한 수준을 면밀히 모니터링하고, 중요한 시장 기회를 놓치지 않도록 합니다. EA (전문가 어드바이저) 세부 정보 ️ 버퍼 심볼 1ª = 0 : 첫 번째 심볼의 데이터. 버퍼 심볼 2ª = 2 : 두 번째 심볼의 데이터. 무료 버전 : EUR/USD만 사용 가능. 롱 & 숏 인디케이터를 선택해야 하는 이유 고급 상관관계 : 자산 간의 정확한 상관관계를 기반으로 시장 움직임을 식별합니다. 정보에 기반한 결정
FREE
Swing Point Volume
Thalles Nascimento De Carvalho
Swing Point Volume, the indicator that signals weakness and strength at the tops and bottoms. This indicador can be for used the Wyckoff Method. Information provided; - Swing on customized ticks. - Volume and points in each balance sheet. - Percentage of Displacement. - Sound alert option on top and bottom breaks. - Volume in ticks and Real Volume. - Volume HL (extreme) or (opening and closing) - Customized volume shapes.
Atr Projection
Thalles Nascimento De Carvalho
ATR 프로젝션 지표는 금융 시장에서 가격 움직임의 잠재적 한계에 대한 정확한 통찰을 제공하도록 설계된 강력한 도구로, 기술적 분석에서 두드러지고 있습니다. 유연한 접근 방식으로 사용자는 각 거래 자산의 특정한 요구에 맞게 분석 메트릭스를 직관적으로 사용자 정의할 수 있습니다. 사용자 정의 가능한 운영: 기본 설정으로 ATR 프로젝션은 최근 100개의 캔들의 평균 중 30%를 고려하여 작동합니다. 이러한 유연성은 사용자가 각 자산의 특징과 선호도에 따라 메트릭스를 조정할 수 있도록 하여 더 개인화된 분석을 제공합니다. 30%와 100개 캔들의 선택에 대한 논리: 선택된 백분율과 캔들 수의 신중한 선택은 최근의 중요한 움직임을 포착하여 더 정확한 예측을 제공하려는 것입니다. 이 전략적 접근은 가격이 이동할 가능성이 높은 지역을 강조하여 트레이더에게 더 잘 통찰력을 제공합니다. ATR 프로젝션의 이점: 1. 사용자 정의 가능한 기술적 정확성: 사용자는 각
Box Weis Wave
Thalles Nascimento De Carvalho
5 (1)
Weis Wave Box로 분석을 한 단계 끌어올리세요! 정확성과 명확성을 추구하는 트레이더라면, Weis Wave Box 가 필요한 도구입니다. 이 고급 지표는 볼륨 파동과 스윙 포인트에 대한 상세한 시각적 분석을 제공하여 시장에서 노력과 결과 간의 관계를 더 잘 이해하는 데 도움을 줍니다. Weis Wave Box의 주요 기능: 사용자 맞춤형 볼륨 파동: 거래 전략에 맞게 티크 단위로 볼륨 파동을 조정할 수 있습니다. 조정 가능한 이력: 특정 시간 기간에 초점을 맞춰 더 정확하고 관련성 있는 분석을 수행할 수 있습니다. 티크 vs. 실제 볼륨: 티크와 실제 볼륨을 명확히 구분하여 시장에 대한 더 포괄적인 시각을 제공합니다. 상단 박스 시각화: 볼륨(에너지)이 가장 높은 곳과 가격 이동이 적었던 곳을 명확히 시각화합니다. 이 시각화는 노력과 결과 간의 관계를 파악하는 데 도움이 되며, 어떤 힘이 지배적인지 강조하고 잠재적인 가격 변동을 예측할 수 있습
Long Short Pro
Thalles Nascimento De Carvalho
Long & Short 지표 - Pro 버전: 무한한 시장 분석 잠재력을 열어보세요! 모든 자산에 제한 없이 사용 Long & Short 지표의 Pro 버전은 모든 금융 자산에서 완전한 자유를 제공합니다. 이제 제한 없이 동일한 지표를 모든 선호 자산에 적용할 수 있습니다! 제한 없음 지표의 모든 기능을 제한 없이 사용하세요. Pro 버전은 완전하고 무제한의 경험을 제공하며, 모든 시장 기회를 최대한 활용할 수 있게 해줍니다. Pro 버전의 특징 무제한 접근 : 모든 금융 자산에서 지표를 사용하고 그 잠재력을 최대한 발휘하세요. 고급 정밀도 : 상세한 분석과 명확한 신호를 통해 정보에 기반한 안전한 결정을 내리세요. 완전한 유연성 : 자산이나 전략에 관계없이 거래 요구에 맞게 지표를 조정하세요. 중요한 기회에 대한 알림 받기 알림을 활성화하여 중요한 수준을 주의 깊게 모니터링하고 시장 기회에서 항상 앞서 나가세요. EA 구축을 위한 버퍼 파라
Reversal Vol Propagation
Thalles Nascimento De Carvalho
Are you tired of missing out on trading opportunities by not being able to identify price reversals in time? Do you want to maximize your profits and make informed trading decisions? Introducing the Reversal Vol Propagation Indicator, the revolutionary tool that uses neural networks and volume data to predict potential price reversals. Based on a powerful combination of advanced algorithms and cutting-edge technology, the Reversal Vol Propagation meticulously analyzes volume patterns and past pr
Didi Index Volume
Thalles Nascimento De Carvalho
디디 지수 볼륨(Didi Index Volume)을 소개합니다. 이는 브라질 트레이더 오디르 아기아르(Odir Aguiar)이 개발한 기술적 분석 지표로, 금융 시장에서 기회를 식별하는 고급이고 강력한 접근 방식으로 주목받고 있습니다. 다양한 플랫폼에서 이용 가능한 디디 지수 볼륨은 정확한 통찰력과 가치 있는 정보를 찾는 트레이더들에게 필수적인 도구가 되었습니다. 이 지표는 오디르 아기아르가 개발한 유명한 디디 지수(Didi Index)와 거래량의 지능적인 활용을 결합합니다. 이 조합은 가격 동작과 거래량의 상호작용을 더 깊게 분석하여 자산의 움직임에 대한 독특한 시각을 제공합니다. 정교한 알고리즘과 가중 평균 계산을 통해 디디 지수 볼륨은 거래량을 기반으로 가격 변동을 예측할 수 있습니다. 이 기능은 신흥 트렌드, 시장 반전 및 적시적인 진입 및 청산 시점을 파악하는 데 매우 중요합니다. 디디 지수 볼륨을 사용하면 정확한 시장 해석을 돕고 허무맹랑한 결정을 피할 수
Smart Binary Volume
Thalles Nascimento De Carvalho
스마트 바이너리 볼륨 인디케이터는 거래량 분석과 머신 러닝을 결합한 다목적 도구입니다. 스캘핑과 같은 단기 거래를 포함하여 다양한 시장과 전략에 적용할 수 있습니다. 고급 머신 러닝 알고리즘을 사용하여 이 인디케이터는 복잡한 패턴을 인식하고 더 정확한 매수 및 매도 신호를 생성합니다. Buffer to Create EA. Buffer Line Gold = 0. Buffer Line Red = 2 Buffer   AI  =  3 AI Buffer  >=  0  ("SIGNAL BUY") AI Buffer  <=  0  ("SIGNAL SELL") 사용 팁: 1. 대비되는 선들에 주의하십시오: Smart Binary Volume 지표의 선들이 대비되는 움직임을 보이는 상황에 주목하십시오. 이러한 조건은 진입 신호를 나타낼 수 있습니다. 2. 상승 신호: 파란색 라인이 0.30보다 높고 빨간색 라인이 -0.30 아래에 위치하는 경우 주의하세요. 이러한 설정은 상승
TimeChannel
Thalles Nascimento De Carvalho
The "Timechannel" is a powerful technical analysis tool designed specifically for traders who want to gain deeper and more accurate insights into price movements across multiple timeframes (multi-timeframe). This indicator is an essential addition to the toolbox of any serious trader seeking to make informed and data-driven trading decisions. Key Features: Advanced Multi-Timeframe Analysis : Timechannel allows traders to analyze price movements on different timeframes simultaneously. This is cr
DeltaBook
Thalles Nascimento De Carvalho
델타 북(Delta Book) 지표는 주식, 선물 및 암호화폐와 같은 금융 시장에서 가격 흐름을 감지하기 위해 볼륨 델타와 오더북(order book) 정보를 결합하는 강력한 시장 분석 도구입니다. 델타 북은 그 최대 잠재력을 실현하기 위해 실시간 볼륨 데이터와 오더북 정보에 액세스해야 한다는 점을 주목해야 합니다. 델타 북의 주요 특징은 시장 참가자의 행동에 대한 상세한 정보를 기반으로 트렌드와 거래 기회를 식별할 수 있는 고급 시장 분석 전략입니다. 델타 북 지표를 설명하기 위한 몇 가지 팁과 중요한 측면은 다음과 같습니다: 볼륨 델타: 볼륨 델타는 특정 시간 내에 매수(수요)와 매도(공급)된 볼륨의 차이입니다. 이 지표는 매수자와 매도자 간의 불균형을 양적으로 나타내며 시장에서 매수 및 매도 압력의 변화를 식별하는 데 도움을 줍니다. 오더북: 오더북은 시장에서 모든 매수 및 매도 주문의 실시간 레코드입니다. 이것은 트레이더들이 자산을 구매하고 판매하려는 가격 및 해당 가격에서
Big Player Range
Thalles Nascimento De Carvalho
5 (2)
"BigPlayerRange"의 힘을 발견하세요: 시장 기술 분석에서 당신의 동맹 BigPlayerRange 를 소개합니다. 이 고급 기술 분석 도구는 시장에서 기관 투자자들의 관심 영역을 드러내기 위해 설계되었습니다. 이 도구를 사용하면 주요 시장 참여자들이 어디에서 활발히 활동하고 있는지를 정확히 식별하고, 이로 인해 거래 전략에 어떤 영향을 미칠 수 있는지를 이해할 수 있습니다. 주요 특징: 기관 투자자의 관심 영역 매핑 : BigPlayerRange 는 기관 투자자들이 활발히 활동하는 구역을 강조하여 시장의 잠재적인 움직임에 대한 귀중한 통찰을 제공합니다. 출구 참조를 위한 예측 : 이 지표는 두 단계에서 가능한 출구를 제안하는 예측을 활용하여, 미래 가격 동향을 기반으로 전략을 계획하는 데 도움을 줍니다. 되돌림 확률 : 가격이 식별된 범위로 돌아올 때의 되돌림 확률을 평가합니다. 이 기능은 리스크 관리를 돕고 전략을 조정하는 데 유용합니다. BigPla
Master OBV
Thalles Nascimento De Carvalho
MasterOBV: 시장 트렌드를 정확하게 파악하세요! MasterOBV 는 거래량 , 긍정적 상관관계 및 **이동 평균선(MA)**을 결합한 기술 분석 지표 로, 금융 시장에서 트렌드를 식별하는 능력을 향상시킵니다. 주요 기능: 스마트 거래량: 거래량을 분석하여 트렌드 강도의 중요한 변화를 식별합니다. 긍정적 상관관계: 상관된 자산을 포함하여 보다 넓고 정확한 시각을 제공하며, 쌍의 거래량을 기반으로 가격 이동 잠재력을 강화합니다. 비주얼 채널: 비주얼 채널을 사용하여 트렌드의 지속성과 반전 가능성을 명확하고 정확하게 평가하며 직관적인 시각 분석을 제공합니다. 스무딩 이동 평균선: MA는 가격의 변동을 부드럽게 하여 기본 트렌드 방향을 더 쉽게 식별할 수 있게 합니다. 왜 MasterOBV를 선택해야 하는가? 결정에 대한 자신감: 여러 요소를 통합하여 신뢰를 가지고 진입 및 퇴출 결정을 내릴 수 있도록 도와줍니다. 종합 분석: 가격뿐만
Smart Delta Volume
Thalles Nascimento De Carvalho
Smart Delta Volume: 동적인 시장 상황에 맞춘 정밀하고 적응 가능한 도구 Smart Delta Volume 은 끊임없이 변화하는 시장 환경에서 정밀하고 적응 가능한 분석을 제공하기 위해 설계된 고급 기술 지표입니다. 이 지표는 시장의 변동성에 따라 자동으로 조정되는 동적 레벨을 활용하여 거래량 흐름과 가격 움직임 간의 상호작용에 대한 보다 포괄적이고 신뢰할 수 있는 관점을 제공합니다. 이러한 적응력은 특히 변동성이 큰 시장에서 빠르고 정확한 인사이트를 찾는 트레이더에게 매우 중요합니다. 객관적인 되돌림 검증: 잘못된 신호를 줄이고 신뢰성을 높이는 방법 Smart Delta Volume 의 가장 강력한 기능 중 하나는 되돌림 검증기입니다. 이 기능은 가격이 두 개의 동적 레벨을 넘을 때 자동으로 작동하여 되돌림의 유효성을 확인합니다. 이러한 객관적인 검증은 위험을 최소화하고 잘못된 신호를 피하려는 트레이더에게 필수적입니다. 되돌림을 검증함으로써 이 지표는 식별
VolaMetrics VSA
Thalles Nascimento De Carvalho
VolaMetrics VSA | 기술 분석의 강력한 동반자 VolaMetrics VSA 는 Volume Spread Analysis (VSA) 방법론과 자세한 거래량 분석 을 결합한 기술 분석 지표입니다. 중요한 가격 변동 을 식별 하고 추적 하기 위해 설계된 이 도구는 거래량 과 가격 스프레드 의 상호작용을 활용하여 트레이딩 결정에 도움이 되는 귀중한 통찰을 제공합니다. Volume Spread Analysis (VSA)의 기초 **Volume Spread Analysis (VSA)**는 기술 분석에서 존경받는 방법으로, 거래량 , 가격 스프레드 및 종가 간의 관계를 특정 기간 내에 이해하는 데 중점을 둡니다. 가장 정보가 풍부한 운영자 ( 스마트 머니 )가 가격 움직임에 영향을 미친다는 개념에 기반하여, VSA는 축적 또는 분배 신호 를 식별하고 가격의 중요한 변화를 예측합니다. VolaMetrics VSA의 작동 원리 ️ VolaMetrics VSA 는 전통적인 V
SwingVolumePro
Thalles Nascimento De Carvalho
개요 SwingVolumePro 는 다양한 금융 자산에 적용할 수 있도록 설계된 고급 다목적 지표입니다. 엄격한 거래량과 가격 분석을 기반으로 개발되었으며, 모든 수준의 트레이더가 고품질 데이터에 기반하여 정보에 입각한 결정을 내릴 수 있도록 명확하고 정확한 신호를 제공합니다. 주요 특징 다재다능성: SwingVolumePro는 주식, 외환, 암호화폐 등 다양한 자산에 적용할 수 있습니다. 스캘핑에서 장기 포지션까지 다양한 거래 전략에 적합합니다. 정확하고 신뢰할 수 있는 신호: SwingVolumePro는 가격 흡수 패턴과 시장 공격을 식별하기 위해 복잡한 기술을 사용하여 높은 정확도의 신호를 제공합니다. 이러한 신호는 명확하게 표시되어 신속하고 효과적인 의사 결정을 돕습니다. 고급 거래량 및 가격 분석: 이 지표는 거래량과 가격 간의 상호 작용을 상세히 분석하여 노력과 결과 간의 불일치를 감지하고, 잠재적인 시장 움직임을 시사합니다. 해석 용이성:
CVD SmoothFlow Pro
Thalles Nascimento De Carvalho
CVD SmoothFlow Pro - 모든 자산에 대한 무제한 볼륨 분석! CVD SmoothFlow Pro 는 정밀하고 무제한의 볼륨 분석을 원하는 트레이더를 위한 최적의 솔루션입니다. Cumulative Volume Delta (CVD) 계산과 고급 노이즈 필터링을 활용하여, Pro 버전은 모든 금융 자산 거래에 필요한 유연성과 정확성을 제공합니다. CVD SmoothFlow Pro가 제공하는 기능: 명확한 분석 : 시장 노이즈를 필터링하고 모든 금융 자산에서 중요한 볼륨 변동을 강조합니다. ️ 정확한 계산 : 매수와 매도 차이를 모니터링하여 외환, 지수, 암호화폐 등 자산의 볼륨 행동을 상세히 제공합니다. 직관적인 인터페이스 : 데이터가 명확하게 제시되어 분석이 쉽고 효율적입니다. 트렌드 식별 : 시장 트렌드를 자신 있게 식별하여 정보에 기반한 결정을 지원합니다. 실용적인 적용: 모든 자산의 실시간 매수자와 매도자 균형을 모니터링합니다. 볼륨을 기반
필터:
리뷰 없음
리뷰 답변