• Übersicht
  • Bewertungen
  • Diskussion

VolaMetrics VSA

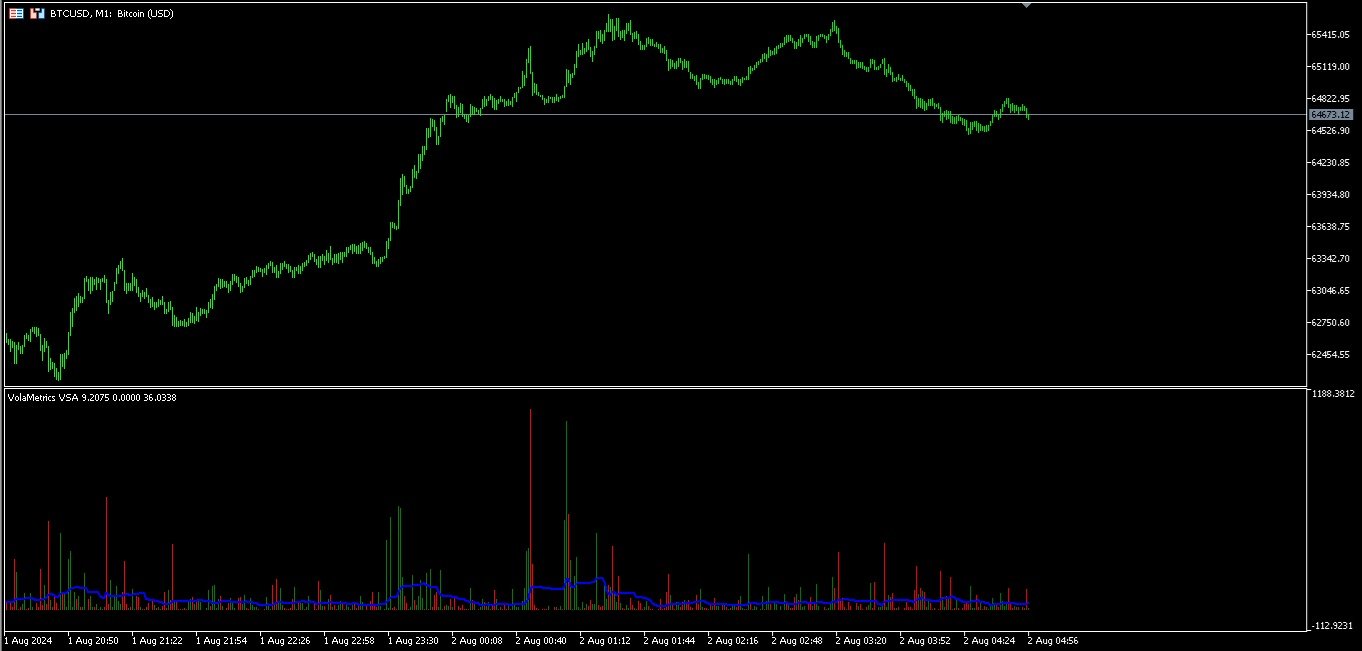
VolaMetrics VSA ist ein fortschrittlicher technischer Indikator, der die Volume Spread Analysis (VSA) Methodik mit einer detaillierten Analyse des Handelsvolumens kombiniert. Dieser Indikator wurde entwickelt, um bedeutende Preisbewegungen auf dem Markt zu identifizieren und zu verfolgen, indem die Interaktion zwischen Volumen und Preisänderung genutzt wird.

Grundlagen der Volume Spread Analysis (VSA)

VSA ist eine Methodik, die das Verhältnis zwischen Handelsvolumen, Preisänderung (Spread) und dem Schlusskurs in einem bestimmten Zeitraum analysiert. Die grundlegende Annahme von VSA ist, dass Preisbewegungen das Ergebnis der Aktivitäten der am besten informierten Marktteilnehmer (Smart Money) sind, die Spuren in den Volumen- und Spread-Mustern hinterlassen. Durch das Studium dieser Muster können Anzeichen für Akkumulation oder Distribution erkannt werden, die oft bedeutenden Preisbewegungen vorausgehen.

Funktionsweise von VolaMetrics VSA

VolaMetrics VSA automatisiert die traditionelle VSA-Analyse und bietet Händlern ein leistungsstarkes Werkzeug zur Erkennung von Umkehr- oder Fortsetzungssignalen von Trends. Der Indikator analysiert gleichzeitig das Handelsvolumen und die Preisänderungen über mehrere Zeiträume hinweg und sucht nach Mustern, die auf eine signifikante institutionelle Aktivität hinweisen.

  • Volumenanalyse: VolaMetrics VSA überwacht das Handelsvolumen, um ungewöhnliche Anstiege oder Rückgänge zu erkennen, die auf den Einstieg oder Ausstieg großer Marktteilnehmer hinweisen könnten.

  • Preisspread: Der Preisspread wird zusammen mit dem Volumen analysiert, um die Stärke oder Schwäche einer Bewegung zu bestimmen. Zum Beispiel könnte ein Anstieg des Volumens, der von einem engen Spread begleitet wird, auf eine Ermüdung des Trends hinweisen.

  • Marktkontext: Der Indikator berücksichtigt den Marktkontext, wie Unterstützungs- und Widerstandsniveaus, um die Interpretation der VSA-Signale anzupassen und die Genauigkeit der Vorhersagen zu erhöhen.

Effektivität von VolaMetrics VSA bei der Verfolgung von Preisbewegungen

VolaMetrics VSA zeichnet sich durch seine Fähigkeit aus, Marktbewegungen basierend auf VSA-Signalen vorherzusagen, die oft Trendänderungen vorausgehen. Durch die Kombination dieser Signale mit einer robusten Volumenanalyse kann VolaMetrics VSA Ein- und Ausstiegsmöglichkeiten präziser identifizieren.

Praktische Anwendungen:

  • Erkennung von Akkumulation/Distribution: Identifiziert Phasen, in denen große Marktteilnehmer Vermögenswerte akkumulieren oder distribuieren, was häufig großen Bewegungen vorausgeht.

  • Trendbestätigung: Validiert die Stärke eines bestehenden Trends und hilft Händlern, zu entscheiden, ob sie ihre Positionen beibehalten oder anpassen sollten.

  • Umkehrsignale: Bietet frühzeitige Warnungen vor möglichen Umkehrungen, sodass Händler sich entsprechend positionieren können.

Fazit

VolaMetrics VSA ist ein leistungsstarkes und vielseitiges technisches Werkzeug, das für Händler, die ihre Marktanalyse vertiefen möchten, unverzichtbar ist. Der auf VSA und Volumen basierende Ansatz ermöglicht eine genauere Interpretation von Preisbewegungen und bietet einen Wettbewerbsvorteil bei der Identifizierung von Handelsmöglichkeiten.


Empfohlene Produkte
UPD1 Profile Levels MT5
Vitaliy Kuznetsov
5 (3)
Der Indikator findet die Niveaus des maximalen und minimalen Preisvolumens (Marktprofil) auf dem Arbeitsbalkendiagramm für die angegebene Anzahl von Balken.   Verbundprofil. Die Höhe des Histogramms ist vollautomatisch und passt sich an jedes Werkzeug und jeden Zeitrahmen an. Der Algorithmus des Autors wird verwendet und wiederholt bekannte Analoga nicht. Die Höhe der beiden Histogramme ist ungefähr gleich der durchschnittlichen Höhe der Kerze. Smart Alert (Smart alert) hilft Ihnen, den Preis in
WAPV Weis Wave Chart Forex
Eduardo Da Costa Custodio Santos
Der Weis Wave Chart Forex für MT5 ist ein Preis- und Volumenindikator. Die Lesart von Preis und Volumen wurde durch Richard Demille Wyckoff auf der Grundlage der drei von ihm geschaffenen Gesetze verbreitet: Angebot und Nachfrage, Ursache und Wirkung und Aufwand vs. Ergebnis. Bereits 1900 verwendete R.Wyckoff das Wellendiagramm in seinen Analysen. Viele Jahre später, um 1990, automatisierte David Weis das Wellendiagramm von R. Wyckoff, und heute bringen wir Ihnen die Entwicklung des Wellendiagra
The VWAP indicator is our version of the popular Volume-Weighted Average Price indicator. The VWAP is the ratio between the value traded (price multiplied by the number of volume traded) and the total volume traded over a specific time period. As a result, it measures the average price of the instrument much better than the simple moving average. Although there are many ways to use the VWAP, most investors use it to calculate the daily average.  The indicator works in five modes: Moving  - In
VolumeDeltaBars
Stanislav Korotky
This indicator is a conventional analytical tool for tick volumes changes. It calculates tick volumes for buys and sells separately, and their delta on every bar, and displays volumes by price clusters (cells) within a specified bar (usually the latest one). The algorithm used internally is the same as in the indicator VolumeDeltaMT5 , but results are shown as cumulative volume delta bars (candlesticks). Analogous indicator for MetaTrader 4 exists - CumulativeDeltaBars . This is a limited substi
The Accumulation / Distribution is an indicator which was essentially designed to measure underlying supply and demand. It accomplishes this by trying to determine whether traders are actually accumulating (buying) or distributing (selling). This indicator should be more accurate than other default MT5 AD indicator for measuring buy/sell pressure by volume, identifying trend change through divergence and calculating Accumulation/Distribution (A/D) level. Application: - Buy/sell pressure: above
Wapv Price and volume
Eduardo Da Costa Custodio Santos
Der WAPV Price and Volume Indicator for MT5 ist Teil des Toolsets (Wyckoff Academy Wave Market) und (Wyckoff Academy Price and Volume). Der WAPV-Preis- und Volumenindikator für MT5 wurde entwickelt, um die Volumenbewegung auf dem Chart auf intuitive Weise einfach zu visualisieren. Damit können Sie die Momente des Spitzenvolumens und Momente beobachten, in denen der Markt kein professionelles Interesse hat Identifizieren Sie Momente, in denen sich der Markt durch Trägheit bewegt und nicht durch d
Do you use volume in your reading of the market? Certainly many traders use it, and do not imagine operating without it. The Color Histogram Volume Set indicator allows the user to choose the value that he considers interesting to monitor. When you pass this you will have visual confirmation and if you want you will also have the audible alert that is given by the indicator. Of course, there are other ways to try to find a high volume, such as assessing whether the volume
Mean Reversion Supply Demand Indicator Mean Reversion Supply Demand is the indicator to detect the important supply demand zone in your chart. The concept of supply demand trading relies on the quantity mismatching between buying and selling volumes in the financial market. Typically, supply demand zone serves to predict the turning point. The wave pattern, for any supply demand zone to work as an successful trade, looks like the price must touch the base zone, move away and then return to zone
No Demand No Supply MT5
Trade The Volume Waves Single Member P.C.
No Demand No Supply   This indicator identifies   No Demand –No Supply candles to your chart and plots volume bars colored according to the signal. It can be applied to all timeframes or to a specific one only. It can also be used as regular volume indicator  with exceptional future of WEIGHTED VOLUME. Furthermore is has an alert notification, sound and email when a signals occurs. The indicator does not repaint but the alert will come on two candles back due to the definition of No Demand No Su
Was: $249  Now: $99   Market Profile defines a number of day types that can help the trader to determine market behaviour. A key feature is the Value Area, representing the range of price action where 70% of trading took place. Understanding the Value Area can give traders valuable insight into market direction and establish the higher odds trade. It is an excellent addition to any system you may be using. Inspired by Jim Dalton’s book “Mind Over Markets”, this indicator is designed to suit the
The balance of supply and demand is a simple and effective market analysis method. The supply and demand diagram can show you in advance, even before the trend reversal, where the supply ends and the demand is already emerging, where the demand ends and the supply is emerging, while substantially increasing the probability of making a deal in the right direction and with a high profit factor. Indicator signals The indicator uses the price/volume values to generate signals: ED – excess demand.
The MultiTimeframe Volume Zones Indicator is a powerful tool designed to provide traders with comprehensive insights into market dynamics. It combines several essential features, including volume analysis, Dow Zones, buy and sell arrows, candle timer, and market movement across different time frames. This all-in-one indicator equips traders with valuable information to make informed trading decisions. Key Features: Volume Analysis: Gain a deep understanding of market sentiment and strength by an
Description The indicator uses market profile theory to show the most relevant trading zones, on a daily basis. The zones to be shown are LVN (low volume nodes) and POC (point of control). An LVN zone is one which represents price areas with the least time or volume throughout the day. Typically, these areas indicate a supply or demand initiative, and in the future, they can turn into important breakout or retracement zones. A POC zone is one which represents price areas with the most time or vo
The Volume+ and VSA Signals indicator for MT5 is based on the Volume Spread Analysis (VSA) methodology to provide the signals. The signals are displayed at closing of bars on the main window or subwindow in the form of symbols. The symbols are not repainting.  The indicator produces a signal on an individual bar and this signal is not buy or sell signal. When a minor trend goes in the opposite direction of a major trend, there are sequences of major trend-following signals that give a higher pro
Volumes Direction MT5
William Oswaldo Mayorga Urduy
LAUTSTÄRKE RICHTUNG MT5 Normalerweise ändert sich die Farbe der Lautstärkeanzeige, wenn die aktuelle Lautstärke höher als die vorherige ist. Dies ist wichtig, aber nicht sehr nützlich. Aus diesem Grund wurde dieser Indikator erstellt, der zusätzlich zum normalen Volumen, wenn die Kerze bullisch oder bärisch ist, sie in einer anderen Farbe anmalt, standardmäßig blau für bullisch und rot für bärisch, aber diese Farben können angepasst werden Geschmack des Händlers. Vergessen Sie nicht,
Waves PRO
Flavio Javier Jarabeck
For those who appreciate Richard Wyckoff approach for reading the markets, we at Minions Labs designed a tool derived - yes, derived, we put our own vision and sauce into this indicator - which we called Waves PRO . This indicator provides a ZigZag controlled by the market volatility (ATR) to build its legs, AND on each ZigZag leg, we present the vital data statistics about it. Simple and objective. This indicator is also derived from the great book called " The Secret Science of Price and Volum
KT Volume Profile MT5
KEENBASE SOFTWARE SOLUTIONS
5 (1)
KT Volume Profile shows the volume accumulation data as a histogram on the y-axis providing an ability to find out the trading activity over specified time periods and price levels. Point of Control (POC) in a Volume Profile POC represents a price level that coincides with the highest traded volume within the whole volume profile histogram. POC is mostly used as a support/resistance or as an essential price level where market retest before going in a specific direction. Features Very easy
This indicator provides an original mix of WPR, VSA, and volume delta. It shows ratio of buy/sell volumes scaled on 100% range based on total volume change for a selected period. The convetional VSA (Volume Spread Analysis) studies interconnections of price action and volume change in absolute values, whereas WPR (Williams Percent Range) offers a convenient approach of price moves normalization into the fixed percentage metric: 0 - 100%. Hence overbough and oversold states are easily spotted. N
The   Supply and Demand Zones indicator   is one of the best tools we have ever made. This great tool automatically draws supply and demand zones, the best places for opening and closing positions. It has many advanced features such as multi timeframe zones support, displaying the width of zones, alert notifications for retouched zones, and much more. Because of market fractality, this indicator can be used for any kind of trading. Whether you are a positional, swing, or intraday trader does no
COSMOS4U Volume MT5
COSMOS4U - D. Vezeris & Co, L.P.
1 (1)
COSMOS4U Volume indicator facilitates your trade decisions. It gives confirmation of the running movement and market trends. It highlights current and past accumulation and distribution volumes, comparing them to moving average volume and the highest volume. In addition, it identifies and marks nuances as well as convergence and divergence patterns of bears and bulls in order to provide the market trend and price ranges. The supported features are as follows: Fast Volume Moving Average Slow Volu
FREE
Mr Big MT5
Pavel Verveyko
The indicator shows and highlights the chart candles, which are formed as a result of large players entering the market in large volumes. Such candles can also be formed after achieving a certainty on the market, when most of the participants hold positions in the same direction. The movement is likely to continue in that direction after such candles. The indicator highlights the significant candles from the existing ones on the chart; The indicator allows identifying the trends based on candles
Normalized OBV
Jose Miguel Soriano
When looking at the information of On Balance Volume indicator, a question arises: is it a strong or weak movement? Should it be compared with previous days? These data should be normalized to always have a reference. This indicator presents the followings parameters: Normalization period (Max-Mins absolute) Smoothing period (-1 off) Tick/Real Volume Maximum number of bars to calculate (-1 off) Upper value normalization Lower value normalization Calculation: normOBV = (value - absMin) * (relMa
Market Marker MT5
Evgeny Shevtsov
3.8 (5)
The indicator displays peak levels of activity formed by the maximum volume, tracks the correlation of the candles on all timeframes (from the highest to the lowest one). Each volume level is a kind of key trading activity. The most important cluster is inside a month, week, day, hour, etc. Indicator operation features A volume level receives Demand status if the nearest volume level located to the left and above has been broken upwards. A volume level receives Supply status if the nearest vol
True Weis Wave
Atila Goncalves Firmino
A version based on David Waves' description in his book 'Trade About to Happen' of his adaptation of the Wyckoff wave chart. The indicator directionally accumulates volume, adding to each brick or candle close, with color indication for up and down. it can be used it with tick or real volume, it also changes color when the accumulated value of the previous wave is exceeded, being the trade signal. Yellow color is used for doji candlestick, it will continue with accumulation without zero the sum
One of the Best Volume Indicators, with the addition of a Moving Average for weighting volume over time average. If the "Current Candle" Volume is X% greater than the Moving Average value, we will have a sign of increasing volume. It can be a sign of Beginning, Continuity, Reversal or Exhaustion of the Movement. Fully configurable and all options open, you can color and set ALL values as you see fit. The 'Volume Break' shows volume bars in the same color as the candlestick, in addition
Wolfe Waves sind natürlich vorkommende Handelsmuster, die an allen Finanzmärkten vorhanden sind und einen Kampf um einen Gleichgewichtspreis darstellen. Diese Muster können sich über kurze und lange Zeiträume entwickeln und sind eines der zuverlässigsten prädiktiven Umkehrmuster, die es gibt und die normalerweise starken und langen Kursbewegungen vorausgehen. [ Installationsanleitung | Update-Anleitung | Fehlerbehebung | FAQ | Alle Produkte ] Klare Handelssignale Erstaunlich einfach zu handeln
Weis Wave Result MT5
Sant Clear Ali Costa
Features 3 types of waves: bullish, bearish and unknown. The unknown tower comes when prices move in opposite the direction of the current tower. Label that shows the percentage remaining for the next tower. Allows you set the type of volume that will be accumulated in the towers, either real or tick volumes. Thus, the indicator works in any market, for example: stocks, futures, forex, commodities, etc. Allows you to set the required score for the tower exchange. Allows you to set the font size
DBS Delta
Dmitriy Burlachenko
The delta indicator is used to display the difference between the volume that passed on the exchange at the Ask price and above (market buys) and the volume that passed at the Bid price and below (market sales). This indicator shows the delta of each candle on the timeframe of your choice. The data is displayed as a colored histogram in a separate indicator window. The indicator is calculated from the tick history, therefore, to speed up the calculations and reduce the load on the system, the n
Forex Volume MT5
KEENBASE SOFTWARE SOLUTIONS
KT Forex Volume shows the buying and selling volume of a currency pair in the form of a colored histogram. The volume is made of buying and selling transactions in an asset. In FX market: If the buying volume gets bigger than the selling volume, the price of a currency pair would go up. If the selling volume gets bigger than the buying volume, the price of a currency pair would go down. Features Avoid the bad trades by confirming them using the tick volume data. It helps you to stay on the si
A "Volume Profile" is an advanced charting indicator that displays total volume traded at every price level over a user specified time period. The main components of the volume profile are POC ( Point Of Control - the price level, at which the maximum number of contracts were executed during a selected period), VAH ( Value Area High - the highest price in the Value Area) and VAL ( Value Area Low - the lowest price in the Value Area). When we settled on the original indicator, we spent a lot o
Käufer dieses Produkts erwarben auch
Atomic Analyst MT5
Issam Kassas
4.78 (18)
Zunächst einmal ist es erwähnenswert, dass dieser Handelsindikator nicht neu malt, nicht neu zeichnet und keine Verzögerung aufweist, was ihn sowohl für manuellen als auch für Roboterhandel ideal macht. Benutzerhandbuch: Einstellungen, Eingaben und Strategie. Der Atom-Analyst ist ein PA-Preisaktionsindikator, der die Stärke und das Momentum des Preises nutzt, um einen besseren Vorteil auf dem Markt zu finden. Ausgestattet mit fortschrittlichen Filtern, die helfen, Rauschen und falsche Signale z
Zunächst einmal ist es wichtig zu betonen, dass dieses Handelssystem ein Nicht-Repainting-, Nicht-Redrawing- und Nicht-Verzögerungsindikator ist, was es sowohl für manuelles als auch für automatisches Trading ideal macht. Online-Kurs, Handbuch und Vorlagen herunterladen. Das "Smart Trend Trading System MT5" ist eine umfassende Handelslösung, die für neue und erfahrene Trader maßgeschneidert ist. Es kombiniert über 10 Premium-Indikatoren und bietet mehr als 7 robuste Handelsstrategien, was es zu
Quantum Trend Sniper
Bogdan Ion Puscasu
4.92 (48)
Wir stellen vor       Quantum Trend Sniper Indicator   , der bahnbrechende MQL5-Indikator, der die Art und Weise, wie Sie Trendumkehrungen erkennen und handeln, verändert! Entwickelt von einem Team erfahrener Händler mit über 13 Jahren Handelserfahrung,       Quantum Trend Sniper-Indikator       wurde entwickelt, um Ihre Trading-Reise mit seiner innovativen Methode zur Identifizierung von Trendumkehrungen mit extrem hoher Genauigkeit auf ein neues Niveau zu heben. ***Kaufe Quantum Trend Snipe
TPSproTREND PrO MT5
Roman Podpora
4.89 (9)
TPSpro TREND PRO  - is a trend indicator that automatically analyzes the market and provides information about the trend and each of its changes, as well as giving signals for entering trades without redrawing! The indicator uses each candle, analyzing them separately. referring to different impulses - up or down impulse. Exact entry points into transactions for currencies, crypto, metals, stocks, indices!  Version MT4               DETAILED DESCRIPTION               R ecommended to use with an
Reversal First Impulse levels (RFI)      INSTRUCTIONS        RUS       -       ENG              R ecommended to use with an indicator   -   TPSpro  TREND PRO -  Version MT4                 A key element in trading is zones or levels from which decisions to buy or sell a trading instrument are made. Despite attempts by major players to conceal their presence in the market, they inevitably leave traces. Our task was to learn how to identify these traces and interpret them correctly. Main functi
Dieses Dashboard zeigt die   neuesten verfügbaren harmonischen   Muster für die ausgewählten Symbole, so dass Sie Zeit sparen und effizienter sein werden /   MT4-Version . Kostenloser Indikator:   Basic Harmonic Pattern Spalten des Indikators Symbol:   die ausgewählten Symbole werden angezeigt Trend:   bullish oder bearish Pattern :   Art des Musters (Gartley, Schmetterling, Fledermaus, Krabbe, Hai, Cypher oder ABCD) Entry :   Einstiegskurs SL:   Stop-Loss-Kurs TP1:   1. Take-Profit-Kurs
Dies ist ein Indikator für MT5, der genaue Signale für den Einstieg in einen Handel ohne Repainting (Neuzeichnen) liefert. Er kann auf alle Finanzwerte angewendet werden: Forex, Kryptowährungen, Metalle, Aktien, Indizes. Er liefert ziemlich genaue Schätzungen und sagt Ihnen, wann es am besten ist, eine Position zu eröffnen und zu schließen. Sehen Sie sich das Video (6:22) mit einem Beispiel für die Verarbeitung nur eines Signals an, das sich für den Indikator gelohnt hat! Die meisten Händler ver
AT Forex Indicator MT5
Marzena Maria Szmit
5 (4)
The AT Forex Indicator MT5 is a sophisticated trading tool designed to provide traders with a comprehensive analysis of multiple currency pairs. This powerful indicator simplifies the complex nature of the forex market, making it accessible for both novice and experienced traders. AT Forex Indicator uses advanced algorithms to detect trends, patterns and is an essential tool for traders aiming to enhance their forex trading performance. With its robust features, ease of use, and reliable signal
Dies ist wahrscheinlich der vollständigste Indikator für die automatische Erkennung der harmonischen Preisbildung, den Sie für die MetaTrader-Plattform finden können. Es erkennt 19 verschiedene Muster, nimmt Fibonacci-Projektionen genauso ernst wie Sie, zeigt die potenzielle Umkehrzone (PRZ) an und findet geeignete Stop-Loss- und Take-Profit-Werte. [ Installationsanleitung | Update-Anleitung | Fehlerbehebung | FAQ | Alle Produkte ] Es erkennt 19 verschiedene harmonische Preisbildungen Dar
Wir stellen vor       Quantum Breakout PRO   , der bahnbrechende MQL5-Indikator, der die Art und Weise, wie Sie mit Breakout-Zonen handeln, verändert! Entwickelt von einem Team erfahrener Händler mit über 13 Jahren Handelserfahrung,       Quantum Breakout PRO       ist darauf ausgelegt, Ihre Handelsreise mit seiner innovativen und dynamischen Breakout-Zone-Strategie auf ein neues Niveau zu heben. Der Quantum Breakout Indicator zeigt Ihnen Signalpfeile auf Breakout-Zonen mit 5 Gewinnzielzone
Gartley Hunter Multi
Siarhei Vashchylka
5 (8)
Gartley Hunter Multi - An indicator for searching for harmonic patterns simultaneously on dozens of trading instruments and on all possible timeframes. Manual (Be sure to read before purchasing) | Version for MT4 Advantages 1. Patterns: Gartley, Butterfly, Shark, Crab. Bat, Alternate Bat, Deep Crab, Cypher 2. Simultaneous search for patterns on dozens of trading instruments and on all possible timeframes 3. Search for patterns of all possible sizes. From the smallest to the largest 4. A
FX Power MT5 NG
Daniel Stein
5 (6)
Erhalten Sie Ihr tägliches Marktupdate mit Details und Screenshots über unser Morning Briefing hier auf mql5 und auf Telegram ! FX Power MT5 NG ist die nächste Generation unseres langjährig sehr beliebten Währungsstärkemessers FX Power. Und was bietet dieser Stärkezähler der nächsten Generation? Alles, was Sie am ursprünglichen FX Power geliebt haben PLUS GOLD/XAU-Stärkeanalyse Noch präzisere Berechnungsergebnisse Individuell konfigurierbare Analysezeiträume Anpassbares Berechnungslimit für noc
Trend Forecaster
Alexey Minkov
5 (6)
The Trend Forecaster indicator utilizes a unique proprietary algorithm to determine entry points for a breakout trading strategy. The indicator identifies price clusters, analyzes price movement near levels, and provides a signal when the price breaks through a level. The Trend Forecaster indicator is suitable for all financial assets, including currencies (Forex), metals, stocks, indices, and cryptocurrencies. You can also adjust the indicator to work on any time frames, although it is recommen
FX Volume MT5
Daniel Stein
4.94 (17)
Erhalten Sie Ihr tägliches Marktupdate mit Details und Screenshots über unser Morning Briefing hier auf mql5 und auf Telegram ! FX Volume ist der ERSTE und EINZIGE Volumenindikator, der einen ECHTEN Einblick in die Marktstimmung aus Sicht eines Brokers bietet. Es bietet fantastische Einblicke in die Positionierung von institutionellen Marktteilnehmern, wie z.B. Brokern, auf dem Forex-Markt, viel schneller als COT-Berichte. Diese Informationen direkt auf Ihrem Chart zu sehen, ist der wahre Game
Advanced Supply Demand MT5
Bernhard Schweigert
4.53 (15)
Derzeit 33% Rabatt! Die beste Lösung für jeden Anfänger oder erfahrenen Händler! Dieser Indikator ist ein einzigartiges, qualitativ hochwertiges und erschwingliches Trading-Tool, da wir eine Reihe von proprietären Funktionen und eine neue Formel integriert haben. Mit diesem Update werden Sie in der Lage sein, doppelte Zeitrahmenzonen anzuzeigen. Sie können nicht nur einen höheren TF (Zeitrahmen) anzeigen, sondern sowohl den Chart-TF als auch den höheren TF: SHOWING NESTED ZONES. Alle Supply Dema
Gold TMAF MTF - dies ist ein bester technischer Indikator für Aktien. Der Algorithmus des Indikators analysiert die Preisbewegung eines Vermögenswertes und spiegelt die Volatilität und potenzielle Einstiegszonen wider. Die besten Indikatorsignale: - Für VERKAUF = rote obere Begrenzung von TMA2 über der roten oberen Begrenzung von TMA1 + roter Fraktalindikator oben + gelber SR-Signalpfeil in die gleiche Richtung. - Für KAUFEN = blaue untere Grenze von TMA2 unterhalb der blauen unteren Gr
MTF Supply Demand Zones MT5
Georgios Kalomoiropoulos
5 (1)
Automatisierte Angebots- und Nachfragezonen der nächsten Generation. Neuer und innovativer Algorithmus, der bei jedem Diagramm funktioniert. Alle Zonen werden dynamisch entsprechend der Preisbewegung des Marktes erstellt. ZWEI ARTEN VON WARNUNGEN --> 1) WENN DER PREIS EINE ZONE ERREICHT 2) WENN EINE NEUE ZONE BILDET WIRD Sie erhalten keinen weiteren nutzlosen Indikator. Sie erhalten eine vollständige Handelsstrategie mit nachgewiesenen Ergebnissen.     Neue Eigenschaften:    
The iChannels
BeeXXI Corporation
5 (1)
Ultra-fast recognition of parabolic channels (as well as linear, horizontal and wavy channels) throughout the depth of history, creating a hierarchy of channels. Required setting: Max bars in chart: Unlimited This indicator is designed primarily for algorithmic trading, but can also be used for manual trading.  This indicator will have a very active evolution in the near future and detailed descriptions on how to apply to create robots
Quantum Heiken Ashi PRO MT5
Bogdan Ion Puscasu
4.5 (8)
Wir stellen den   Quantum Heiken Ashi PRO   vor Die Heiken-Ashi-Kerzen wurden entwickelt, um klare Einblicke in Markttrends zu geben und sind bekannt für ihre Fähigkeit, Rauschen herauszufiltern und falsche Signale zu eliminieren. Verabschieden Sie sich von verwirrenden Preisschwankungen und begrüßen Sie eine glattere, zuverlässigere Diagrammdarstellung. Was den Quantum Heiken Ashi PRO wirklich einzigartig macht, ist seine innovative Formel, die traditionelle Candlestick-Daten in leicht lesbare
Matreshka
Dimitr Trifonov
5 (1)
Matreshka self-testing and self-optimizing indicator: 1. Is an interpretation of the Elliott Wave Analysis Theory. 2. Based on the principle of the indicator type ZigZag, and the waves are based on the principle of interpretation of the theory of DeMark. 3. Filters waves in length and height. 4. Draws up to six levels of ZigZag at the same time, tracking waves of different orders. 5. Marks Pulsed and Recoil Waves. 6. Draws arrows to open positions 7. Draws three channels. 8. Notes support and re
Volume by Price MT5
Brian Collard
3.6 (5)
The Volumebyprice.com Indicator for MetaTrader 5 features Volume Profile and Market Profile TPO (Time Price Opportunity). Volume and TPO histogram bar and line charts. Volume Footprint charts. TPO letter and block marker collapsed and split structure charts. Static, dynamic and flexible range segmentation and compositing methods with relative and absolute visualizations. Session hours filtering and segment concatenation with Market Watch and custom user specifications. Graphical layering, posit
FxaccurateLS
Shiv Raj Kumawat
WHY IS OUR FXACCCURATE LS MT5 THE PROFITABLE ? PROTECT YOUR CAPITAL WITH RISK MANAGEMENT Gives entry, stop and target levels from time to time. It finds Trading opportunities by analyzing what the price is doing during established trends. POWERFUL INDICATOR FOR A RELIABLE STRATEGIES We have made these indicators with a lot of years of hard work. It is made at a very advanced level. Established trends provide dozens of trading opportunities, but most trend indicators completely ignore them!
MetaBands M5
Vahidreza Heidar Gholami
4.67 (3)
MetaBands verwendet leistungsstarke und einzigartige Algorithmen, um Kanäle zu zeichnen und Trends zu erkennen, sodass es Tradern potenzielle Punkte für den Einstieg und Ausstieg aus Trades bieten kann. Es ist ein Kanalindikator sowie ein leistungsstarker Trendindikator. Es umfasst verschiedene Arten von Kanälen, die einfach durch Verwendung der Eingabeparameter zusammengeführt werden können. MetaBands verwendet alle Arten von Warnmeldungen, um Benutzer über Marktereignisse zu informieren. Funkt
The Price Action Finder Multi indicator is an indicator of entry points that searches for and displays Price Action system patterns on dozens of trading instruments and on all standard time frames: (m1, m5, m15, m30, H1, H4, D1, Wk, Mn). The indicator places the found patterns in a table at the bottom of the screen. By clicking on the pattern names in the table, you can move to the chart where this pattern is located. Manual (Be sure to read before purchasing) | Version for MT4 Advantages 1. Pa
Der Forex TPA Indikator deckt die wahren Aktionen der Marktmacher auf, immer dann wenn sie passieren. "Kämpfe nicht gegen die Marktmacher an, sondern folge ihnen", ist wohl der beste Rat, den ein Trader bekommen kann. Der TPA Indikator zeigt jedesmal seine Signale an wenn die Bullen definitiv stärker sind als die Bären und umgekehrt. Dieser Indikator wurde VON Tradern FÜR Trader gemacht und ist 100% NICHT NACHZEICHNEND! Signale werden STRENG am Schluss einer Kerze  generiert. Das sagen unsere Ku
Introduction to Fractal Pattern Scanner Fractal Indicator refers to the technical indicator that makes use of the fractal geometry found in the financial market. Fractal Pattern Scanner is the advanced Fractal Indicator that brings the latest trading technology after the extensive research and development work in the fractal geometry in the financial market. The most important feature in Fractal Pattern Scanner is the ability to measure the turning point probability as well as the trend probabil
Identify key turning points with reliable fractal analysis This indicator examines the price structure of fractals of different periods to determine possible reversal points in the market, providing timing to positional traders that already have a fundamental or technical valuation model. Unlike its younger brother, Reversal Fractals , this indicator won't miss reversals because of the period selected, and will find reversal fractals on a zig-zag fashion, ignoring those reversals which do not
Automated Trendlines MT5
Georgios Kalomoiropoulos
Trendlinien sind das wichtigste Werkzeug der technischen Analyse im Devisenhandel. Leider zeichnen die meisten Händler sie nicht richtig. Der automatische Trendlinien-Indikator ist ein professionelles Tool für ernsthafte Trader, das Ihnen hilft, die Trendbewegung der Märkte zu visualisieren. Es gibt zwei Arten von Trendlinien Bullische Trendlinien und Bärische Trendlinien. Im Aufwärtstrend wird die Forex-Trendlinie durch die niedrigsten Swing-Punkte der Preisbewegung gezogen. Wenn man m
Jetzt 147 US -Dollar (nach ein paar Aktualisierungen auf 499 US -Dollar) - Unbegrenzte Konten (PCs oder MACs) RelicusRoad Benutzerhandbuch + Schulungsvideos + Zugang zur privaten Discord-Gruppe + VIP-Status EINE NEUE ART, DEN MARKT ZU BETRACHTEN RelicusRoad ist der weltweit leistungsstärkste Handelsindikator für Forex, Futures, Kryptowährungen, Aktien und Indizes und gibt Händlern alle Informationen und Tools, die sie benötigen, um profitabel zu bleiben. Wir bieten technische Analysen un
Blahtech Supply Demand MT5
Blahtech Limited
4.54 (13)
Was: $299  Now: $99   Supply Demand uses previous price action to identify potential imbalances between buyers and sellers. The key is to identify the better odds zones, not just the untouched ones. Blahtech Supply Demand indicator delivers functionality previously unavailable on any trading platform. This 4-in-1 indicator not only highlights the higher probability zones using a multi-criteria strength engine, but also combines it with multi-timeframe trend analysis, previously confirmed swings
Weitere Produkte dieses Autors
AI Channel
Thalles Nascimento De Carvalho
4 (4)
Einleitung: Willkommen zur Präsentation des AI Channel Indikators, einem leistungsstarken Tool, das künstliche Intelligenz für die Analyse von Preisbereichen auf dem Finanzmarkt verwendet. In dieser Sitzung werden wir erforschen, wie dieser revolutionäre Indikator Anlegern und Händlern dabei helfen kann, fundiertere und strategischere Entscheidungen zu treffen. Fangen wir an! I. Was ist der AI Channel Indikator? AI Channel ist ein Indikator, der auf fortschrittlichen künstlichen Intelligenzalgor
FREE
Master OBV FX
Thalles Nascimento De Carvalho
5 (1)
The MasterOBV indicator is a powerful technical analysis tool that utilizes volume, positive correlation, and a Moving Average (MA) to enhance trend identification in financial markets. By incorporating assets with positive correlation through the indicator menu, MasterOBV provides a refined approach to assessing the strength and direction of trends. The inclusion of the Moving Average adds additional smoothing to price movements, aiding in a more accurate tracking of the underlying trend over
FREE
Long Short
Thalles Nascimento De Carvalho
4.67 (3)
Long & Short Indicator, tracks the movements of assets that have positive or negative correlation allowing to explore displacement in advance. - High Hit Rate With Real Time Information. - More Safe Entries in Operations. - Facilitates Short and Long Term Reading. - Option to trigger alert for the Levels. Information for Ea Buffer Symbol 1ª = 0 ;  Buffer Symbol 2ª = 2 ; * Free version only EURUSD! 
FREE
Swing Point Volume
Thalles Nascimento De Carvalho
Swing Point Volume, the indicator that signals weakness and strength at the tops and bottoms. This indicador can be for used the Wyckoff Method. Information provided; - Swing on customized ticks. - Volume and points in each balance sheet. - Percentage of Displacement. - Sound alert option on top and bottom breaks. - Volume in ticks and Real Volume. - Volume HL (extreme) or (opening and closing) - Customized volume shapes.
Atr Projection
Thalles Nascimento De Carvalho
O Indicador ATR Projeção destaca-se como uma ferramenta robusta na análise técnica, projetada para fornecer insights precisos sobre os limites potenciais de movimentação dos preços no mercado financeiro. Sua abordagem flexível permite aos usuários customizar as métricas de análise de forma intuitiva, adaptando-se às necessidades específicas de cada ativo operado. Funcionamento Personalizável: Por padrão, o ATR Projeção opera considerando 30% da média dos últimos 100 candles. Essa flexibili
Box Weis Wave
Thalles Nascimento De Carvalho
5 (1)
Wenn Sie ein aktiver Trader sind und eine effektive Möglichkeit suchen, die Bewegungen auf dem Finanzmarkt zu interpretieren, werden Sie es lieben, den Weis Wave Box kennenzulernen. Dieser unglaubliche Indikator wurde entwickelt, um eine klare und genaue visuelle Analyse von Volumenwellen sowie die Darstellung der entsprechenden Swing-Punkte zu bieten. Mit seinen fünf anpassbaren Swing-Formen und anderen einzigartigen Funktionen ist der Weis Wave Box ein unverzichtbares Werkzeug sowohl für erfah
Long Short Pro
Thalles Nascimento De Carvalho
Um den Long- und Short-Indikator effektiv zu nutzen und die Korrelationen zwischen verschiedenen Assets zu nutzen, ist es wichtig, einige grundlegende Schritte zu befolgen. Verstehe die Grundlagen des Indikators: Mach dich mit den zugrunde liegenden Metriken und Berechnungen des Long- und Short-Indikators vertraut. Verstehe, wie er Währungspaare, Indizes oder Kryptowährungen korreliert und positive oder negative Korrelationen zwischen diesen Assets identifiziert. Analysiere die Korrelationen zwi
Reversal Vol Propagation
Thalles Nascimento De Carvalho
Sind Sie es leid, Handelsmöglichkeiten zu verpassen, weil Sie Preisumkehrungen nicht rechtzeitig erkennen können? Möchten Sie Ihre Gewinne maximieren und informierte Handelsentscheidungen treffen? Wir präsentieren Ihnen den Reversal Vol Propagation Indikator, das revolutionäre Tool, das neuronale Netzwerke und Volumendaten verwendet, um mögliche Preisumkehrungen vorherzusagen. Basierend auf einer leistungsstarken Kombination aus fortschrittlichen Algorithmen und modernster Technologie analysiert
Didi Index Volume
Thalles Nascimento De Carvalho
Wir stellen Ihnen den Didi Index Volume vor, einen technischen Analyseindikator, der vom brasilianischen Trader Odir Aguiar entwickelt wurde und sich durch einen fortgeschrittenen und leistungsstarken Ansatz zur Identifizierung von Chancen auf dem Finanzmarkt auszeichnet. Der Didi Index Volume ist auf verschiedenen Plattformen verfügbar und hat sich zu einem unverzichtbaren Werkzeug für Trader entwickelt, die präzise Einblicke und wertvolle Informationen für ihre Handelsstrategien suchen. Der
Smart Binary Volume
Thalles Nascimento De Carvalho
Der Smart Binary Volume-Indikator ist ein vielseitiges Werkzeug, das den Handelsvolumen-Analysen mit maschinellem Lernen kombiniert. Er kann auf verschiedenen Märkten und Strategien angewendet werden, einschließlich Scalping und anderen Arten von kurzfristigen Handelsgeschäften. Durch den Einsatz fortschrittlicher maschineller Lernalgorithmen erkennt der Indikator komplexe Muster und generiert präzisere Kauf- und Verkaufssignale. Buffer to Create EA. Buffer Line Gold = 0. Buffer Line Red = 2
TimeChannel
Thalles Nascimento De Carvalho
The "Timechannel" is a powerful technical analysis tool designed specifically for traders who want to gain deeper and more accurate insights into price movements across multiple timeframes (multi-timeframe). This indicator is an essential addition to the toolbox of any serious trader seeking to make informed and data-driven trading decisions. Key Features: Advanced Multi-Timeframe Analysis : Timechannel allows traders to analyze price movements on different timeframes simultaneously. This is cr
DeltaBook
Thalles Nascimento De Carvalho
Der Delta Book-Indikator ist ein leistungsstarkes Instrument zur Marktanalyse, das die Verwendung von Volumen-Delta mit Informationen aus dem Orderbuch kombiniert, um Preisbewegungen in Finanzmärkten wie Aktien, Futures und Kryptowährungen zu erkennen. Es ist wichtig zu beachten, dass der Delta Book-Zugang zu Echtzeitvolumendaten und Orderbuchinformationen erfordert, um sein volles Potenzial auszuschöpfen. Die Hauptmerkmale des Delta Book sind seine fortschrittliche Marktanalysestrategie, die es
Big Player Range
Thalles Nascimento De Carvalho
5 (2)
Willkommen beim "BigPlayerRange"-Indikator, einem technischen Analysewerkzeug, das entwickelt wurde, um signifikante Interessensbereiche von Finanzinstituten auf den Märkten zu identifizieren. Dieser Indikator bietet eine präzise Analyse von Preisbereichen, in denen große Marktteilnehmer eine erhebliche Aktivität und Interesse zeigen. Hauptmerkmale: 1. Kartierung der Interessensbereiche von Institutionen: "BigPlayerRange" hebt genau die Bereiche im Chart hervor, in denen Finanzinstitute st
Master OBV
Thalles Nascimento De Carvalho
The MasterOBV indicator is a powerful technical analysis tool that utilizes volume, positive correlation, and a Moving Average (MA) to enhance trend identification in financial markets. By incorporating assets with positive correlation through the indicator menu, MasterOBV provides a refined approach to assessing the strength and direction of trends. The inclusion of the Moving Average adds additional smoothing to price movements, aiding in a more accurate tracking of the underlying trend over
Smart Delta Volume
Thalles Nascimento De Carvalho
Der Smart Delta Volume verwendet dynamische Ebenen, die sich automatisch je nach Volatilität des Marktes anpassen. Diese Funktion gewährleistet eine präzisere und anpassungsfähigere Analyse der Echtzeitänderungen der Marktbedingungen. Mit der Fähigkeit zur dynamischen Anpassung bietet der Smart Delta Volume einen umfassenderen und verlässlicheren Einblick in den Volumenfluss und das Preisverhalten. Darüber hinaus verfügt der Smart Delta Volume über einen Pullback-Validierer, der ausgelöst wir
Auswahl:
Keine Bewertungen
Antwort auf eine Rezension