• Genel bakış
  • İncelemeler
  • Yorumlar

VolaMetrics VSA

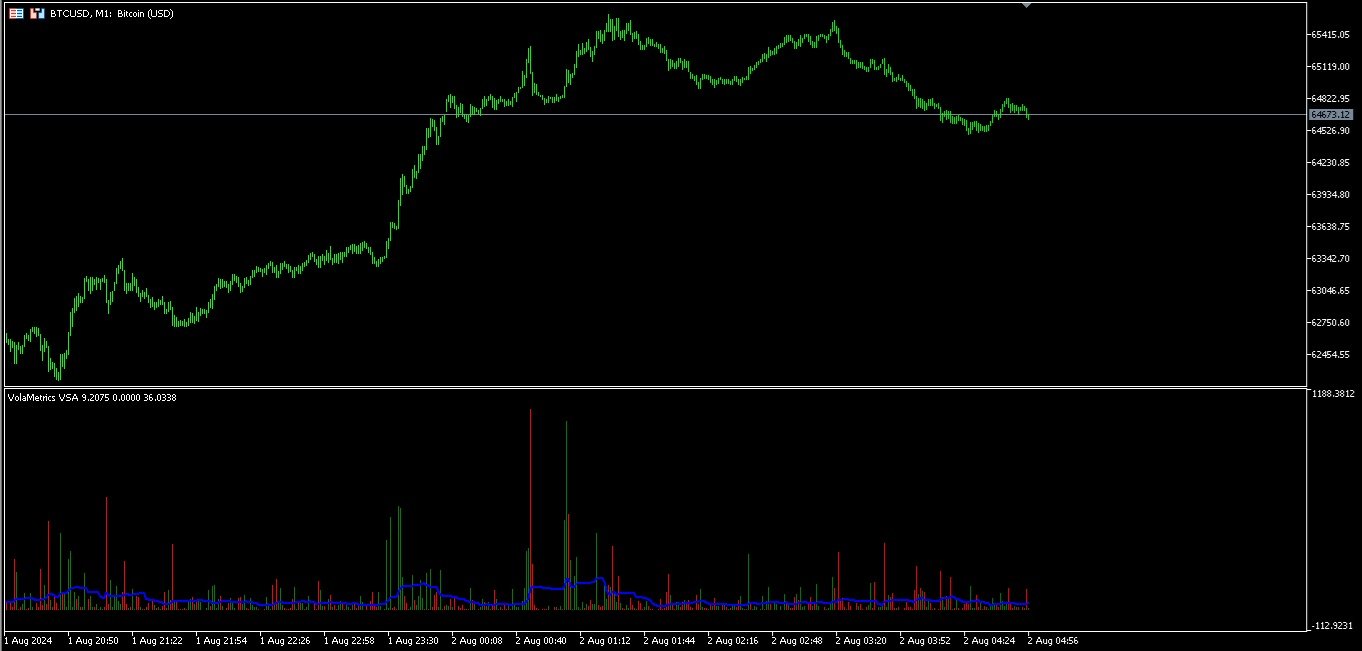
VolaMetrics VSA 📊 | Teknik Analizde Güçlü Bir Yardımcı

VolaMetrics VSA, Volume Spread Analysis (VSA) metodolojisini ayrıntılı işlem hacmi analizi ile birleştiren bir teknik analiz göstergesidir. Önemli fiyat hareketlerini belirlemek ve izlemek için tasarlanan bu araç, hacim ve fiyat yayılması arasındaki etkileşimi kullanarak, ticaret kararlarına yardımcı olabilecek değerli içgörüler sağlar.

Volume Spread Analysis (VSA) Temelleri 📈

Volume Spread Analysis (VSA), teknik analizde saygı gören bir yöntem olup, belirli bir süre içindeki işlem hacmi, fiyat yayılması ve kapanış fiyatı arasındaki ilişkiyi anlamaya odaklanır. En bilgili operatörlerin (smart money) fiyat hareketlerini etkilediği fikrine dayanarak, VSA birikim veya dağıtım sinyalleri tanımlar ve fiyatlarda önemli değişiklikler öncesinde bu sinyalleri belirlemeye yardımcı olur.

VolaMetrics VSA Nasıl Çalışır ⚙️

VolaMetrics VSA, geleneksel VSA analizini otomatikleştirir ve dönüş sinyalleri veya trend devam sinyalleri belirlemede güvenilir bir araç sağlar. Gösterge, işlem hacmi ve fiyat yayılması analizini birden fazla zaman diliminde yapar ve önemli kurumsal faaliyetleri gösteren desenleri arar.

  • Hacim Analizi 🔍: İşlem hacmini izler ve anormal artışlar veya azalmalar belirler, bu da büyük piyasa oyuncularının aktivitelerini gösterebilir.

  • Fiyat Yayılması 💵: Yayılmayı hacimle birlikte analiz eder ve bir hareketin gücünü veya zayıflığını değerlendirir, fiyat değişikliklerinin arkasındaki dinamikleri anlamaya yardımcı olur.

  • Pazar Bağlamı 🛠️: Destek ve direnç gibi faktörleri dikkate alır, böylece VSA sinyallerinin yorumlanmasını ayarlayarak analiz doğruluğunu artırır.

Dönüş Sinyalleri ve Hacim 🚀

VolaMetrics VSA, hacim tükenmesi veya aşırı yüksek hacim gibi dönüş sinyalleri etkili bir şekilde tanımlar. Bu sinyaller, hacim ve yayılma detaylı analizine dayanarak üretilir ve piyasa üzerindeki potansiyel dönüş noktalarını belirlemede yardımcı olur.

Pratik Uygulamalar 🎯

  • Birikim/Dağıtım Tespiti 🏦: Birikim veya dağıtım aşamalarını belirler, bu aşamalar genellikle büyük fiyat hareketlerinin öncesindedir.

  • Trend Onayı ✅: Mevcut bir trendin gücünü doğrulamanıza yardımcı olur, pozisyonların sürdürülmesi veya ayarlanması ile ilgili kararları destekler.

  • Dönüş Sinyalleri 🔄: Hacim tükenmesi veya yüksek hacim gibi olası trend dönüş sinyallerini gösterir, böylece potansiyel değişikliklere hazırlıklı olabilirsiniz.

Sonuç 📌 | Ciddi Traderlar İçin Güvenilir Bir Araç

VolaMetrics VSA, gerçek hacim ve fiyat verilerine dayalı ayrıntılı teknik analiz arayan traderlar için değerli bir araçtır. Titiz ve hassas yaklaşımı sayesinde piyasayı daha doğru bir şekilde analiz eder ve bilgilere dayalı kararlar alınmasına yardımcı olur.


Önerilen ürünler
The VWAP indicator is our version of the popular Volume-Weighted Average Price indicator. The VWAP is the ratio between the value traded (price multiplied by the number of volume traded) and the total volume traded over a specific time period. As a result, it measures the average price of the instrument much better than the simple moving average. Although there are many ways to use the VWAP, most investors use it to calculate the daily average.  The indicator works in five modes: Moving  - In
Do you use volume in your reading of the market? Certainly many traders use it, and do not imagine operating without it. The Color Histogram Volume Set indicator allows the user to choose the value that he considers interesting to monitor. When you pass this you will have visual confirmation and if you want you will also have the audible alert that is given by the indicator. Of course, there are other ways to try to find a high volume, such as assessing whether the volume
CVD SmoothFlow Pro
Thalles Nascimento De Carvalho
CVD SmoothFlow Pro - Her Varlık İçin Sınırsız Hacim Analizi! CVD SmoothFlow Pro , hassas ve sınırsız bir hacim analizi arayan trader'lar için nihai çözümüdür. Cumulative Volume Delta (CVD) hesaplamasını ve gelişmiş gürültü filtrelemesini kullanarak, Pro sürümü herhangi bir finansal varlık için gereken esneklik ve doğruluğu sağlar. CVD SmoothFlow Pro Neler Sunar? Açık Analiz : Pazar gürültüsünü filtreler ve her finansal varlıkta önemli hacim hareketlerini vurgular. ️ Kesin Hesaplama : Alım
Wapv Price and volume
Eduardo Da Costa Custodio Santos
MT5 için WAPV Fiyat ve Hacim Göstergesi, (Wyckoff Academy Wave Market) ve (Wyckoff Academy Fiyat ve Hacim) araç setinin bir parçasıdır. MT5 için WAPV Fiyat ve Hacim Göstergesi, grafikteki hacim hareketini sezgisel bir şekilde görselleştirmeyi kolaylaştırmak için oluşturuldu. Bununla, piyasanın profesyonel bir ilgisinin olmadığı en yüksek hacim anlarını ve anları gözlemleyebilirsiniz. Piyasanın "akıllı para" hareketiyle değil, ataletle hareket ettiği anları belirleyin. Kullanıcı tarafından değişt
Was: $249  Now: $99   Market Profile defines a number of day types that can help the trader to determine market behaviour. A key feature is the Value Area, representing the range of price action where 70% of trading took place. Understanding the Value Area can give traders valuable insight into market direction and establish the higher odds trade. It is an excellent addition to any system you may be using. Inspired by Jim Dalton’s book “Mind Over Markets”, this indicator is designed to suit the
A "Volume Profile" is an advanced charting indicator that displays total volume traded at every price level over a user specified time period. The main components of the volume profile are POC ( Point Of Control - the price level, at which the maximum number of contracts were executed during a selected period), VAH ( Value Area High - the highest price in the Value Area) and VAL ( Value Area Low - the lowest price in the Value Area). When we settled on the original indicator, we spent a lot o
VPO Profile MT5
Kyra Nickaline Watson-gordon
5 (2)
Definition : VPO is a Volume Price Opportunity. Instead of using bars or candles with an Open, High, Low, and Close price, each "bar" in a Market Profile is represented by horizontal bars against the price It is called Market Profile terminology. In other words volume-price-opportunity (VPO) profiles are histograms of how many volumes were traded at each price within the span of the profile. By using a VPO chart, you are able to analyze the amount of trading activity, based on volume, for eac
No Demand No Supply MT5
Trade The Volume Waves Single Member P.C.
No Demand No Supply   This indicator identifies   No Demand –No Supply candles to your chart and plots volume bars colored according to the signal. It can be applied to all timeframes or to a specific one only. It can also be used as regular volume indicator  with exceptional future of WEIGHTED VOLUME. Furthermore is has an alert notification, sound and email when a signals occurs. The indicator does not repaint but the alert will come on two candles back due to the definition of No Demand No Su
KT Volume Profile MT5
KEENBASE SOFTWARE SOLUTIONS
KT Volume Profile shows the volume accumulation data as a histogram on the y-axis providing an ability to find out the trading activity over specified time periods and price levels. Point of Control (POC) in a Volume Profile POC represents a price level that coincides with the highest traded volume within the whole volume profile histogram. POC is mostly used as a support/resistance or as an essential price level where market retest before going in a specific direction. Features Very easy
This indicator is a conventional analytical tool for tick volumes changes. It calculates tick volumes for buys and sells separately, and their delta on every bar, and displays volumes by price clusters (cells) within a specified bar (usually the latest one). The algorithm used internally is the same as in the indicator VolumeDeltaMT5 , but results are shown as cumulative volume delta bars (candlesticks). Analogous indicator for MetaTrader 4 exists - CumulativeDeltaBars . This is a limited substi
WAPV Weis Wave Chart Forex
Eduardo Da Costa Custodio Santos
MT5 için Weis Wave Chart Forex bir Fiyat ve Hacim göstergesidir. Fiyat ve Hacim okuması, Richard Demille Wyckoff tarafından oluşturulan üç yasaya dayalı olarak geniş çapta dağıtıldı: Arz ve Talep, Neden ve Etki ve Çabaya Karşı Sonuç. 1900'de R.Wyckoff, analizlerinde dalga grafiğini zaten kullanmıştı. Yıllar sonra, 1990 civarında, David Weis Otomatikleştirilmiş R. Wyckoff'un dalga grafiği ve bugün size David Weis'in dalga grafiğinin evrimini sunuyoruz. Varlıkta üretilen dalga ile ilgili Hacim mik
True Weis Wave
Atila Goncalves Firmino
A version based on David Waves' description in his book 'Trade About to Happen' of his adaptation of the Wyckoff wave chart. The indicator directionally accumulates volume, adding to each brick or candle close, with color indication for up and down. it can be used it with tick or real volume, it also changes color when the accumulated value of the previous wave is exceeded, being the trade signal. Yellow color is used for doji candlestick, it will continue with accumulation without zero the sum
Market Profile Heat indicator  — is a classic Market Profile implementation that can show the price density over time, outlining the most important price levels, value area, and control value of a given trading session. This indicator can be attached to timeframes between M1 and D1 and will show the Market Profile for daily, weekly, monthly, or even intraday sessions. Lower timeframes offer higher precision. Higher timeframes are recommended for better visibility. It is also possible to use a f
The Accumulation / Distribution is an indicator which was essentially designed to measure underlying supply and demand. It accomplishes this by trying to determine whether traders are actually accumulating (buying) or distributing (selling). This indicator should be more accurate than other default MT5 AD indicator for measuring buy/sell pressure by volume, identifying trend change through divergence and calculating Accumulation/Distribution (A/D) level. Application: - Buy/sell pressure: above
UPD1 Profile Levels MT5
Vitaliy Kuznetsov
5 (3)
Gösterge, belirtilen sayıda çubuk için çalışma histogramında maksimum ve minimum fiyat hacminin (piyasa profili) seviyelerini bulur.   Kompozit profil. Histogramın yüksekliği tamamen otomatiktir ve herhangi bir enstrümana ve zaman dilimine uyarlanabilir. Yazarın algoritması kullanılır ve bilinen analogları tekrarlamaz. İki histogramın yüksekliği yaklaşık olarak mumun ortalama yüksekliğine eşittir. Akıllı uyarı (akıllı uyarı), hacim seviyesine ilişkin fiyatı bildirmenize yardımcı olur. Konsept
The MultiTimeframe Volume Zones Indicator is a powerful tool designed to provide traders with comprehensive insights into market dynamics. It combines several essential features, including volume analysis, Dow Zones, buy and sell arrows, candle timer, and market movement across different time frames. This all-in-one indicator equips traders with valuable information to make informed trading decisions. Key Features: Volume Analysis: Gain a deep understanding of market sentiment and strength by an
Features 3 types of waves: bullish, bearish and unknown. The unknown tower comes when prices move in opposite the direction of the current tower. Label that shows the percentage remaining for the next tower. Allows you set the type of volume that will be accumulated in the towers, either real or tick volumes. Thus, the indicator works in any market, for example: stocks, futures, forex, commodities, etc. Allows you to set the required score for the tower exchange. Allows you to set the font size
Mt5 Market Profile
Mcblastus Gicharu Ndiba
Market Profile Introducing the Market Profile MetaTrader Indicator—your gateway to mastering market dynamics with precision and insight. This powerful tool delivers a classic Market Profile analysis, revealing price density over time and highlighting crucial levels, including the value area and control value for any trading session.  Compatible with timeframes from M1 to D1, it adapts to daily, weekly, monthly, or even intraday sessions, offering you unmatched flexibility. Lower timeframes pro
Mr Big MT5
Pavel Verveyko
The indicator shows and highlights the chart candles, which are formed as a result of large players entering the market in large volumes. Such candles can also be formed after achieving a certainty on the market, when most of the participants hold positions in the same direction. The movement is likely to continue in that direction after such candles. The indicator highlights the significant candles from the existing ones on the chart; The indicator allows identifying the trends based on candles
Mini Chart Indicators
Flavio Javier Jarabeck
The Metatrader 5 has a hidden jewel called Chart Object, mostly unknown to the common users and hidden in a sub-menu within the platform. Called Mini Chart, this object is a miniature instance of a big/normal chart that could be added/attached to any normal chart, this way the Mini Chart will be bound to the main Chart in a very minimalist way saving a precious amount of real state on your screen. If you don't know the Mini Chart, give it a try - see the video and screenshots below. This is a gr
Volumes Direction MT5
William Oswaldo Mayorga Urduy
HACİM YÖNÜ MT5 Normalde, mevcut ses seviyesi öncekinden daha yüksek olduğunda ses seviyesi göstergesi varsayılan bir renk değişikliğine sahiptir, bu önemlidir ancak çok kullanışlı değildir. Bu nedenle, bu gösterge, normal hacme ek olarak, mum yükseliş veya düşüş olduğunda, onları farklı bir renge boyar, varsayılan olarak yükseliş için mavi ve düşüş için kırmızıdır, ancak bu renkler özelleştirilebilir. Tüccar tadı. Ticaretinizi geliştirmenize yardımcı olacak diğer göstergelerime göz at
The Volume+ and VSA Signals indicator for MT5 is based on the Volume Spread Analysis (VSA) methodology to provide the signals. The signals are displayed at closing of bars on the main window or subwindow in the form of symbols. The symbols are not repainting.  The indicator produces a signal on an individual bar and this signal is not buy or sell signal. When a minor trend goes in the opposite direction of a major trend, there are sequences of major trend-following signals that give a higher pro
Description The indicator uses market profile theory to show the most relevant trading zones, on a daily basis. The zones to be shown are LVN (low volume nodes) and POC (point of control). An LVN zone is one which represents price areas with the least time or volume throughout the day. Typically, these areas indicate a supply or demand initiative, and in the future, they can turn into important breakout or retracement zones. A POC zone is one which represents price areas with the most time or vo
This indicator allows you to enjoy the two most popular products for analyzing request volumes and market deals at a favorable price: Actual Depth of Market Chart Actual Tick Footprint Volume Chart This product combines the power of both indicators and is provided as a single file. The functionality of Actual COMBO Depth of Market AND Tick Volume Chart is fully identical to the original indicators. You will enjoy the power of these two products combined into the single super-indicator! Below is
Volume Profile For MT5
Abdelkhabir Yassine Alaoui
Volume Profile is a very useful indicator . it allows you to spot the price levels where important price action took place. It is similar to support and resistance levels but with a different logic. ( Check Out  Fixed Range Volume Profile MT5  ) One of the first thing that traders mark up when analyzing a chart is support and resistance. Volume Profile can be used for doing that too. The indicator scans the defined number of previous bars and calculates the volume of activity at each price
Mean Volume indicator for MT5
Renaud Herve Francois Candel
Mean Volume Most indicators are based on price analysis. This indicator is based on volume. Volume is overlooked piece of information in most trading systems. And this is a big mistake since volume gives important information about market participants. Mean Volume is an indicator that can be used to spot when volume is above average. It usually means that institutional traders are active. Peak in volume can be used to confirm an entry since increased volume can sustain the move in one or
Waves PRO
Flavio Javier Jarabeck
For those who appreciate Richard Wyckoff approach for reading the markets, we at Minions Labs designed a tool derived - yes, derived, we put our own vision and sauce into this indicator - which we called Waves PRO . This indicator provides a ZigZag controlled by the market volatility (ATR) to build its legs, AND on each ZigZag leg, we present the vital data statistics about it. Simple and objective. This indicator is also derived from the great book called " The Secret Science of Price and Volum
MACD Gün İçi Trend PRO, 1960'larda Gerald Appel tarafından oluşturulan orijinal MACD'nin uyarlanmasıyla geliştirilen bir Göstergedir. Yıllarca süren ticaret sayesinde, MACD'nin parametrelerini Fibonacci oranlarıyla değiştirerek, trend hareketlerinin sürekliliğinin daha iyi bir sunumunu sağladığımız ve bir fiyat trendinin başlangıcını ve sonunu daha verimli bir şekilde tespit etmeyi mümkün kıldığımız gözlemlendi. Fiyat trendlerini tespit etmedeki etkinliği sayesinde, üst ve dip farklarını ço
DBS Delta
Dmitriy Burlachenko
The delta indicator is used to display the difference between the volume that passed on the exchange at the Ask price and above (market buys) and the volume that passed at the Bid price and below (market sales). This indicator shows the delta of each candle on the timeframe of your choice. The data is displayed as a colored histogram in a separate indicator window. The indicator is calculated from the tick history, therefore, to speed up the calculations and reduce the load on the system, the n
Mean Reversion Supply Demand Indicator Mean Reversion Supply Demand is the indicator to detect the important supply demand zone in your chart. The concept of supply demand trading relies on the quantity mismatching between buying and selling volumes in the financial market. Typically, supply demand zone serves to predict the turning point. The wave pattern, for any supply demand zone to work as an successful trade, looks like the price must touch the base zone, move away and then return to zone
Bu ürünün alıcıları ayrıca şunları da satın alıyor
TPSpro RFI Levels MT5
Roman Podpora
4.7 (10)
Reversal First Impulse levels (RFI)      INSTRUCTIONS        RUS       -       ENG              R ecommended to use with an indicator   -   TPSpro  TREND PRO -  Version MT4                 A key element in trading is zones or levels from which decisions to buy or sell a trading instrument are made. Despite attempts by major players to conceal their presence in the market, they inevitably leave traces. Our task was to learn how to identify these traces and interpret them correctly. Main functi
TPSproTREND PrO MT5
Roman Podpora
4.89 (9)
TPSpro TREND PRO  - is a trend indicator that automatically analyzes the market and provides information about the trend and each of its changes, as well as giving signals for entering trades without redrawing! The indicator uses each candle, analyzing them separately. referring to different impulses - up or down impulse. Exact entry points into transactions for currencies, crypto, metals, stocks, indices!  Version MT4               DETAILED DESCRIPTION               R ecommended to use with an
Atomic Analyst MT5
Issam Kassas
4.56 (18)
Öncelikle belirtmek gerekir ki bu Ticaret Göstergesi Yeniden Çizim Yapmaz, Gecikmez ve Gecikme Göstermez, bu da hem manuel hem de robot ticareti için ideal hale getirir. Kullanıcı kılavuzu: ayarlar, girişler ve strateji. Atom Analisti, Piyasada Daha İyi Bir Avantaj Bulmak İçin Fiyatın Gücünü ve Momentumunu Kullanan PA Fiyat Hareketi Göstergesidir. Gürültüleri ve Yanlış Sinyalleri Kaldırmaya ve Ticaret Potansiyelini Artırmaya Yardımcı Olan Gelişmiş Filtrelerle Donatılmıştır. Birden fazla katmanl
Öncelikle, bu Ticaret Sistemi'nin Non-Repainting, Non-Redrawing ve Non-Lagging Göstergesi olduğunu vurgulamak önemlidir, bu da hem manuel hem de robot ticareti için ideal hale getirir. Online kurs, kılavuz ve ön ayarları indir. "Smart Trend Trading System MT5", yeni ve deneyimli tüccarlar için özelleştirilmiş kapsamlı bir ticaret çözümüdür. 10'dan fazla premium göstergeyi birleştiriyor ve 7'den fazla sağlam ticaret stratejisi sunuyor, bu da çeşitli piyasa koşulları için esnek bir seçim yapar. Tr
Top indicator for MT5   providing accurate signals to enter a trade without repainting! It can be applied to any financial assets:   forex, cryptocurrencies, metals, stocks, indices .  Watch  the video  (6:22) with an example of processing only one signal that paid off the indicator! MT4 version is here It will provide pretty accurate trading signals and tell you when it's best to open a trade and close it. Most traders improve their trading results during the first trading week with the help of
FX Power MT5 NG
Daniel Stein
5 (5)
Sabah Brifingimiz burada mql5 ve on Telegram! FX Power MT5 NG , uzun zamandır çok popüler olan döviz gücü ölçerimiz FX Power'ın yeni neslidir. Peki bu yeni nesil güç ölçer ne sunuyor? Orijinal FX Power hakkında sevdiğiniz her şey PLUS GOLD/XAU güç analizi Daha da hassas hesaplama sonuçları Ayrı ayrı yapılandırılabilir analiz dönemleri Daha da iyi performans için özelleştirilebilir hesaplama limiti Özel çokluDaha fazlasını görmek isteyenler için örnek ayarlar Her grafikte en sevdiğiniz renkler i
Advanced Supply Demand MT5
Bernhard Schweigert
4.5 (14)
Herhangi bir Acemi veya Uzman Tüccar için En İyi Çözüm! Bu gösterge benzersiz, yüksek kaliteli ve uygun fiyatlı bir ticaret aracıdır çünkü bir dizi tescilli özelliği ve yeni bir formülü bir araya getirdik. Bu güncelleme ile çift zaman dilimi dilimlerini gösterebileceksiniz. Yalnızca daha yüksek bir TF gösteremeyeceksiniz, aynı zamanda TF grafiğini ve ARTIK daha yüksek TF'yi de gösterebileceksiniz: YUVARLAK BÖLGELERİ GÖSTERMEK. Tüm Arz Talebi tüccarları buna bayılacak. :) Önemli Bilgiler Açıkland
MetaForecast M5
Vahidreza Heidar Gholami
5 (2)
MetaForecast, fiyat verilerindeki harmonileri kullanarak herhangi bir piyasanın geleceğini tahmin eder ve görselleştirir. Piyasa her zaman tahmin edilemezken, fiyatlarda bir desen varsa, MetaForecast geleceği mümkün olduğunca doğru bir şekilde tahmin edebilir. Benzer ürünlere göre, MetaForecast piyasa eğilimlerini analiz ederek daha kesin sonuçlar üretebilir. Giriş Parametreleri Past size (Geçmiş boyut) MetaForecast'ın gelecekteki tahminler oluşturmak için kullandığı çubuk sayısını belirtir. M
FX Volume MT5
Daniel Stein
4.93 (14)
Sabah Brifingimiz aracılığıyla ayrıntılar ve ekran görüntüleri ile günlük piyasa güncellemenizi alın burada mql5 ve on Telegram ! FX Volume, bir brokerin bakış açısından piyasa duyarlılığı hakkında GERÇEK bir fikir veren İLK ve TEK hacim göstergesidir. COT raporlarından çok daha hızlı bir şekilde, brokerlar gibi kurumsal piyasa katılımcılarının Forex piyasasında nasıl konumlandıklarına dair harika bilgiler sağlar. Bu bilgileri doğrudan grafiğinizde görmek, ticaretiniz için gerçek oyun değiştir
Quantum Trend Sniper
Bogdan Ion Puscasu
4.79 (48)
Tanıtım       Kuantum Trend Keskin Nişancı Göstergesi   , trend tersine dönmeleri belirleme ve ticaret yapma şeklinizi değiştiren çığır açan MQL5 Göstergesi! 13 yılı aşkın ticaret tecrübesine sahip deneyimli tüccarlardan oluşan bir ekip tarafından geliştirilmiştir.       Kuantum Trend Keskin Nişancı Göstergesi       trend dönüşlerini son derece yüksek doğrulukla belirlemenin yenilikçi yolu ile ticaret yolculuğunuzu yeni zirvelere taşımak için tasarlanmıştır. ***Kuantum Trend Keskin Nişancı Gö
Unlock hidden profits: accurate divergence trading for all markets Special Offer: Purchase now to receive free bonuses worth $90! (Read more for details) Tricky to find and scarce in frequency, divergences are one of the most reliable trading scenarios. This indicator finds and scans for regular and hidden divergences automatically using your favourite oscillator. [ Installation Guide | Update Guide | Troubleshooting | FAQ | All Products ] Easy to trade Finds regular and hidden divergences S
Şimdi 147 $ (birkaç güncellemeden sonra 499 $ 'a yükseliyor) - Sınırsız Hesaplar (PC'ler veya Mac'ler) RelicusRoad Kullanım Kılavuzu + Eğitim Videoları + Özel Discord Grubuna Erişim + VIP Durumu PİYASAYA BAKMAK İÇİN YENİ BİR YOL RelicusRoad, forex, vadeli işlemler, kripto para birimleri, hisse senetleri ve endeksler için dünyanın en güçlü ticaret göstergesidir ve yatırımcılara kârlı kalmaları için ihtiyaç duydukları tüm bilgileri ve araçları sağlar. Başlangıç ​​seviyesinden ileri seviyey
Bu gösterge paneli, seçilen semboller için mevcut en son   harmonik kalıpları   gösterir, böylece zamandan tasarruf edersiniz ve daha verimli olursunuz /   MT4 sürümü . Ücretsiz Gösterge:   Basic Harmonic Pattern Gösterge sütunları Symbol :   seçilen semboller görünecektir Trend:   yükseliş veya düşüş Pattern :   desen türü (gartley, kelebek, yarasa, yengeç, köpekbalığı, cypher veya ABCD) Entry :   giriş fiyatı SL:   zararı durdur fiyatı TP1:   1. kar alma fiyatı TP2:   2. kar alma fiyatı
TPA True Price Action indicator reveals the true price action of the market makers through 100% non-repainting signals strictly at the close of a candle! TPA shows entries and re-entries, every time the bulls are definitely stronger than the bears and vice versa. Not to confuse with red/green candles. The shift of power gets confirmed at the earliest stage and is ONE exit strategy of several. There are available now two free parts of the TPA User Guide for our customers. The first "The Basics"
Gold TMAF MTF - bu en iyi hisse senedi teknik göstergesidir. Gösterge algoritması, bir varlığın fiyat hareketini analiz eder ve oynaklığı ve potansiyel giriş bölgelerini yansıtır. En iyi gösterge sinyalleri: - SAT için = TMA2'nin kırmızı üst sınırı TMA1'in kırmızı üst sınırının üzerinde + yukarıdaki kırmızı fraktal gösterge + aynı yönde sarı SR sinyal oku. - AL için = TMA2'nin mavi alt sınırı TMA1'in mavi alt sınırının altında + aşağıdan mavi fraktal gösterge + aynı yönde aqua SR sinyal
Golden Spikes Detector Acknowledgement and Dedications:  The name of this indicator was Inspired by an Original; Mr Grant Koopman; a Knowledgeable and experienced Synthetics trader. I dedicate this indicator to Mr Grant.  Overview: The Golden Spikes Premium is a groundbreaking trading indicator meticulously crafted for the Boom and Crash indices on the Deriv market. Tailored to meet the needs of discerning traders, this powerful tool operates exclusively on the one-minute timeframe, providin
Bu gösterge paneli, seçilen semboller için ticaret stratejinize bağlı olarak hem ölçeklendirme hem de uzun vadeli modda grafikteki   Arz ve Talep   bölgelerini keşfeder ve görüntüler. Ek olarak, gösterge tablosunun tarayıcı modu, istediğiniz tüm sembolleri bir bakışta kontrol etmenize ve uygun pozisyonları kaçırmamanıza yardımcı olur /   MT4 sürümü Ücretsiz gösterge:   Basic Supply Demand Özellikler Birden fazla döviz çiftinde   alım satım fırsatlarını görüntülemenize olanak tanıyarak,
Gold Venamax MT5
Sergei Linskii
3.5 (2)
Gold Venamax - bu en iyi hisse senedi teknik göstergesidir. Gösterge algoritması bir varlığın fiyat hareketini analiz eder ve oynaklığı ve potansiyel giriş bölgelerini yansıtır. Gösterge özellikleri: Bu, rahat ve karlı ticaret için Magic ve iki Blok trend oku içeren süper bir göstergedir. Grafikte blokları değiştirmek için Kırmızı Düğme görüntülenir. Magic, gösterge ayarlarında ayarlanır, böylece göstergeyi farklı Blokları görüntüleyen iki grafiğe yükleyebilirsiniz. Gold Venamax farklı ok t
Trend Hunter MT5
Andrey Tatarinov
5 (1)
Trend Hunter , Forex, kripto para birimi ve CFD piyasalarında çalışmaya yönelik bir trend göstergesidir. Göstergenin özel bir özelliği, fiyat trend çizgisini hafifçe deldiğinde sinyali değiştirmeden trendi güvenle takip etmesidir. Gösterge yeniden çizilmez; çubuk kapandıktan sonra pazara giriş sinyali görünür. Bir trend boyunca hareket ederken gösterge, trend yönünde ek giriş noktalarını gösterir. Bu sinyallere dayanarak küçük bir Zararı Durdur ile işlem yapabilirsiniz. Trend Hunter dürüst
XQ Indicator MetaTrader 5
Marzena Maria Szmit
5 (1)
Step into the realm of Forex trading with confidence and precision using XQ, a cutting-edge Forex indicator designed to elevate your trading game to unprecedented heights. Whether you're a seasoned trader or just stepping into the world of currency exchange, XQ Forex Indicator empowers you with the insights and signals needed to make informed trading decisions. The signal conditions are a combination of three indicators, and XQ Forex Indicator only display  medium and long-term trends . The ind
Unlock key market insights with automated support and resistance lines Special Offer: Purchase now to receive free bonuses worth $75! (Read more for details) Tired of plotting support and resistance lines? This is a multi-timeframe indicator that detects and plots supports and resistance lines in the chart with the same precision as a human eye would. As price levels are tested over time and its importance increases, the lines become thicker and darker, making price leves easy to glance and ev
SwingVolumePro
Thalles Nascimento De Carvalho
Genel Bakış SwingVolumePro , geniş bir finansal varlık yelpazesi üzerinde kullanılmak üzere tasarlanmış gelişmiş ve çok yönlü bir göstergedir. Hacim ve fiyat analizi üzerine kurulmuş olan bu gösterge, tüm seviyelerdeki trader'ların yüksek kaliteli verilere dayanarak bilinçli kararlar almasını sağlayacak şekilde net ve hassas sinyaller sunar. Ana Özellikler Çok Yönlülük: SwingVolumePro, hisse senetleri, forex, kripto paralar ve daha fazlası dahil olmak üzere çeşitli varlıklar üzerinde uy
Blahtech Supply Demand MT5
Blahtech Limited
4.54 (13)
Was: $299  Now: $99   Supply Demand uses previous price action to identify potential imbalances between buyers and sellers. The key is to identify the better odds zones, not just the untouched ones. Blahtech Supply Demand indicator delivers functionality previously unavailable on any trading platform. This 4-in-1 indicator not only highlights the higher probability zones using a multi-criteria strength engine, but also combines it with multi-timeframe trend analysis, previously confirmed swings
TrendMaestro5
Stefano Frisetti
note: this indicator is for METATRADER4, if you want the version for METATRADER5 this is the link:  https://www.mql5.com/it/market/product/108106 TRENDMAESTRO ver 2.4 TRENDMAESTRO recognizes a new TREND in the bud, he never makes mistakes. The certainty of identifying a new TREND is priceless. DESCRIPTION TRENDMAESTRO identifies a new TREND in the bud, this indicator examines the volatility, volumes and momentum to identify the moment in which there is an explosion of one or more of these data a
Gartley Hunter Multi
Siarhei Vashchylka
5 (8)
Gartley Hunter Multi - An indicator for searching for harmonic patterns simultaneously on dozens of trading instruments and on all possible timeframes. Manual (Be sure to read before purchasing) | Version for MT4 Advantages 1. Patterns: Gartley, Butterfly, Shark, Crab. Bat, Alternate Bat, Deep Crab, Cypher 2. Simultaneous search for patterns on dozens of trading instruments and on all possible timeframes 3. Search for patterns of all possible sizes. From the smallest to the largest 4. A
The   Currency Index indicator   enables traders to display any index of eight major currencies. It uses a special calculation that considers specific currency pairs and their weights. The default weights are based on the BIS Triennial Central Bank Survey results. Because of this advantage, the trader can see each currency's true strength and weakness. Note:  If the indicator is used in Strategy Tester (demo version), please keep in mind that all currency pairs' data must be downloaded in H
PZ Day Trading MT5
PZ TRADING SLU
2.83 (6)
Effortless trading: non-repainting indicator for accurate price reversals Special Offer: Purchase now to receive free bonuses worth $60! (Read more for details) This indicator detects price reversals in a zig-zag fashion, using only price action analysis and a donchian channel. It has been specifically designed for short-term trading, without repainting or backpainting at all. It is a fantastic tool for shrewd traders aiming to increase the timing of their operations. [ Installation Guide | Upd
Native Channels
BeeXXI Corporation
5 (1)
This indicator recognizes all support and resistance levels. A number of unique high-performance techniques have been applied, which made the existence of this indicator possible. All formed channels are naturally visible: horizontal linear linear parabolic cubic (Polynomial 3 degrees - Wave) This is due to a bundle of approximating channels. The formed channels form "standing waves" in a hierarchical sequence. Thus, all support and resistance levels are visible. All parameter management is
Volume by Price MT5
Brian Collard
3.25 (4)
The Volumebyprice.com Indicator for MetaTrader 5 features Volume Profile and Market Profile TPO (Time Price Opportunity). Volume and TPO histogram bar and line charts. Volume Footprint charts. TPO letter and block marker collapsed and split structure charts. Static, dynamic and flexible range segmentation and compositing methods with relative and absolute visualizations. Session hours filtering and segment concatenation with Market Watch and custom user specifications. Graphical layering, posit
Gold Trend 5
Sergei Linskii
5 (1)
Altın Trend - bu iyi bir hisse senedi teknik göstergesidir. Gösterge algoritması, bir varlığın fiyat hareketini analiz eder ve oynaklığı ve potansiyel giriş bölgelerini yansıtır. En iyi gösterge sinyalleri: - SATIŞ için = kırmızı histogram + kırmızı KISA işaretçi + aynı yönde sarı sinyal oku. - AL için = mavi histogram + mavi UZUN işaretçi + aynı yönde aqua sinyal oku. Göstergenin faydaları: 1. Gösterge yüksek doğrulukta sinyaller üretir. 2. Onaylanmış bir ok sinyali yalnızca trend
Yazarın diğer ürünleri
SwingVolumePro
Thalles Nascimento De Carvalho
Genel Bakış SwingVolumePro , geniş bir finansal varlık yelpazesi üzerinde kullanılmak üzere tasarlanmış gelişmiş ve çok yönlü bir göstergedir. Hacim ve fiyat analizi üzerine kurulmuş olan bu gösterge, tüm seviyelerdeki trader'ların yüksek kaliteli verilere dayanarak bilinçli kararlar almasını sağlayacak şekilde net ve hassas sinyaller sunar. Ana Özellikler Çok Yönlülük: SwingVolumePro, hisse senetleri, forex, kripto paralar ve daha fazlası dahil olmak üzere çeşitli varlıklar üzerinde uy
Box Weis Wave
Thalles Nascimento De Carvalho
5 (1)
Weis Wave Box ile analizlerinizi bir üst seviyeye taşıyın! Eğer ticaretinizde hassasiyet ve netlik arıyorsanız, Weis Wave Box ihtiyaç duyduğunuz araçtır. Bu ileri düzey gösterge, hacim dalgaları ve swing noktalarının ayrıntılı görsel analizini sunarak, piyasalarda çaba ve sonuç arasındaki ilişkiyi daha iyi anlamanıza yardımcı olur. Weis Wave Box’ın Başlıca Özellikleri: Kişiselleştirilebilir Hacim Dalgaları: Ticaret stratejilerinize uygun olarak hacim dalgalarını tik bazında ayarlayın.
AI Channel
Thalles Nascimento De Carvalho
4 (4)
Welcome to the presentation of the AI Channel indicator, a powerful tool that uses artificial intelligence for price channel analysis in the financial market. In this session, we will explore how this revolutionary indicator can assist investors and traders in making more informed and strategic decisions. Let's get started! I. What is the AI Channel indicator? AI Channel is an indicator developed based on advanced artificial intelligence algorithms. It utilizes historical price data of financial
FREE
Cumulative Volume Bands
Thalles Nascimento De Carvalho
CVB Cumulative Volume Bands: Birikmiş Hacim ile İşlemlerinizi Güçlendirin! CVB Cumulative Volume Bands , birikmiş hacme dayalı kesin sinyaller arayan traderlar için tasarlanmış ileri düzey bir göstergedir. Birikmiş hacim bantlarını kullanarak, bu gösterge piyasanın alım ve satım baskılarının net okumasını sağlar ve dönüşleri ve güçlü fiyat hareketlerini tanımlamada yardımcı olur. Cumulative Volume Bands for MT5 ! Temel Özellikler: Birikmiş Hacim Analizi : Hacme dayalı baskı n
FREE
Swing Point Volume
Thalles Nascimento De Carvalho
Swing Point Volume, the indicator that signals weakness and strength at the tops and bottoms. This indicador can be for used the Wyckoff Method. Information provided; - Swing on customized ticks. - Volume and points in each balance sheet. - Percentage of Displacement. - Sound alert option on top and bottom breaks. - Volume in ticks and Real Volume. - Volume HL (extreme) or (opening and closing) - Customized volume shapes.
Atr Projection
Thalles Nascimento De Carvalho
ATR Projeksiyon Göstergesi, finansal piyasalardaki fiyat hareketlerinin potansiyel sınırları konusunda keskin görüşler sunmak amacıyla tasarlanmış teknik analizde güçlü bir araç olarak öne çıkıyor. Esnek yaklaşımı, kullanıcıların analiz ölçümlerini sezgisel bir şekilde özelleştirmelerine, her işlem yapılan varlığın özel ihtiyaçlarına uyarlamalarına izin verir. Özelleştirilebilir İşleyiş: Varsayılan olarak, ATR Projeke 100 mumun ortalamasının %30'unu göz önünde bulundurarak çalışır. Bu esne
Long Short Pro
Thalles Nascimento De Carvalho
Long & Short Göstergesi - Pro Versiyon: Pazar Analizinizi Sınırsız Olanaklarla Güçlendirin! Tüm Varlıklar İçin Sınırsız Kullanım Long & Short göstergesinin Pro versiyonu, herhangi bir finansal varlık üzerinde tam özgürlük sunar. Artık sınırlama olmadan aynı göstergiyi tüm tercih ettiğiniz varlıklara uygulayabilirsiniz! Sınırsız Erişim Göstergeyi hiçbir kısıtlama olmadan kullanmanın tadını çıkarın. Pro versiyonu, size tam ve sınırsız bir deneyim sunarak her piyasa fırsatını en üst
Didi Index Volume
Thalles Nascimento De Carvalho
Sunuyoruz, Didi Index Volume adlı bir teknik analiz göstergesi. Bu gösterge, Brezilyalı trader Odir Aguiar tarafından geliştirilmiştir ve finansal piyasalardaki fırsatları tespit etmede ileri ve güçlü bir yaklaşımıyla öne çıkmaktadır. Çeşitli platformlarda mevcut olan Didi Index Volume, kesin bilgilere ve değerli bilgilere ihtiyaç duyan işlemciler için vazgeçilmez bir araç haline gelmiştir. Gösterge, Odir Aguiar tarafından oluşturulan saygın Didi Index ile işlem hacminin akıllı bir şekilde ku
Smart Binary Volume
Thalles Nascimento De Carvalho
Smart Binary Volume göstergesi, ticaret hacmi analizini makine öğrenimi ile birleştiren çok yönlü bir araçtır. Scalping ve diğer kısa vadeli ticaret stratejileri de dahil olmak üzere çeşitli piyasalarda ve stratejilerde kullanılabilir. Gelişmiş makine öğrenimi algoritmalarını kullanarak, gösterge karmaşık desenleri tanımlar ve daha hassas alım satım sinyalleri üretir. Buffer to Create EA. Buffer Line Gold = 0. Buffer Line Red = 2 Buffer   AI  =  3 AI Buffer  >=  0  ("SIGNAL BUY") AI Buffer 
TimeChannel
Thalles Nascimento De Carvalho
The "Timechannel" is a powerful technical analysis tool designed specifically for traders who want to gain deeper and more accurate insights into price movements across multiple timeframes (multi-timeframe). This indicator is an essential addition to the toolbox of any serious trader seeking to make informed and data-driven trading decisions. Key Features: Advanced Multi-Timeframe Analysis : Timechannel allows traders to analyze price movements on different timeframes simultaneously. This is cr
Big Player Range
Thalles Nascimento De Carvalho
5 (2)
"BigPlayerRange"ın Gücünü Keşfedin: Pazar Teknik Analizinde Sizin Müttefikiniz BigPlayerRange 'ı tanıtıyoruz, piyasalarda kurumsal yatırımcıların ilgi alanlarını ortaya çıkaran gelişmiş bir teknik analiz aracıdır. Bu araç sayesinde, büyük oyuncuların aktif olduğu alanları hassas bir şekilde belirleyebilir ve bunun ticaret stratejilerinizi nasıl etkileyebileceğini anlayabilirsiniz. Ana Özellikler: Kurumsal İlgi Alanlarının Haritalanması : BigPlayerRange , kurumsal yatırımcıların yüksek etk
Master OBV
Thalles Nascimento De Carvalho
MasterOBV: Pazar Trendlerini Hassasiyetle Yönetin! MasterOBV , hacim , pozitif korelasyon ve Hareketli Ortalama (MA) kombinasyonunu kullanarak finansal piyasalarda trendleri tanımlama yeteneğini artıran bir teknik analiz göstergesi dir. Ana Özellikler: Akıllı Hacim: Ticaret hacmini analiz ederek trend gücündeki önemli değişimleri belirler. Pozitif Korelasyon: Korele olmuş varlıkları dahil ederek daha geniş ve doğru bir bakış açısı sağlar, çiftlerin hacmine dayalı olarak fiyat kayması
Smart Delta Volume
Thalles Nascimento De Carvalho
Smart Delta Volume: Dinamik Pazar Koşullarına Uyarlanabilir ve Hassas Araç Smart Delta Volume , sürekli değişen bir piyasa ortamında hassas ve uyarlanabilir analizler sunmak için tasarlanmış gelişmiş bir teknik göstergedir. Bu gösterge, volatiliteye göre otomatik olarak ayarlanan dinamik seviyeleri kullanarak, hacim akışı ile fiyat hareketleri arasındaki etkileşim hakkında daha kapsamlı ve güvenilir bir görüş sağlar. Bu uyarlanabilirlik, özellikle değişken piyasalarda hızlı ve doğru bilgiler
CVD SmoothFlow Pro
Thalles Nascimento De Carvalho
CVD SmoothFlow Pro - Her Varlık İçin Sınırsız Hacim Analizi! CVD SmoothFlow Pro , hassas ve sınırsız bir hacim analizi arayan trader'lar için nihai çözümüdür. Cumulative Volume Delta (CVD) hesaplamasını ve gelişmiş gürültü filtrelemesini kullanarak, Pro sürümü herhangi bir finansal varlık için gereken esneklik ve doğruluğu sağlar. CVD SmoothFlow Pro Neler Sunar? Açık Analiz : Pazar gürültüsünü filtreler ve her finansal varlıkta önemli hacim hareketlerini vurgular. ️ Kesin Hesaplama : Alım
VolumeSecret
Thalles Nascimento De Carvalho
VolumeSecret: Volume’un Gücü Elinizde Programlama dünyasında karşılaştığımız zorluklar, sürekli olarak büyümemize ve gelişmemize neden olur. Pazarın getirdiği zorlukları ve traderların en yüksek performansa ulaşma mücadelesini derinden anlıyoruz. Bu yüzden, pazar kararlarını daha akıcı ve hassas hale getirmek için yenilikçi çözümler üzerinde durmaksızın çalışıyoruz. VolumeSecret , bu bağlılığın bir sonucudur. Bu gelişmiş göstergeler, hacim analizi ile sofistike bir stratejiyi birleştirerek piyas
Cumulative Vol Bands
Thalles Nascimento De Carvalho
CVB Cumulative Volume Bands: Birikmiş Hacim ile İşlemlerinizi Güçlendirin! CVB Cumulative Volume Bands , birikmiş hacme dayalı kesin sinyaller arayan traderlar için tasarlanmış ileri düzey bir göstergedir. Birikmiş hacim bantlarını kullanarak, bu gösterge piyasanın alım ve satım baskılarının net okumasını sağlar ve dönüşleri ve güçlü fiyat hareketlerini tanımlamada yardımcı olur. Temel Özellikler: Birikmiş Hacim Analizi : Hacme dayalı baskı noktalarını tespit edin. Açık Giriş/
ZigWave Oscillator
Thalles Nascimento De Carvalho
ZigWave Oscillator: Osilatörler ve ZigZag ile İşlemlerinizi Güçlendirin! ZigWave Oscillator, finansal piyasalarda doğruluk ve netlik arayan traderlar için mükemmel bir araçtır. Bu gösterge, osilatörlerin gücünü ZigZag’ın görsel sadeliğiyle birleştirir ve en iyi alım ve satım fırsatlarını hızlı ve etkili bir şekilde tanımlamanıza yardımcı olur. Neden ZigWave Oscillator'ı Seçmelisiniz? Doğru Osilatör Analizi : RSI, Williams %R veya CCI’yi entegre ederek piyasanın ana hareketlerini yakala
Filtrele:
İnceleme yok
İncelemeye yanıt