• Übersicht
  • Bewertungen
  • Diskussion
  • Neue Funktionen

BBMA Structure Guide

Titel: BBMA Strukturführer - BBMA Strukturführer

Beschreibung:
BBMA Strukturführer ist ein spezialisiertes MQL4-Indikator, der entwickelt wurde, um Händlern zu helfen, die Entwicklung der BBMA-Struktur einfacher und effizienter zu verstehen. BBMA, oder "Bollinger Bands Moving Average", ist bekannt für sein Motto "Einen Schritt voraus", das die Bedeutung eines tiefen Verständnisses der Marktstruktur hervorhebt.

Mit BBMA Strukturführer können Sie schnell die grundlegenden Marktstrukturmuster identifizieren, die Preisschwankungen antreiben. Dies hilft Ihnen, fundiertere und effektivere Handelsentscheidungen zu treffen. Der Indikator stellt Informationen klar und intuitiv dar und ermöglicht es Ihnen, mit größerem Vertrauen die nächsten Schritte in Ihrem Handel zu machen.

Hauptmerkmale:
- **Tiefes Verständnis:** BBMA Strukturführer bietet einen klaren Überblick über die Marktstruktur und ermöglicht es Ihnen, die Marktmechanismen besser zu verstehen.
- **Benutzerfreundlichkeit:** Mit einer intuitiven Benutzeroberfläche entwickelt, kann dieser Indikator von Händlern aller Erfahrungsstufen leicht verwendet werden.
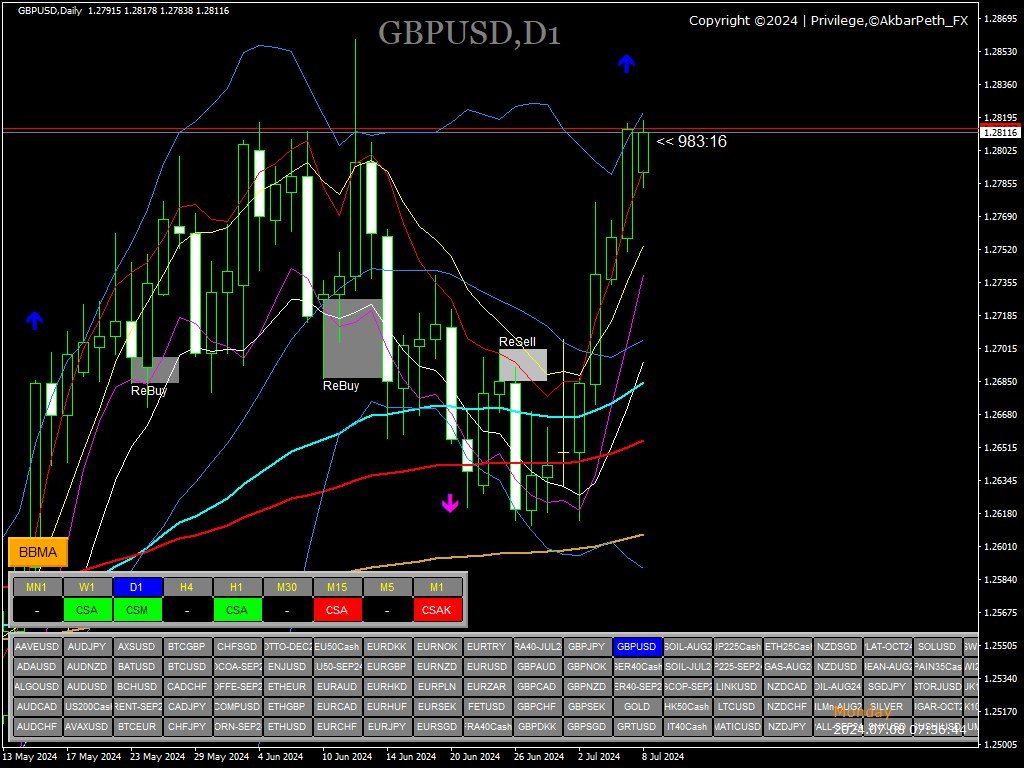
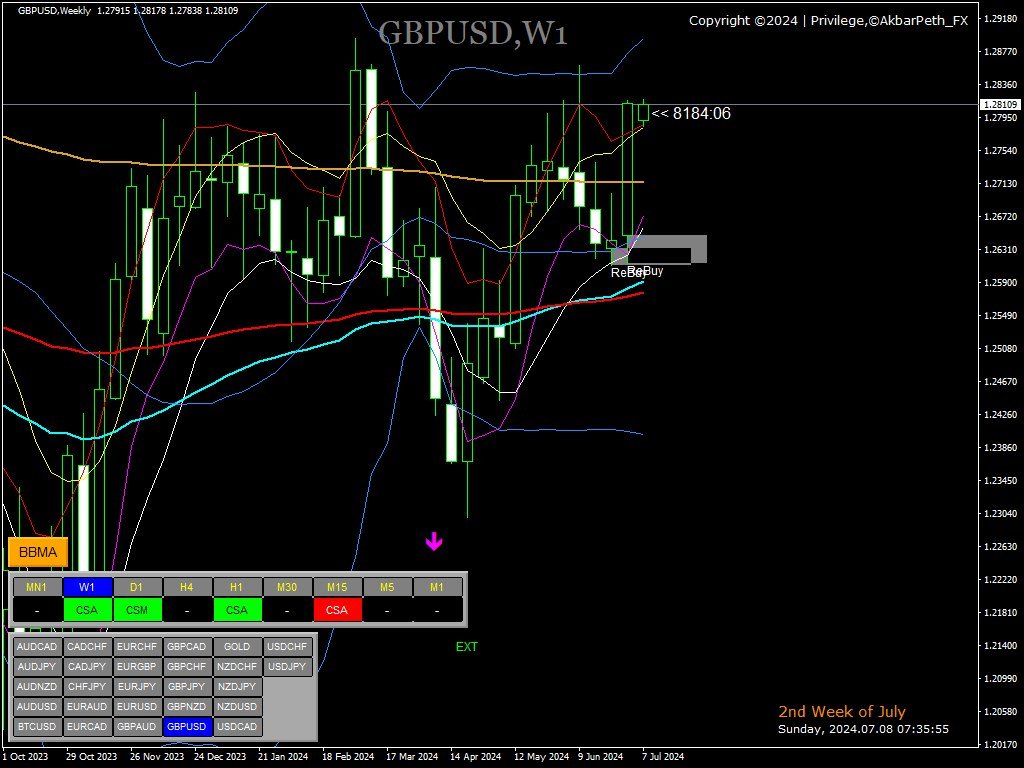
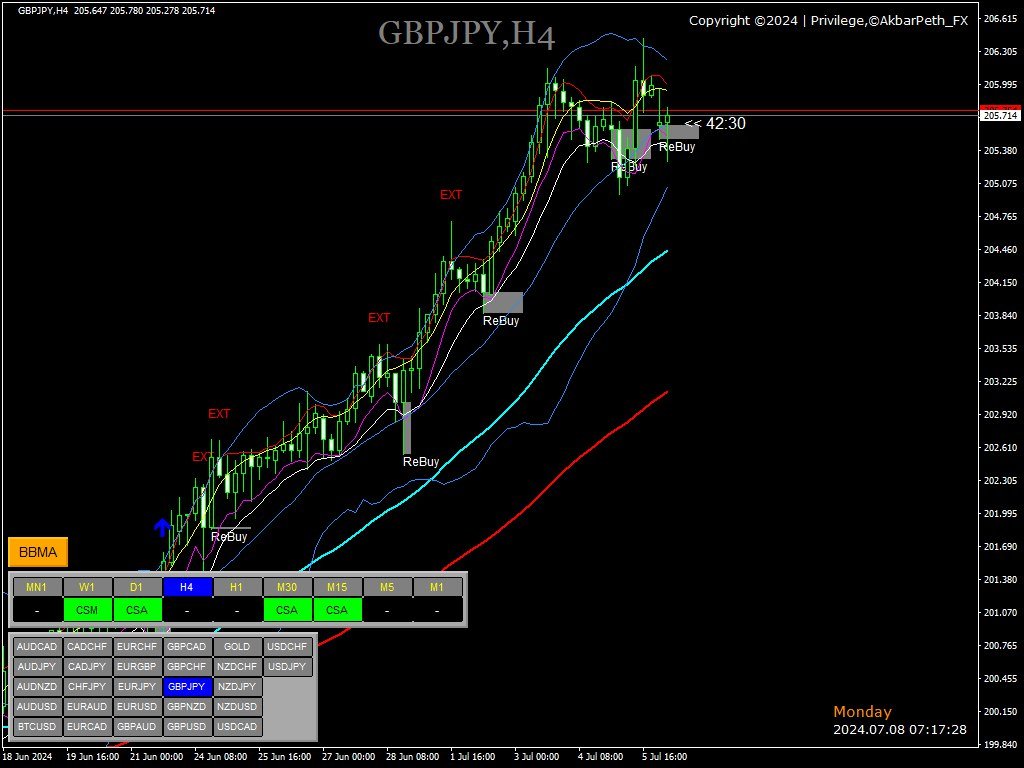
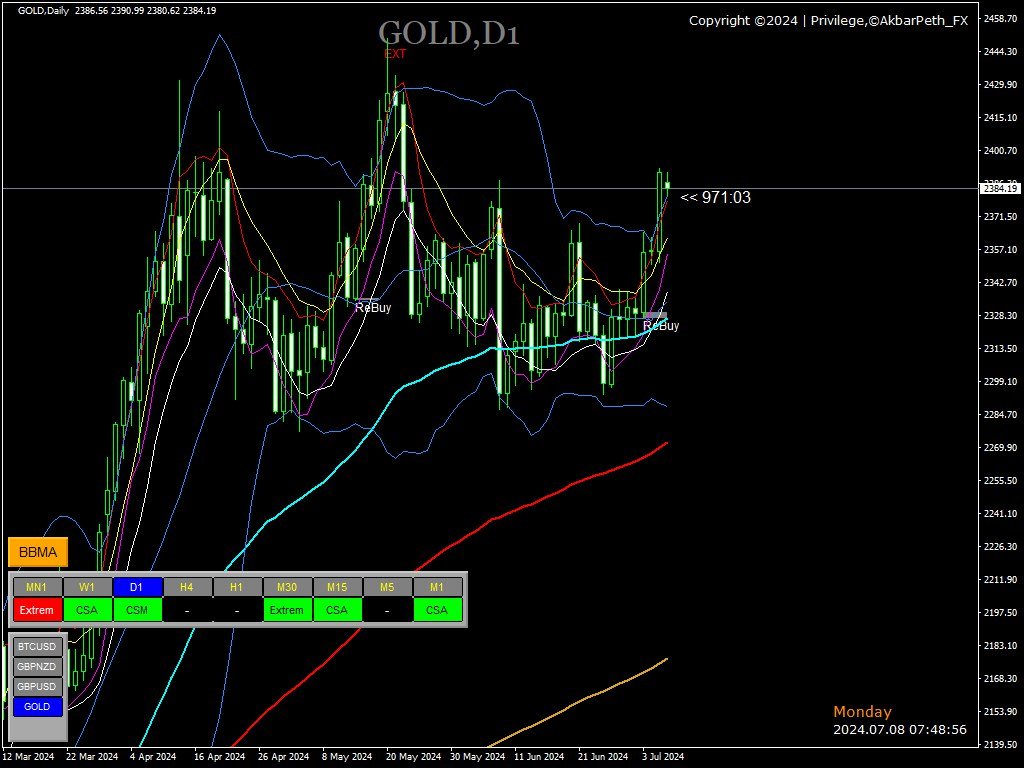
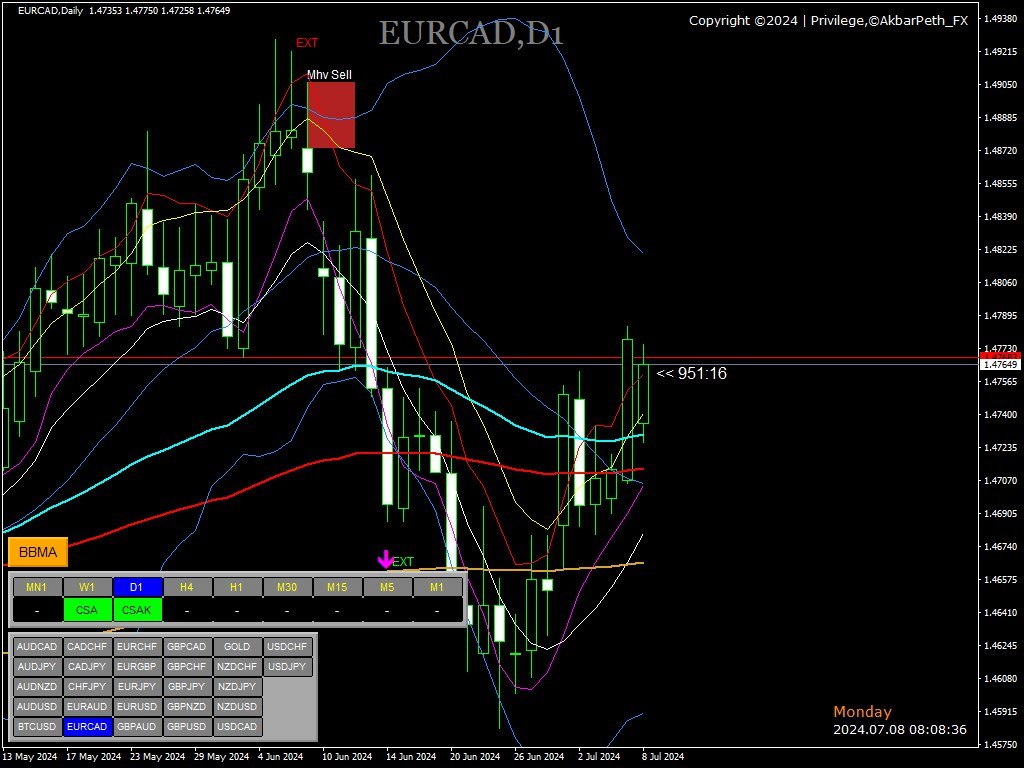
- **Starke Signale:** Der Indikator bringt wichtige Signale im BBMA-System wie **CSAK** (Kerzenstarker Richtung) und **MHV** (Marktverlustvolumen). Das **CSAK**-Signal zeigt das Vorhandensein einer Kerze mit starker Richtung an, während das **MHV**-Signal darauf hinweist, dass der Markt Handelsvolumen verliert.

Handelssetups:
BBMA Strukturführer stellt auch zwei wichtige Handelssetups vor, nämlich **MHV-Setup** (Marktverlustvolumen) und **Reentry**. Das MHV-Setup zeigt an, wann der Markt sein Volumen verliert und instabile Marktbedingungen aufzeigt. Reentry ist ein Setup, das Ihnen hilft, nach Preiskorrekturen wieder in den Markt einzusteigen.

Aktualisierungen:
Wir verpflichten uns, BBMA Strukturführer kontinuierlich weiterzuentwickeln, um in den sich ständig ändernden Marktbedingungen relevant zu bleiben. Wir werden diesen Indikator regelmäßig mit der neuesten Version aktualisieren, einschließlich neuer Funktionen und notwendiger Verbesserungen, um Ihr Handelserlebnis zu verbessern.

Mit den Signalen und Setups von BBMA Strukturführer können Sie potenzielle Handelsmöglichkeiten identifizieren, ohne sofortige Gewinne zu versprechen oder übertriebene Behauptungen zu machen. Holen Sie sich diesen Indikator jetzt und seien Sie "Einen Schritt voraus" in Ihrem Handel.
Empfohlene Produkte
Moving Pivot Average    The pivot indicator compares the selected period with its counterpart from the previous period. The indicator uses very flexible algorithm for pivot value calculating. It allows you to allocate in days a certain time intervals (custom bars) and calculate the average pivot value based on High, Low and Close prices of these bars. How many custom bars will be taken into account is determined by the "Days" setting. The pivot line can be considered an average trend line and us
Considering the main theories of Forex (Dow Theory, support lines, chart patterns, and Fibonacci retracements), It tells you the price range where whales (large investors) are likely to appear. You can trade at the price points that professionals also aim for. You no longer have to warry about where to aim next. We are live-streaming the actual operation of the system. Please check for yourself if it is usable. Please check it out for yourself. https://www.youtube.com/@ganesha_forex We do no
Wir stellen Ihnen den Donchian Channels Indikator für MQL4 vor, ein leistungsstarkes technisches Analysewerkzeug, das darauf abzielt, Ihren Handelserfolg zu steigern. Dieser Indikator besteht aus vier Linien, die die oberen und unteren Grenzen der Preisbewegung über einen bestimmten Zeitraum darstellen. Mit dem Donchian Channels Indikator können Sie potenzielle Ausbrüche und Umkehrungen auf dem Markt leicht identifizieren. Die obere Linie zeigt das höchste Hoch des festgelegten Zeitraums an, wäh
Summer 40% discount ($149 -> $88) Everything for chart Technical Analysis indicator mt4 in one tool Draw your supply demand zone with rectangle and support resistance with trendline and get alerts to mobile phone or email alert -  Risk reward indicator Video tutorials, manuals, DEMO download   here .  Find contacts on my   profile . 1.   Extended rectangles and trendlines Object will be extended to the right edge of the chart when price will draw new candles on chart. This is rectangle extend
Intro to APAMI, PROfessional edition Trace exactly how far prices trend between two price levels with fractional pip precision, while qualifying price movement between the same price levels. Completely automate when trends change direction and volatility, without any lag .  This is possible because the Accurate Price Action Measurement Indicator (APAMI) actually does what no other indicator can:  measure price distance between two points and simultaneously qualify the price action that occurs
Anzeigename: Double Joker Beschreibung des Indikators: 1. Geeignet für EURUSD, niedriges Differenzkonto. 2. Die gelbe Linie und die rote Linie erreichen über 90+und kreuzen 90 gleichzeitig, was das Verkaufssignal ist. 3. Die gelbe Linie und die rote Linie erreichen unter 5 und kreuzen 10 gleichzeitig, was das Kaufsignal ist. 4. Der Profit Stop und Loss Stop müssen gesetzt werden. 5. Die Kombination von M1 und M5 ist effektiver.
Dies ist ein originelles, agiles und ausgezeichnetes Trending-System. Egal, ob Sie ein Anfänger im Trading oder ein professioneller Trader sind, diese Indikatoren können Ihnen helfen, die neuesten Veränderungen der Markttrends schnell und zeitnah zu verfolgen. Es hat folgende Eigenschaften: Die Bedienung ist denkbar einfach, Plug-and-Play, und die Darstellung aller Trendanalyseergebnisse ist auf einen Blick übersichtlich; Keine Notwendigkeit, funktionale Parameter zu konfigurieren, Trendverfolg
Dear Trader It is my pleasure to introduce to you my tool called the " Forex Sniper Indicator" . The major aim of this tool is to help serious traders and investors in all type of Financial Markets to catch price next movement right at the moment the price direction is about to change. This tool can be used to snipe the price direction in both down trend, uptrend and ranging markets. This tool can be used as the stand alone tool though it may be combined with other tools as well. My goal is to h
CCI Phases Indicator
Ihab Mohamed Kamal Fouda
Introduction  The Commodity Channel Index, commonly known as the CCI, is a versatile indicator used by traders and investors to identify cyclical trends in commodities, stocks, and other securities. It was developed by Donald Lambert in 1980, primarily for commodity trading, but has since found widespread application in various financial markets. The CCI is particularly favored for its ability to gauge overbought and oversold levels in price movements. Historical Background  Donald Lambert, the
Sell Signall
Dmitriy Kashevich
This indicator is named so for a reason, because it will show the reverse side of the market. It has several math indicators built in that are tuned to show the best signals for currency pairs! Ideally proved to be in work on the M5-M15 no more and no less! Only at the same time it shows up to 86.5% of correct signals! The settings include the colors of the arrows, the alert, and the same parameters so that you can reconfigure the indicator and trade on cryptocurrency and raw materials!
The Trend Professor is a moving average based indicator designed for the purpose of helping the community of traders to analyse the price trend. The indicator will be displayed in the main chart as it is indicated on the screenshot section. How it works The indicator has lines of moving averages and colored histograms to depict the direction of the trend. There will be a fast signal line colored blue/yellow/red at some points. The red/yellow colored lines stands for bearish trend/signal while th
If you wish to draw Support and Resistance lines, view: daily market opening, classical pivot levels, Fibonacci pivot levels, trend lines, Fibonacci levels, the remaining time to candle closing, and current spread. If you seek to place your orders with the exact lot that meets your desired stop loss risk. If you wish to do all this and more with just one click, then this is the perfect tool to use. This tool will allow you to feel more relaxed when deciding to open orders, as well as predicting
This system never paints.   This system created by using Envolpes bands and reverse bar count.   This indicator is only working in M5 period.   This system is for long term and profitable.   Signals are shown as arrows. as an optional limit orders.   You can set a voice alarm or email notification.   You can fins our other products from link : https://www.mql5.com/en/users/drbastem/seller   Also, you can ask all your questins from email : haskayafx@gmail.com or mobile : +90 530 867 5076 or @Meh
Thư viện này bao gồm: * Mã nguồn struct của 5 cấu trúc cơ bản của MQL4: + SYMBOL INFO + TICK INFO + ACCOUNT INFO * Các hàm cơ bản của một robot + OrderSend + OrderModify + OrderClose * String Error Runtime Return * Hàm kiểm tra bản quyền của robot, indicator, script * Hàm init dùng để khởi động một robot chuẩn * Hàm định dạng chart để không bị các lỗi nghẽn bộ nhớ của chart khi chạy trên VPS * Hàm ghi dữ liệu ra file CSV, TXT * Hỗ trợ (mã nguồn, *.mqh): dat.ngtat@gmail.com
Algo Trading Indicaor  With this indicator , you’ll have zones and trends that hight probability the price will reverse from it. so will gives you all the help that you need  Why should you join us !?  1-This indicator is logical since it’s working in previous days movement , to predict the future movements. 2-Algo trading indicator will help you to draw trends which is special and are too strong than the basics trend , trends will change with the frame time that you work on . 3-We can
Supply and Demand Indicator + FREE Currency Strength Meter ADD-ON Looking for a powerful tool that can help you identify the most reactive zones in the forex market? Our supply and demand indicator for MetaTrader 4 and 5 is exactly what you need. With its advanced algorithms and real-time analysis, this indicator helps traders of all experience levels make informed trading decisions. The supply and demand indicator is a cutting-edge tool that helps traders identify areas where buyers and seller
JR Trend
Jefr Alnafey
with JR Trend you will able to enter and exit every trade with just a signals appear no need for any strategy just flow the indicator it work on all pairs and all Timeframe i usually take a look on higher timeframe and return to the lowest  timeframe and make an order with indicator signals you can see the amazing result so you can depend only on it intraday or swing as you wish   
F ully automated Expert Advisor using the  advanced   algorithm for trading the EURUSD Designed for profit in a short period of time and big profit in a long run. Prefers EURUSD 1H. Principle of operation The SELL and BUY orders are opened (depending on the parameters set), guided by signals and the market situation.     Recommended parameter: Use an ECN broker account. minimum deposit of 100$ USD. use it in H1 time frame recommended symbol is EURUSD input parameter: TrendType               
TREND HARMONY MT4 –  Multi Timeframe Trend and Phase and Pullback Level Visualizer indicator for Metatrader4 The TREND HARMONY indicator automates deep trend analysis and generates visualizations for you. Take control of your trades by eliminating uncertainty! Revolutionize your trading experience with precision and insight through the TREND HARMONY Multi Timeframe Trend Indicator – your ultimate MT4 trend visualization indicator. Are you tired of missing trading opportunities or consistently e
Ugenesys AI MT4
Odaine Ramon Mcmillan
3 (2)
uGenesys AI - 90% Accurate Daytrading Indicator Introducing the ultimate forex trading indicator system, uGenesys AI, powered by cutting-edge AI technology and advanced analytical techniques, including Time-Series Analysis and Genetic Algorithms. Our AI-powered trading system leverages the power of time-series analysis to identify trends and patterns in historical price data, allowing traders to make informed predictions about future market movements. By analyzing vast amounts of data, our sys
Trend Divergence Indicator: Your Essential Tool for Market Analysis The Trend Divergence Indicator is a powerful tool designed to assist traders in identifying market trends and pinpointing entry points with precision. By leveraging price divergence, this indicator enhances your trading strategy, offering reliable insights and filtering unnecessary signals. Key Features and Benefits of the Trend Divergence Indicator Accurate Trend Analysis: The Trend Divergence Indicator uses price divergence t
Summary This indicator is based on RSI and Momentum indicators. It also considers moving averages of these two indicators. The three indicators have adjustable settings. The arrows do not repaint since the indicator only uses confirmed values and waits for the candle to close before painting an arrow. The indicator is also able to alert when arrows appear. There are 3 types of alerts - Popup, Email and Mobile Push Notifications. The arrows can be used in the EA and the inputs can also be optimiz
FREE
Trend Transition is a hybrid indicator, as it is based on signals from several well-known products: RSI and MA. MA is a trend indicator of the average true range, which determines the range of minimum and maximum price fluctuations, as well as closing prices. RSI is an indicator of the family of oscillators. The indicator helps to calculate the oversold and overbought levels of a trading instrument. When a trend changes, the Trend Transition indicator uses a color alarm: blue - when changing
Trend Analysis in act
Ihab Mohamed Kamal Fouda
The Trend Analysis Indicator is an innovative tool designed for traders and investors who seek to navigate the complexities of the financial markets with greater precision and insight. This powerful indicator is engineered to adeptly identify whether a market is trending or not, offering users a vital edge in their trading strategy. Key Features: Accurate Trend Detection : The core functionality of the Trend Analysis Indicator lies in its ability to accurately detect market trends. It analyzes p
Pyro Trend
Oleksii Ferbei
Pyro Trend is a new product that allows you to identify the current market phase (uptrend, downtrend or flat). The indicator is applicable for any data and periods. The middle of the trend wave, as well as the edges, are places of special heat and market behavior; when writing the indicator, an attempt was made to implement precisely finding the middle. Pyro Trend is a trend indicator that uses an original calculation algorithm. This indicator paints arrows in different colors depending on th
Golden Range 2
Damian Mateusz Wojtowicz
Golden Range 2 is one of the top entry indicators securing its future with its results.  Indicator settings: Points = how precise pattern detection is AlertConfirmation = turn on(true) off(false) alert CalculatedBars = how many bars will be calculated Please leave Positive comments, reviews. Buffer 0 Buy Arrow, Buffer 1 Sell Arrow, Buffer2 Buy Signal(Value:1/0), Buffer3 Sell Signal(Value:1/0)  Buy Green, Sell Red
Moving pivot Average Fibonacci The  indicator compares the selected period with its counterpart from the previous period. The indicator determines the moving Fibonacci levels for the day or any time interval to assess the price movement range from the time average. The indicator helps predict the expected high or low for the day based on historical time data. The pivot line can be considered an average trend line and use it in a variety of trading strategies. If you have any question about t
Primary Trend is a handy tool if you are used to trading on a clean chart, but sometimes you need to take a look at Primary Trend. The Primary Trend indicator studies price action as a collection of price and time vectors, and uses the average vector to determine the direction and strength of the market. This indicator highlights the short-term direction and strength of the market. The indicator is not redrawn. The indicator implements a breakout strategy. The arrows show the direction of the ma
MartingaleArrow
Abdulkarim Karazon
Martingale Arrow ist ein mt4-Indikator vom Typ Pfeil, der für den Handel mit Martingale-Binäroptionen entwickelt wurde. Dieser Pfeil wird auf den offenen Balken/Intrabalken gedruckt und gibt eine Warnung aus. ANWENDUNG: Öffnen Sie den Handel, sobald der Pfeil erscheint. Wenn der Handel gewonnen hat, warten Sie auf das nächste Signal und handeln Sie mit demselben Lot. Wenn der Handel beim nächsten Signal das doppelte Los verliert und so weitermacht, bis ein Signal gewinnt, dann zurücksetzen und
Holy Trinity Volatility Indicator This indicator reflects the peak time of the day wherein there's is expected to be sharp price actions. It also presents the markets as just waking up from the dull and less volatile Asian (and or London) trading sessions into a bustling time of highly liquid price flows. NOTE: This indicator informs the trader ahead of peak price movements - one bar just before the real actions starts. Enter when the volatility line falls below the Tripple Exponential Moving Av
Käufer dieses Produkts erwarben auch
Gold Stuff
Vasiliy Strukov
4.9 (270)
Gold Stuff-Ein Trendindikator, der speziell für Gold entwickelt wurde, kann auch auf allen Finanzinstrumenten verwendet werden. Der Indikator wird nicht neu gezeichnet und verzögert sich nicht. Empfohlener Zeitrahmen H1. Nach diesem Indikator geschrieben EA Gold Stuff Berater, können Sie es in meinem Profil finden. WICHTIG! Kontaktieren Sie mich sofort nach dem Kauf, um Anweisungen und Bonus zu erhalten!   Sie können eine kostenlose Kopie unseres Strong Support- und Trendscanner-Indikators
BITTE LESEN SIE DIE INFORMATIONEN UNTEN, BEVOR SIE DAS PRODUKT KAUFEN! Apollo Pips PLUS SP ist ein einzigartiges Produkt! ES IST FÜR ALLE, DIE MEINEN NEUEN „APOLLO PIPS“-INDIKATOR PLUS „SUPER PACK“-BONUS MIT ZUGRIFF AUF ALLE MEINE HANDELSINDIKATOREN ERHALTEN MÖCHTEN! Mit dem Kauf des Produkts Apollo Pips PLUS SP erwerben Sie tatsächlich eine völlig neue Version meines Apollo Pips-Indikators. Diese Version des Indikators verfügt über einen verbesserten Algorithmus und einen benutzerfreundlichen P
Scalper Inside PRO
Alexey Minkov
4.75 (60)
An exclusive indicator that utilizes an innovative algorithm to swiftly and accurately determine the market trend. The indicator automatically calculates opening, closing, and profit levels, providing detailed trading statistics. With these features, you can choose the most appropriate trading instrument for the current market conditions. Additionally, you can easily integrate your own arrow indicators into Scalper Inside Pro to quickly evaluate their statistics and profitability. Scalper Inside
TPSproTREND PrO
Roman Podpora
4.79 (19)
TPSpro TREND PRO   ist ein Trendindikator, der den Markt automatisch analysiert und Informationen über den Trend und jede seiner Änderungen liefert sowie Signale für den Einstieg in Geschäfte ohne Neuzeichnung gibt! Der Indikator verwendet jede Kerze und analysiert sie separat. bezieht sich auf verschiedene Impulse – Aufwärts- oder Abwärtsimpuls. Exakte Einstiegspunkte in Transaktionen für Währungen, Krypto, Metalle, Aktien, Indizes! Version MT5                   VOLLSTÄNDIGE BESCHREIBUNG DES
Atomic Analyst
Issam Kassas
5 (3)
Zunächst einmal ist es erwähnenswert, dass dieser Handelsindikator nicht neu malt, nicht neu zeichnet und keine Verzögerung aufweist, was ihn sowohl für manuellen als auch für Roboterhandel ideal macht. Benutzerhandbuch: Einstellungen, Eingaben und Strategie. Der Atom-Analyst ist ein PA-Preisaktionsindikator, der die Stärke und das Momentum des Preises nutzt, um einen besseren Vorteil auf dem Markt zu finden. Ausgestattet mit fortschrittlichen Filtern, die helfen, Rauschen und falsche Signale z
Gold Channel is a volatility-based indicator, developed with a specific timing algorithm for the XAUUSD pair, which consists of finding possible corrections in the market. This indicator shows two outer lines, an inner line (retracement line) and an arrow sign, where the theory of the channel is to help identify overbought and oversold conditions in the market. The market price will generally fall between the boundaries of the channel. If prices touch or move outside the channel it is a tra
Derzeit 20% Rabatt! Die beste Lösung für jeden Neueinsteiger oder Expert Händler! Dieses Dashboard arbeitet mit 28 Währungspaaren. Es basiert auf 2 unserer Hauptindikatoren (Advanced Currency Strength 28 und Advanced Currency Impulse). Es bietet einen hervorragenden Überblick über den gesamten Forex-Markt. Es zeigt die Werte der Advanced Currency Strength, die Veränderungsrate der Währungen und die Signale für 28 Devisenpaare in allen (9) Zeitrahmen. Stellen Sie sich vor, wie sich Ihr Hande
PZ Day Trading
PZ TRADING SLU
3.67 (3)
Dieser Indikator erkennt Preisumkehrungen im Zick-Zack, wobei nur Preisaktionsanalysen und ein Donchian-Kanal verwendet werden. Es wurde speziell für den kurzfristigen Handel entwickelt, ohne dass ein Nachlackieren oder ein Backpainting erforderlich ist. Es ist ein fantastisches Werkzeug für clevere Trader, die darauf abzielen, das Timing ihrer Operationen zu verbessern. [ Installationsanleitung | Update-Anleitung | Fehlerbehebung | FAQ | Alle Produkte ] Erstaunlich einfach zu handeln Es bi
NAM Order Blocks
NAM TECH GROUP, CORP.
5 (1)
MT4-Erkennungsanzeige für Auftragsblöcke mit mehreren Zeitrahmen. Eigenschaften - Vollständig anpassbar auf dem Diagrammbedienfeld, bietet vollständige Interaktion. - Verstecken und zeigen Sie das Bedienfeld, wo immer Sie möchten. - Erkennen Sie OBs in mehreren Zeiträumen. - Wählen Sie die anzuzeigende OB-Menge aus. - Verschiedene OBs Benutzeroberfläche. - Verschiedene Filter an OBs. - OB-Näherungsalarm. - ADR High- und Low-Leitungen. - Benachrichtigungsdienst (Bildschirmwar
Enigmera
Ivan Stefanov
5 (4)
ENIGMERA: Der Kern des Marktes https://www.enigmera.com Einführung Dieser Indikator und dieses Handelssystem sind ein bemerkenswerter Ansatz für die Finanzmärkte. ENIGMERA nutzt die fraktalen Zyklen zur genauen Berechnung von Unterstützungs- und Widerstandsniveaus. Er zeigt die echte Akkumulationsphase an und gibt Richtung und Ziele vor.  Ein System, das funktioniert, egal ob wir uns in einem Trend oder in einer Korrektur befinden.  Wie funktioniert es? ENIGMERA besteht aus drei Linien: der
PZ Trend Trading
PZ TRADING SLU
4.8 (5)
Trend Trading ist ein Indikator, der so weit wie möglich von den Markttrends profitiert, indem er Pullbacks und Breakouts zeitlich festlegt. Sie findet Handelsmöglichkeiten, indem sie analysiert, was der Preis während etablierter Trends tut. [ Installationsanleitung | Update-Anleitung | Fehlerbehebung | FAQ | Alle Produkte ] Handeln Sie mit Zuversicht und Effizienz an den Finanzmärkten Profitieren Sie von etablierten Trends, ohne ins Wanken zu geraten Profitable Pullbacks, Ausbrüche und vor
TPSpro RFI Levels
Roman Podpora
4.83 (24)
Umkehr der ersten Impulsniveaus (RFI)       ANWEISUNGEN       Russland       -        ENG    Die Empfehlung basiert auf dem Indikator -   TPSpro   TREND PRO -   Version MT5 Die wichtigsten Elemente in der Branche sind entweder in Zonen oder in der Fabrik enthalten, oder sie führen zu einer Lösung bei einem Kauf oder dem Verkauf eines anderen Instruments. Wenn viele Menschen ihre Rechte nicht auf dem Händlerkonto verschlüsseln, werden die Folgen nicht schnell genug sein. Ich habe es damit abgesc
Connect Indicator
Sukunthakan Ngernbamrung
Connect Indicator is a tool used for connecting indicators between the MQL market and MT4. The connected indicators are made by our group and can be used for other applications, such as sending messages to the Line application or Telegram application. If you have any questions, please don't hesitate to ask us to receive support. Function and indicator buffer Buffer one is the high price of the previous candle. Buffer two is the high price of the previous candle. Usage To connect indicators to fu
Entry Points Pro
Yury Orlov
4.7 (226)
Dies ist ein Indikator für MT4, der genaue Signale für den Einstieg in einen Handel ohne Repainting (Neuzeichnen) liefert. Er kann auf alle Finanzwerte angewendet werden: Forex, Kryptowährungen, Metalle, Aktien, Indizes. Er liefert ziemlich genaue Schätzungen und sagt Ihnen, wann es am besten ist, eine Position zu eröffnen und zu schließen. Sehen Sie sich das Video (6:22) mit einem Beispiel für die Verarbeitung nur eines Signals an, das sich für den Indikator gelohnt hat! Die meisten Händler ver
Volatility Trend System – ein Handelssystem, das Signale für Einstiege gibt. Das Volatilitätssystem liefert lineare und punktuelle Signale in Richtung des Trends sowie Signale zum Verlassen des Trends, ohne Neuzeichnung und Verzögerungen. Der Trendindikator überwacht die Richtung des mittelfristigen Trends, zeigt die Richtung und deren Änderung an. Der Signalindikator basiert auf Änderungen der Volatilität und zeigt Markteintritte an. Der Indikator ist mit mehreren Arten von Warnungen ausgest
Der Forex TPA Indikator deckt die wahren Aktionen der Marktmacher auf, immer dann wenn sie passieren. "Kämpfe nicht gegen die Marktmacher an, sondern folge ihnen", ist wohl der beste Rat, den ein Trader bekommen kann. Der TPA Indikator zeigt jedesmal seine Signale an wenn die Bullen definitiv stärker sind als die Bären und umgekehrt. Dieser Indikator wurde VON Tradern FÜR Trader gemacht und ist 100% NICHT NACHZEICHNEND! Signale werden STRENG am Schluss einer Kerze  generiert. Das sagen unsere Ku
Currency Strength Exotics
Bernhard Schweigert
4.88 (33)
Stärke von 8 Währungen plus EIN EXOTISCHES Paar oder Rohstoffe oder Indexe! Jedes Produkt kann als 9. Linie hinzugefügt werden. Fügen Sie Rohstoffe, Indexes oder exotische Währungen hinzu (Gold, Silber, Öl, DAX, US30, MXN, TRY, CNH ...). Eine neue noch nie dagewesene TRADING STRATEGIE  !!! Dieser Indikator ist einzigartig, weil wir eine Reihe von proprietäre Funktionen und neue Formeln eingebaut haben. Es funktioniert für alle Zeitrahmen. Basierend auf neuen zugrunde liegenden Algorithmen ist
Der Indikator zeigt die am besten geeigneten Einstiegs- und Ausstiegspunkte an. Er zeigt auch statistische Daten zu allen Signalen an, um den Handel besser analysieren zu können. Mit Hilfe dieses Indikators werden Sie den Markt besser verstehen können. Sobald sich die Kraft des Trends abzuschwächen beginnt (dies wird auf dem Panel angezeigt), bewegt sich die Trendlinie in die Horizontale - dies ist das Signal zum Ausstieg aus dem Handel. Oder Sie können aussteigen, wenn das durchschnittliche
RelicusRoad Pro
Relicus LLC
4.73 (141)
Jetzt 147 US -Dollar (nach ein paar Aktualisierungen auf 499 US -Dollar) - Unbegrenzte Konten (PCs oder MACs) RelicusRoad Benutzerhandbuch + Schulungsvideos + Zugang zur privaten Discord-Gruppe + VIP-Status EINE NEUE ART, DEN MARKT ZU BETRACHTEN RelicusRoad ist der weltweit leistungsstärkste Handelsindikator für Forex, Futures, Kryptowährungen, Aktien und Indizes und gibt Händlern alle Informationen und Tools, die sie benötigen, um profitabel zu bleiben. Wir bieten technische Analysen un
Wir stellen vor       Quantum Trend Sniper Indicator   , der bahnbrechende MQL5-Indikator, der die Art und Weise, wie Sie Trendumkehrungen erkennen und handeln, verändert! Entwickelt von einem Team erfahrener Händler mit über 13 Jahren Handelserfahrung,       Quantum Trend Sniper-Indikator       wurde entwickelt, um Ihre Trading-Reise mit seiner innovativen Methode zur Identifizierung von Trendumkehrungen mit extrem hoher Genauigkeit auf ein neues Niveau zu heben. ***Kaufe Quantum Trend Snipe
FX Volume
Daniel Stein
4.61 (36)
Erhalten Sie Ihr tägliches Marktupdate mit Details und Screenshots über unser Morning Briefing hier auf mql5 und auf Telegram ! FX Volume ist der ERSTE und EINZIGE Volumenindikator, der einen ECHTEN Einblick in die Marktstimmung aus Sicht eines Brokers bietet. Es bietet fantastische Einblicke in die Positionierung von institutionellen Marktteilnehmern, wie z.B. Brokern, auf dem Forex-Markt, viel schneller als COT-Berichte. Diese Informationen direkt auf Ihrem Chart zu sehen, ist der wahre Game
XQ Indicator MetaTrader 4
Marzena Maria Szmit
3.67 (3)
Step into the realm of Forex trading with confidence and precision using XQ, a cutting-edge Forex indicator designed to elevate your trading game to unprecedented heights. Whether you're a seasoned trader or just stepping into the world of currency exchange,   XQ Forex Indicator   empowers you with the insights and signals needed to make informed trading decisions. The signal conditions are a combination of three indicators, and XQ Forex Indicator only display  medium and long-term trends . The
Gann Time Clusters
Martin Eshleman
2.5 (2)
Gann Time Clusters Indicator This indicator is based on W. D. Gann's Square of 9 method for the time axis. It uses past market reversal points and applies the mathematical formula for Gann's Square of 9 and then makes projections into the future. A date/time where future projections line up is called a 'time cluster'. These time clusters are drawn as vertical lines on the right side of the chart where the market has not advanced to yet. A time cluster will result in a market reversal point (ex.
Ultimate Sniper Dashboard
Hispraise Chinedum Abraham
4.85 (27)
Ermäßigt auf $299! Die Preise können in Zukunft steigen! Lesen Sie die Beschreibung unten! Bestes Einstiegssystem für Ultimate Sniper Dashboard: ULTIMATIVE DYNAMISCHE EBENEN. (Bitte überprüfen Sie meine Produkte) Das Ultimate Sniper Dashboard funktioniert NUR auf Live-Märkten aufgrund der MT4 Multicurrency Testlimits. Wir stellen Ihnen das Ultimate-Sniper Dashboard vor! Unser bestes, das sowohl HA-Sniper, MA-Sniper und viele spezielle Modi enthält. Das Ultimate Sniper Dashboard ist ein
Indicator : RealValueIndicator Description : RealValueIndicator is a powerful tool designed specifically for trading on the EURUSD pair. This indicator analyzes all EUR and USD pairs, calculates their real currency strength values, and displays them as a single realistic value to give you a head start on price. This indicator will tell you moves before they happen if you use it right. RealValueIndicator allows you to get a quick and accurate overview of the EURUSD currency pair tops and bottoms,
GOLD Impulse with Alert
Bernhard Schweigert
4.56 (9)
Dieser Indikator ist eine hervorragende Kombination aus unseren 2 Produkten Advanced Currency IMPULSE with ALERT  +   Currency Strength Exotics . Es funktioniert für alle Zeitrahmen und zeigt grafisch Impulse der Stärke oder Schwäche für die 8 wichtigsten Währungen plus ein Symbol! Dieser Indikator ist darauf spezialisiert, die Beschleunigung der Währungsstärke für beliebige Symbole wie Gold, Exotische Paare, Rohstoffe, Indizes oder Futures anzuzeigen. Als erster seiner Art kann jedes Sym
Cycle Sniper
Elmira Memish
4.41 (39)
NEW YEAR SALE PRICE FOR LIMITED TIME!!! Please contact us after your purchase and we will send you the complimentary indicators to complete the system Cycle Sniper is not a holy grail but when you use it in a system which is explained in the videos, you will feel the difference. If you are not willing to focus on the charts designed with Cycle Sniper and other free tools we provide, we recommend not buying this indicator. We recommend watching the videos about the indiactor and system before pu
Best Currency Strength Indicator
Tumelo Patrick Rakotsoane
4.6 (48)
Advanced Currency Strength Indicator The Advanced Divergence Currency Strength Indicator. Not only it breaks down all 28 forex currency pairs and calculates the strength of individual currencies across all timeframes , but, You'll be analyzing the WHOLE forex market in 1 window (In just 1 minute) . This indicator is very powerful because it reveals the true movements of the market.  It is highly recommended to  analyze charts knowing the performance of individual currencies or the countries ec
How to use Pair Trading Station Pair Trading Station is recommended for H1 time frame and you can use it for any currency pairs. To generate buy and sell signal, follow few steps below to apply Pair Trading Station to your MetaTrader terminal. When you load Pair Trading Station on your chart, Pair Trading station will assess available historical data in your MetaTrader platforms for each currency pair. On your chart, the amount of historical data available will be displayed for each currency pai
The indicator is designed to work on any trading platform. The program is based on proprietary algorithms and W.D.Ganna's mathematics, allowing you to calculate target levels of price movement based on three points with the highest degree of certainty. It is a great tool for stock trading. The indicator has three buttons: NEW - call up a triangle for calculation. DEL - delete the selected triangle. DELS - completely remove all constructions. The probability of achieving the goals is more than 80
Weitere Produkte dieses Autors
HANDEL INTRADAY EA- Forex Robot MT4. Möglicherweise haben Sie mehrere verschiedene EAs ausprobiert und nicht alle haben Ihren Erwartungen entsprochen. Wir möchten Sie einladen, sich unser System anzusehen, um zu sehen, wie der EA funktioniert. Der TRADING INTRADAY EA ist einer der besten Forex-Roboter, die Sie auf dem Markt finden werden. Nachdem Sie Ihren Kauf abgeschlossen haben, kontaktieren Sie uns bitte, damit wir Ihnen eine detaillierte Beschreibung senden können. Dies ist eine Strategi
Auswahl:
Keine Bewertungen
Antwort auf eine Rezension
Version 1.27 2024.07.08
Indicator Update - Latest Version
We are pleased to announce the latest update to our indicator, featuring a more interactive dashboard:

Enhanced Interface:

More intuitive and user-friendly dashboard design.
Clearer data visualization with engaging graphics and colors.
Improved Interaction:

Added interactive buttons for quick access to key features.
Faster response to user commands.
Benefits:
Enhanced User Experience: Cleaner and more interactive interface.
Improved Efficiency: Quick access to critical information.
Clear Data Visualization: Facilitates better data understanding.
This update aims to enhance user experience and effectiveness in market analysis.
Version 1.26 2024.07.08
Indicator Update - Latest Version
Update Description:
In the latest version of this indicator, we have made significant updates to improve the accuracy of the MHV and reentry signal calculations. Below are the details of the changes made:

Enhanced Reentry Calculation:

The reentry calculation algorithm has been optimized to detect reentry opportunities more accurately.
New logic has been added to consider conditions such as candle direction and price position relative to key technical indicators ( Moving Average and Bollinger Bands).
Improved accuracy in identifying reentry signals based on multi-timeframe analysis, allowing for better entry point identification.
Improved MHV Accuracy:

The MHV logic has been refined to provide more reliable signals.
New criteria have been added for MHV signal validation to ensure more consistent signals and reduce false positives.
Adjustment of indicator parameters to align with current market conditions, ensuring signal relevance.
Benefits of the Update:
Higher Accuracy: With the improved and optimized reentry and MHV calculations, users can rely on the indicator signals for more precise trading decisions.
Consistent Signals: The use of additional criteria and signal validation helps in reducing signal errors, thereby enhancing consistency in market analysis.
User-Friendly: More intuitive colors and labels make it easier for users to recognize and understand the signals provided by the indicator.
Version 1.25 2024.06.10
Update version 1.25 - with added alerts
Version 1.24 2024.06.03
Bug Fixes:

- Fixed an issue where the dashboard would not load correctly.
- Resolved a bug causing incorrect data display in the dashboard.
- Addressed a problem where the dashboard filters were not functioning.
- Corrected a bug that caused the dashboard to crash under certain conditions.
Version 1.23 2024.06.01
What's New?

Bug Fixes in Dashboard:

Resolved various bugs to ensure a smoother user experience.
Fixed issues causing data display errors and lag in the dashboard.
Enhanced stability to prevent crashes during intensive operations.
Enhanced Usability:

Redesigned user interface for more intuitive navigation.
Simplified settings and options for easier configuration.
Added tooltips and help sections for better guidance.
Performance Optimization:

Streamlined code to reduce resource usage and improve response times.
Implemented efficient algorithms to handle larger datasets with ease.
Minimized load times for faster access and interaction.
New Features:

Introduced customizable alerts and notifications.
Added support for more data sources and formats.
Enhanced visualization options with new chart types and styles.
These updates aim to make the indicator more user-friendly, lightweight, and efficient, providing a seamless experience for all users.
Version 1.22 2024.05.22
error fix update in the dashboard
Version 1.21 2024.05.19
Was ist neu?

Dieses Update macht den Indikator leichter und sorgt für eine schnellere und flüssigere Leistung. Zusätzlich haben wir ein umfassendes Dashboard eingeführt, das es Ihnen ermöglicht, alle Zeitrahmen gleichzeitig zu überwachen, was eine effizientere und benutzerfreundlichere Erfahrung bietet.
Version 1.2 2024.05.12
What's new? : This is the latest version of the indicator, featuring updated calculations for reentry setups and extreme signals.