• Übersicht
  • Bewertungen (1)
  • Diskussion (2)
  • Neue Funktionen

RC Soldiers and Crows MT5

5

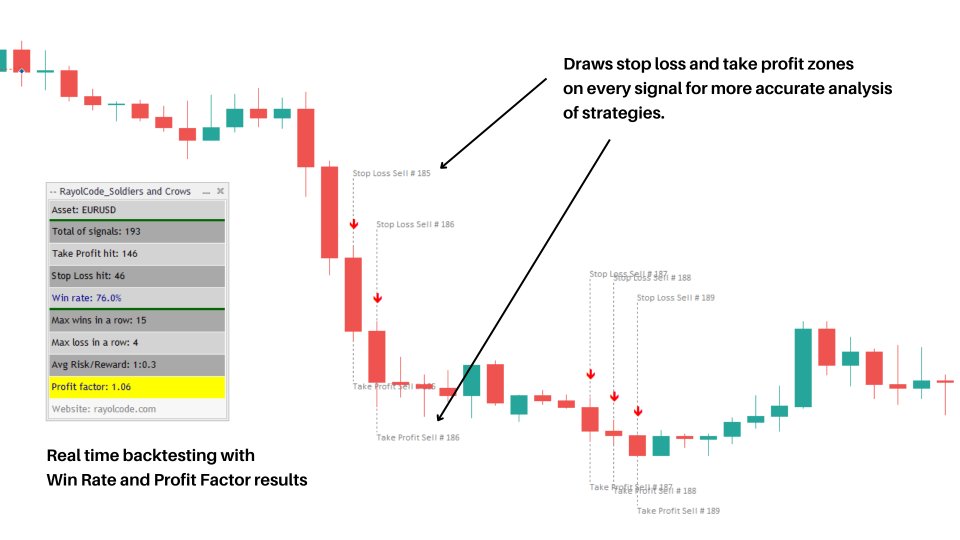
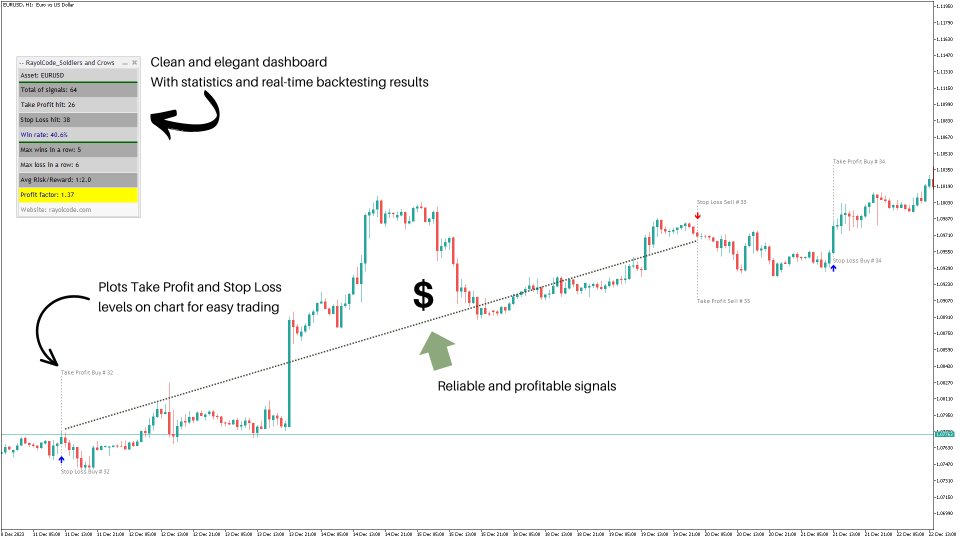
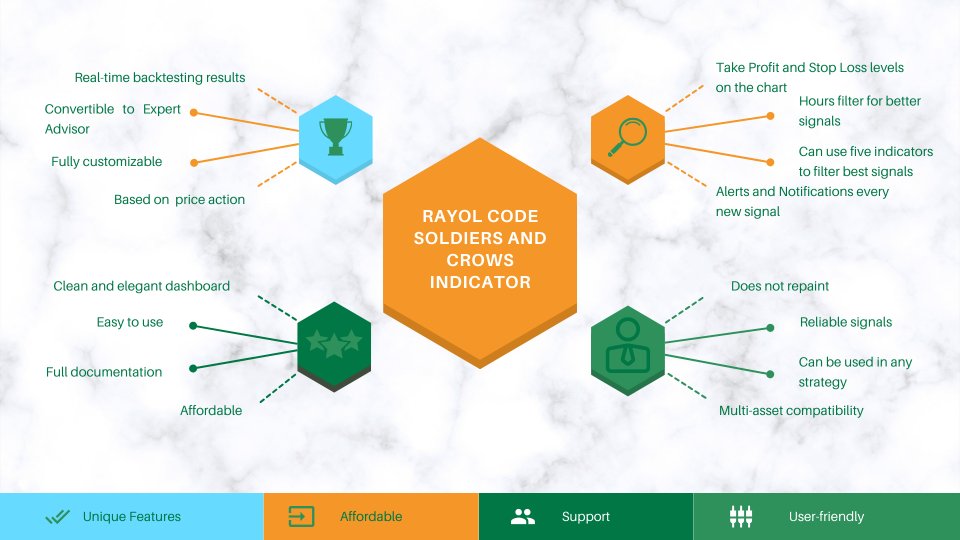
This indicator accurately identifies and informs market reversals and continuation patterns by analyzing and signaling the Three White Soldiers / Three Black Crows pattern. It also offers a "real-time backtesting" panel in the indicator itself in a way that every change made on the indicator parameters will immediately show the user how many signals are occurred, how many take profits and stop losses were hit and, by having these informations, the Win Rate and the Profit Factor of the setup based on the parameters defined by the user.

  • User-friendly interface and multi-asset compatibility
  • Fully customizable parameters and colors
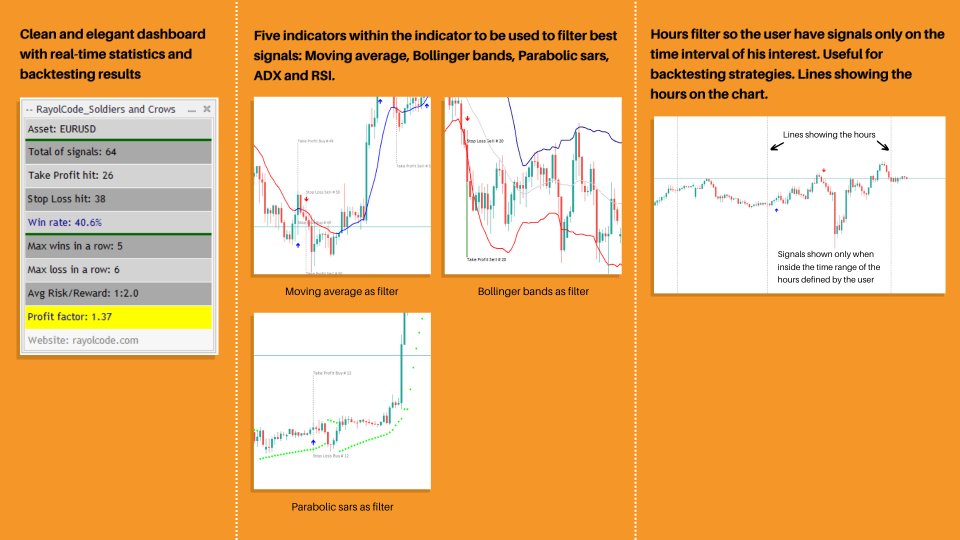
  • Clean panel with real-time backtesting and statistics informations
  • Offers many different traditional indicators to filter the signals (Moving Average, Bollinger Bands, Parabolic Sars, ADX and RSI), allowing them to be used together within the indicator itself to optimize the best signals suitable for the user's strategy and knowledge
  • Time hours filter, so that the user can backtest and have signals only within the time range compatible to his trading routine
  • Displays Take Profit and Stop Loss levels defined by the user based on: a) Fixed points, b) Pivot levels or c) x candles before the signal
  • Switch on/off Alerts and App Notifications when new signals occur
  • Does not repaint
  • Can be easily convert its signals into an Expert Advisor. Full support granted.

FOR MT4 VERSION: CLICK HERE 

//+-------------------------------------------------------------------------+
//|                                  	     RC_Soldiers_Crows_EA_Sample.mq5|
//|                                          Copyright 2024, Francisco Rayol|
//|                                                https://www.rayolcode.com|
//+-------------------------------------------------------------------------+
#property description "RC_Soldiers_Crows_EA_Sample"
#property version   "1.00"
#property strict
#property script_show_inputs

#include <Trade\Trade.mqh>
#include <Trade\PositionInfo.mqh>

CTrade         Ctrade;
CPositionInfo  Cposition;

enum en_options
  {
   Yes = 0,             // Yes
   No = 1,              // No
  };

enum tp_type
  {
   Fixed_tp = 0,        // Fixed Take Profit
   Indicator_tp = 1,    // Take Profit from indicator
  };

enum sl_type
  {
   Fixed_sl = 0,        // Fixed Stop Loss
   Indicator_sl = 1,    // Stop Loss from indicator
  };

//--- input parameters
input int              inMagic_Number = 18272;          // Magic number
//----
input double           inLot_Size = 0.01;               // Initial lot size
//----
input tp_type          inTP_Type = 0;                   // Choose Take Profit method
input double           inTake_Profit = 150.0;           // Fixed Take Profit (in points)
input sl_type          inSL_Type = 0;                   // Choose Stop Loss method
input double           inStop_Loss = 100.0;             // Fixed Stop Loss (in points)
//----
//+------------------------------------------------------------------+
//|                                                                  |
//+------------------------------------------------------------------+
//--- signal handles
int   handle_rc_soldiers_crows;
//--- signal arrays
double RC_Buy_Signal[], RC_Sell_Signal[], RC_Take_Profit[], RC_Stop_Loss[];
//--- global variables
int   initial_bar;

//+------------------------------------------------------------------+
//| Expert initialization function                                   |
//+------------------------------------------------------------------+
int OnInit()
  {
//---
   initial_bar = iBars(_Symbol,_Period);
//---
//--- RC Soldiers and Crows indicator handle
   handle_rc_soldiers_crows = iCustom(_Symbol, PERIOD_CURRENT, "\\Indicators\\Market\\RC_Soldiers_Crows.ex5");
   if(handle_rc_soldiers_crows == INVALID_HANDLE)
     {
      Print("Error getting information from \"RC_Soldiers_Crows\" indicator, check input parameters and try again");
      Alert("Error getting information from \"RC_Soldiers_Crows\" indicator, check input parameters and try again");
      return(INIT_FAILED);
     }
//---
   ArraySetAsSeries(RC_Buy_Signal, true);
   ArraySetAsSeries(RC_Sell_Signal, true);
   ArraySetAsSeries(RC_Take_Profit, true);
   ArraySetAsSeries(RC_Stop_Loss, true);
//---
   Ctrade.SetExpertMagicNumber(inMagic_Number);
//---
   return(INIT_SUCCEEDED);
  }
//+------------------------------------------------------------------+
//| Expert deinitialization function                                 |
//+------------------------------------------------------------------+
void OnDeinit(const int reason)
  {
//---
   Comment("");
  }
//+------------------------------------------------------------------+
//| Expert tick function                                             |
//+------------------------------------------------------------------+
void OnTick()
  {

//--- Ask and Bid prices
   double Ask = SymbolInfoDouble(_Symbol,SYMBOL_ASK);
   double Bid = SymbolInfoDouble(_Symbol,SYMBOL_BID);
//+------------------------------------------------------------------+
//--- Indicator Signals
//--- RC_Soldiers_Crows signal: buy
   if(CopyBuffer(handle_rc_soldiers_crows,0,0,2,RC_Buy_Signal)<=0) // Buy signal
     {
      Print("Getting RC_Soldiers_Crows data is failed! Error ",GetLastError());
      return;
     }
//--- RC_Soldiers_Crows signal: sell
   if(CopyBuffer(handle_rc_soldiers_crows,1,0,2,RC_Sell_Signal)<=0) // Sell signal
     {
      Print("Getting RC_Soldiers_Crows data is failed! Error ",GetLastError());
      return;
     }
//--- RC_Soldiers_Crows signal: take profit
   if(CopyBuffer(handle_rc_soldiers_crows,10,0,2,RC_Take_Profit)<=0) // Take Profit price
     {
      Print("Getting RC_Soldiers_Crows data is failed! Error ",GetLastError());
      return;
     }
//--- RC_Soldiers_Crows signal: stop loss
   if(CopyBuffer(handle_rc_soldiers_crows,11,0,2,RC_Stop_Loss)<=0) // Stop Loss price
     {
      Print("Getting RC_Soldiers_Crows data is failed! Error ",GetLastError());
      return;
     }
//+------------------------------------------------------------------+
//---
   if(!F_CheckOpenOrders() && initial_bar!=iBars(_Symbol,_Period))
     {
      if(RC_Buy_Signal[1] != 0.0 && RC_Buy_Signal[1] != EMPTY_VALUE)
        {
         if(Ctrade.Buy(inLot_Size, _Symbol, Ask, inSL_Type == 0 ? Bid - inStop_Loss*_Point : RC_Stop_Loss[1],
                       inTP_Type == 0 ? Ask + inTake_Profit*_Point : RC_Take_Profit[1],"Buy open"))
           {
            initial_bar = iBars(_Symbol,_Period);
           }
         else
            Print("Error on opening buy position :"+IntegerToString(GetLastError()));
        }
      else
         if(RC_Sell_Signal[1] != 0.0 && RC_Sell_Signal[1] != EMPTY_VALUE)
           {
            if(Ctrade.Sell(inLot_Size, _Symbol, Bid, inSL_Type == 0 ? Ask + inStop_Loss*_Point : RC_Stop_Loss[1],
                           inTP_Type == 0 ? Bid - inTake_Profit*_Point : RC_Take_Profit[1],"Sell open"))
              {
               initial_bar = iBars(_Symbol,_Period);
              }
            else
               Print("Error on opening sell position :"+IntegerToString(GetLastError()));
           }
     }
//---
  }
//---
//+------------------------------------------------------------------+
//+------------------------------------------------------------------+
bool F_CheckOpenOrders()
  {
   for(int i = 0; i<PositionsTotal(); i++)
     {
      Cposition.SelectByIndex(i);
        {
         long ord_magic = PositionGetInteger(POSITION_MAGIC);
         string ord_symbol = PositionGetString(POSITION_SYMBOL);
         ENUM_POSITION_TYPE type = Cposition.PositionType();
         if(ord_magic==inMagic_Number && ord_symbol==_Symbol)
            return(true);
        }
     }
   return(false);
  }
//+------------------------------------------------------------------+

(For a more detailed and complete code of the Expert Advisor above. Link here)


How to trade using this indicator

Although the indicator can be used as a trading system in itself, as it offers information about the Win Rate and Profit Factor, it can also be used in conjunction with some trading systems shown below:


#1 As a confirmation trend in a Moving Average crossing setup

Setup: One fast exponential moving average with 50 periods, one slow exponential moving average with 200 periods, timeframe M5, any volatile asset like XAUUSD for example.

Wait for a crossover between the two averages above. After that, open a position only when the indicator gives a signal after this crossover and in the direction of the trend signaled by the crossing of the faster average in relation to the slower one. Set stop loss at Pivot points for a higher hit rate. (click here for more details)


#2 As a confirmation signal on a Breakout system

Setup: Find the current main trend, draw a consolidation channel and look for breakouts in the direction of it. When the indicator gives a signal outside the channel confirming the breakout open a correspondent position. (click here for more details)


#3 Swing trading on higher timeframes using the inner Moving Average filter

Setup: Add the indicator on a high timeframe like H4 or higher. Use the Moving Average filter, present in the indicator itself. After that, also activate the "One signal direction at a time" option.

Open a buy position when the indicator signals it and close it only when a new sell signal appears or vice versa.

//----

Best results are obtained if you use this setup in the direction of the larger trend and open orders only in its direction, especially in assets that have a clearly defined fundamental bias such as the SP500, Nasdaq index or even Gold.  (click here for more details)

I also strongly recommend reading the article "Trading with a Bias vs. Trading without a Bias: A Deep Dive on How to Boost your Performance in Automatic Trading" for a better understanding on how to achieve better results with algo trading. (click here)

Input parameters

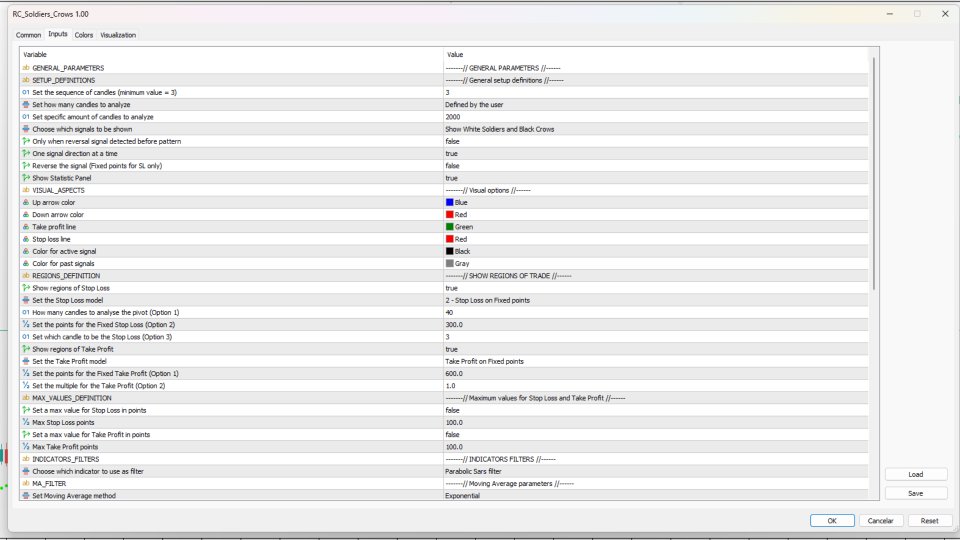
  • Setup defintion: Set the sequence of candles to get the pattern verified; Set how many candles in the past to analyze; Choose which signals to be shown; Only when reversal signal is detected before the pattern; One signal at a time; Reverse the signal; Show statistic panel
  • Visual aspects: Up arrow color; Down arrow color; Take profit line color; Stop loss line color; Color for active current signal; Color for past signals
  • Trade regions definition: Show regions of stop loss; Set the stop loss model (1 - on pivot levels, 2 - fixed points, 3 - candle of sequence); Show regions of take profit, Set the take profit model (1 - fixed points, 2 - x times multiplied by the stop loss)
  • Maximum values definition: Set a maximum value for stop loss in points (true or false); Maximum stop loss points; Set a maximum value for take profit in points (true or false); Maximum take profit points
  • Indicator filter: Choose which indicator to use as a filter (1 - No indicator filter, 2 - Moving average filter, 3 - Bollinger bands filter, 4 - ADX filter, 5 - RSI filter)
  • Hour filter: Use hour filter (true or false); Show hour filter lines (true or false); Time to start hour filter (Format HH:MM); Time to finish hour filter (Format HH:MM)
  • Alert definition: Sound alert every new signal (true or false); Alert pop-up every new signal (true or false); Send notification every new signal (true or false)

Disclaimer

By purchasing and using this indicator, users agree to indemnify and hold harmless its author from any and all claims, damages, losses, or liabilities arising from the use of the indicator. Trading and investing carry inherent risks, and users should carefully consider their financial situation and risk tolerance before using this indicator.





Bewertungen 1
William J Pabon Caraballo
220
William J Pabon Caraballo 2024.08.02 20:20 
 

Awesome indicator, thanks for your quick response.

Empfohlene Produkte
Harmonic Patterns Osw MT5
William Oswaldo Mayorga Urduy
HARMONISCHE MUSTER OSW MT5 Dieser Indikator ist dafür verantwortlich, die harmonischen Muster zu erkennen, damit Sie sie bearbeiten können, und gibt Ihnen ein Signal, damit Sie eine manuelle Analyse hinzufügen können, ob Sie die Bestellung annehmen oder nicht. Zu den harmonischen Mustern, die der Indikator erkennt, gehören: >gartley >Fledermaus >Schmetterling >Krabbe >Hai Zu den Funktionen, die Sie finden können, gehören: >Generieren Sie Benachrichtigungen per E-Mail, Mobilgerät und PC
Monster Harmonics Indicator is a harmonic pattern indicator. It recognizes Gartley, Bat, Crab, Butterfly, Cypher, White Swan, Black Swan, Shark and AB=CD patterns. Projected patterns that are not yet completed are recognized, too. Monster even shows the PRZ (Potential Reversal Zone). Users can add their own user defined patterns to Monster. Besides the current pattern, Monster also shows all patterns in the symbols history. Monster will provide alerts for developing patterns. Introduced by H.M.
The Penta-O is a 6-point retracement harmonacci pattern which usually precedes big market movements. Penta-O patterns can expand and repaint quite a bit. To make things easier this indicator implements a twist: it waits for a donchian breakout in the right direction before signaling the trade. The end result is an otherwise repainting indicator with a very reliable trading signal. The donchian breakout period is entered as an input. [ Installation Guide | Update Guide | Troubleshooting | FAQ | A
Product Overview The HPL (High Probability Levels) indicator is a cutting-edge trading tool designed to identify high-probability levels in the market using imbalances. By leveraging the concept of imbalances, HPL provides traders with precise insights into potential market reversals and continuations, enhancing trading accuracy and decision-making. Key Features Imbalance Detection: HPL automatically identifies and marks imbalances on the chart, highlighting areas where the market may seek to r
Trend Lines Supports and Resistances is an indicator that analyses the market structure, identifies Pivot Points, displays active Support/Resistance zones and trend levels. Main Features: Defining and displaying Pivot Points. Analyse Pivot Points to build and display trend lines. Setting up visual display of trend lines. Setting up trend lines broken notifications. Analyse Pivot Points to define and display support and resistance levels. Setting up visual display of support and resistance leve
Introduction to Harmonic Volatility Indicator Harmonic Volatility Indicator is the first technical analysis applying the Fibonacci analysis to the financial volatility. Harmonic volatility indicator is another level of price action trading tool, which combines robust Fibonacci ratios (0.618, 0.382, etc.) with volatility. Originally, Harmonic Volatility Indicator was developed to overcome the limitation and the weakness of Gann’s Angle, also known as Gann’s Fan. We have demonstrated that Harmonic
Das 123-Muster ist eines der beliebtesten, leistungsstärksten und flexibelsten Diagrammmuster. Das Muster besteht aus drei Preispunkten: einem Boden, einem Gipfel oder Tal und einem Fibonacci-Retracement zwischen 38,2% und 71,8%. Ein Muster gilt als gültig, wenn der Preis jenseits des letzten Gipfels oder Tals abbricht, in dem der Indikator einen Pfeil zeichnet, einen Alarm auslöst und der Handel platziert werden kann. [ Installationsanleitung | Update-Anleitung | Fehlerbehebung | FAQ | Alle Pr
CandleStick Pattern Indicator MT5
Driller Capital Management UG
5 (1)
Dies ist ein einfacher Candle Stick Pattern Indikator, der in jeder Zeiteinheit funktioniert und nach standardmäßigen Paramtern automatisch entsprechende Pattern im Chart anzeigt, sobald die Bedingungen erfüllt sind. Folgende Candle Stick Pattern sind derzeit implementiert: Bullish Hammer | Bearish Hammer Bullish Inverted Hammer | Bearish Inverted Hammer Bullish Engulfing | Bearish Engulfing Piercing | Dark Cloud Cover Bullish 3 Inside | Bearish 3 Inside Die Formationen werden automatisch berech
FREE
KT Renko Patterns MT5
KEENBASE SOFTWARE SOLUTIONS
KT Renko Patterns scans the Renko chart brick by brick to find some famous chart patterns that are frequently used by traders across the various financial markets. Compared to the time-based charts, patterns based trading is easier and more evident on Renko charts due to their uncluttered appearance. KT Renko Patterns features multiple Renko patterns, and many of these patterns are extensively explained in the book titled Profitable Trading with Renko Charts by Prashant Shah. A 100% automated
Der Trendfänger: Die Strategie des Trendfängers mit Alarmindikator ist ein vielseitiges technisches Analysewerkzeug, das Händlern hilft, Markttrends und potenzielle Ein- und Ausstiegspunkte zu identifizieren. Sie verfügt über eine dynamische Trendfängerstrategie, die sich den Marktbedingungen anpasst, um eine klare visuelle Darstellung der Trendrichtung zu ermöglichen. Händler können die Parameter an ihre Vorlieben und Risikotoleranz anpassen. Der Indikator hilft bei der Trendidentifikation, s
FREE
The   Fibonacci Confluence Toolkit   is a technical analysis tool designed to help traders identify potential price reversal zones by combining key market signals and patterns. It highlights areas of interest where significant price action or reactions are anticipated, automatically applies Fibonacci retracement levels to outline potential pullback zones, and detects engulfing candle patterns. Its unique strength lies in its reliance solely on price patterns, eliminating the need for user-define
Volume Doji
Ricardo Almeida Branco
Hey guys. This indicator will show you, in the volume histogram, if the candle was a Doji, a bullish candle, or a bearish candle. The construction of this indicator was requested by a trader who uses other indicators from my catalog, and I decided to release it free to help traders who think that the indicator can contribute to their operations. The parameters are: Volume Type: Real Volume or Tick Volume. Color if the candle is bearish: select the color. Color if the candle is high: select
FREE
Awesome Oscillator by Bill Williams with the ability to fine-tune and replace the averaging algorithms of the indicator, which significantly expands the possibilities of using this oscillator in algorithmic trading and brings it closer in its properties to such an indicator as the MACD. To reduce price noise, the final indicator is processed with an additional Smooth averaging. The indicator has the ability to give alerts, send mail messages and push signals when the direction of movement of th
Introduction to Fractal Pattern Scanner Fractal Indicator refers to the technical indicator that makes use of the fractal geometry found in the financial market. Fractal Pattern Scanner is the advanced Fractal Indicator that brings the latest trading technology after the extensive research and development work in the fractal geometry in the financial market. The most important feature in Fractal Pattern Scanner is the ability to measure the turning point probability as well as the trend probabil
I just sell my products in mql5.com, any other websites are stolen old versions, So no any new updates or support. - Lifetime update free -   Real price is 80$   - 25% Discount ( It is 59$ now ) Contact me for instruction, any questions! Related Product:  Gold Trade Expert MT5  ,  Professor EA - Non-repaint Introduction Flag patterns are an important tool for technical traders in the stock market. When interpreting a flag pattern, it is important to wait for the pattern to pick a direction b
Candlestick Pattern Teller
Flavio Javier Jarabeck
5 (1)
Minions Labs' Candlestick Pattern Teller It shows on your chart the names of the famous Candlesticks Patterns formations as soon as they are created and confirmed. No repainting. That way beginners and also professional traders who have difficulties in visually identifying candlestick patterns will have their analysis in a much easier format. Did you know that in general there are 3 types of individuals: Visual, Auditory, and Kinesthetic? Don't be ashamed if you cannot easily recognize Candlesti
Basic Harmonic Pattern MT5
Mehran Sepah Mansoor
4.78 (69)
Dieser Indikator identifiziert die beliebtesten   Harmonic Patterns , die Marktumkehrpunkte vorhersagen. Diese harmonischen Muster sind Kursformationen, die sich auf dem Devisenmarkt ständig wiederholen und auf mögliche zukünftige Kursbewegungen hindeuten /   Free MT4 Version Darüber hinaus verfügt dieser Indikator über ein eingebautes Markteintrittssignal sowie über verschiedene Gewinnmitnahmen und Stop-Losses. Es ist zu beachten, dass der Harmonische Muster-Indikator zwar eigenständig Kauf-/
FREE
Morning Star GA
Osama Echchakery
The   Morning Star candlestick pattern   is formed by three candles. Here’s how to identify the Morning Star candlestick pattern: The first candle must be bearish The third candle must be bullish The second candle must be small compared to the others, like a Doji or a Spinning Top The color of the second candle doesn’t matter Ideally, the body of the second candle shouldn’t overlap with the bodies of the other two candles This 3-candle bullish candlestick pattern is a reversal pattern, meaning t
FREE
KT Double Top Bottom MT5
KEENBASE SOFTWARE SOLUTIONS
1 (1)
The double top bottom pattern is arguably one of the technical analysis's most popular chart patterns. These patterns are used to capitalize on recurring patterns and identify trend reversal patterns, thereby creating well-placed entry and exit levels. The KT Double Top Bottom is based on these patterns and fine-tunes the trade signal development process for traders. Features It's based on one of the most reliable trading patterns and brings some fine-tuning and automation to the process. Also
Candle Pattern Scanner
Bruno Goncalves Mascarenhas
Candlestick patterns The candlestick Pattern Indicator and Scanner is designed to be a complete aid tool for discretionary traders to find and analyze charts from powerful candle patterns. Recognized Patterns: Hammer Shooting star Bearish Engulfing Bullish Engulfing Doji Marubozu Scanner Imagine if you could look at all the market assets in all timeframes looking for candlestick signals.
Best SAR MT5
Ashkan Hazegh Nikrou
4.33 (3)
Beschreibung :  Wir freuen uns, Ihnen unseren neuen kostenlosen Indikator vorzustellen, der auf einem der professionellen und beliebten Indikatoren auf dem Devisenmarkt (Parabolic SAR) basiert. Dieser Indikator ist eine neue Modifikation des ursprünglichen Parabolic SAR-Indikators. Diese Überkreuzung ist kein Signal, sondern spricht über das Potenzial für das Ende der Bewegung. Sie können mit dem Kauf bei einem neuen blauen Punkt beginnen und einen Stop-Loss ein Atr vor dem ersten blauen Punkt
FREE
Tops and Bottoms Indicator
Josue De Matos Silva
4.67 (6)
Tops & Bottoms Indicator FREE   Tops abd Bottoms:   An effective indicator for your trades The tops and bottoms indicator helps you to find  ascending and descending channel formations with indications of ascending and/or descending tops and bottoms. In addition, it  show possibles  opportunities with a small yellow circle when the indicator encounters an impulse formation. This indicator provide to you  more security and speed in making entry decisions. Also test our FREE advisor indicator:  
FREE
This is a multi-symbol and multi-timeframe table-based indicator designed for a candlestick patterns detection with 46 patterns for META TRADER 5. Each formation has own image for easier recognition. Here you find most popular formations such as "Engulfing", "Hammer", "Three Line Strike", "Piercing" or Doji - like candles. Check my full list of patterns on my screenshots below. Also you can not only switch all bearish or bullish patterns from input, but also select formation for a specified symb
Welcome to the Ultimate Harmonic Patterns recognition indicator that is focused to detect advanced patterns. The Gartley pattern, Bat pattern, and Cypher pattern  are popular technical analysis tools used by traders to identify potential reversal points in the market. Our Ultimate Harmonic Patterns recognition Indicator is a powerful tool that uses advanced algorithms to scan the markets and identify these patterns in real-time. With our Ultimate Harmonic Patterns recognition Indicator, you ca
Der Indikator erstellt aktuelle Notierungen, die mit historischen verglichen werden können, und auf dieser Grundlage eine Preisbewegungsprognose erstellen. Der Indikator verfügt über ein Textfeld zur schnellen Navigation zum gewünschten Datum. Optionen: Symbol - Auswahl des Symbols, das der Indikator anzeigen soll; SymbolPeriod - Auswahl des Zeitraums, aus dem der Indikator Daten aufnimmt; IndicatorColor - Indikatorfarbe; HorisontalShift - Verschiebung der vom Indikator gezeichneten Kurse u
The new update makes this indicator a complete tool for studying, analyzing and operating probabilistic patterns. It includes: On-chart Multi-asset percentage monitor. Configurable martingales. Twenty-one pre-configured patterns, including Mhi patterns and C3. An advanced pattern editor to store up to 5 custom patterns. Backtest mode to test results with loss reports. Trend filter. Hit operational filter. Martingale Cycles option. Various types of strategies and alerts. Confluence between patter
The   Three Inside Up   candlestick pattern is formed by three candles. Here’s how to identify the Three Inside Up candlestick pattern: The first candle must be bearish The second candle must be bullish The close of the second candle should ideally be above the 50% level of the body of the first one The third candle should close above the first one This 3-candle bullish candlestick pattern is a reversal pattern, meaning that it’s used to find bottoms. For this reason, we want to see this pattern
FREE
This indicator uses the metaquotes ZigZag indicator as base to plot fibonacci extension and fibonacci retracement based in the Elliot waves. A fibonacci retracement will be plotted on every wave draw by the ZigZag. A fibonacci extension will be plotted only after the 2nd wave. Both fibonacci will be updated over the same wave tendency. Supporting until 9 consecutive elliot waves. Parameters: Depth: How much the algorithm will iterate to find the lowest and highest candles Deviation: Amount of
Auto Fib Retracements
Ross Adam Langlands Nelson
4.2 (5)
Automatic Fibonacci Retracement Line Indicator. This indicator takes the current trend and if possible draws Fibonacci retracement lines from the swing until the current price. The Fibonacci levels used are: 0%, 23.6%, 38.2%, 50%, 61.8%, 76.4%, 100%. This indicator works for all charts over all timeframes. The Fibonacci levels are also recorded in buffers for use by other trading bots. Any comments, concerns or additional feature requirements are welcome and will be addressed promptly. 
FREE
Käufer dieses Produkts erwarben auch
Trend Screener Pro MT5
STE S.S.COMPANY
4.89 (70)
Nutzen Sie die Macht des Trendhandels mit Trend Screener Indicator: Ihrer ultimativen Trendhandelslösung, die auf Fuzzy-Logik und einem System mit mehreren Währungen basiert! Steigern Sie Ihren Trendhandel mit Trend Screener, dem revolutionären Trendindikator mit Fuzzy-Logik. Es handelt sich um einen leistungsstarken Trendfolgeindikator, der über 13 Premium-Tools und -Funktionen sowie 3 Handelsstrategien kombiniert und ihn zu einer vielseitigen Wahl macht, um Ihren Metatrader in einen Trendanaly
Quantum TrendPulse
Bogdan Ion Puscasu
5 (11)
Wir stellen   Quantum TrendPulse   vor, das ultimative Handelstool, das die Leistung von   SuperTrend   ,   RSI   und   Stochastic   in einem umfassenden Indikator vereint, um Ihr Handelspotenzial zu maximieren. Dieser Indikator wurde für Händler entwickelt, die Präzision und Effizienz suchen, und hilft Ihnen dabei, Markttrends, Momentumverschiebungen und optimale Ein- und Ausstiegspunkte sicher zu erkennen. Hauptmerkmale: SuperTrend-Integration:   Folgen Sie problemlos dem vorherrschenden Markt
FX Volume MT5
Daniel Stein
4.82 (17)
FX Volume: Erleben Sie den echten Marktüberblick aus der Sicht eines Brokers Kurzüberblick Möchten Sie Ihre Handelsstrategie auf das nächste Level bringen? FX Volume liefert Ihnen Echtzeit-Einblicke in die Positionierung von Retail-Tradern und Brokern — lange bevor verzögerte Berichte wie der COT verfügbar sind. Ob Sie nach beständigen Gewinnen streben oder einfach einen tieferen Vorteil am Markt suchen, FX Volume hilft Ihnen, große Ungleichgewichte zu erkennen, Breakouts zu bestätigen und Ihr
TPSproTREND PrO MT5
Roman Podpora
4.6 (15)
TPSpro TREND PRO   ist ein Trendindikator, der den Markt automatisch analysiert und Informationen über den Trend und jede seiner Änderungen liefert sowie Signale für den Einstieg in Geschäfte ohne Neuzeichnung gibt! Der Indikator verwendet jede Kerze und analysiert sie separat. bezieht sich auf verschiedene Impulse – Aufwärts- oder Abwärtsimpuls. Exakte Einstiegspunkte in Transaktionen für Währungen, Krypto, Metalle, Aktien, Indizes! Version MT5                   VOLLSTÄNDIGE BESCHREIBUNG DES IN
FX Levels MT5
Daniel Stein
5 (1)
FX Levels: Außerordentlich präzise Unterstützungs- und Widerstandszonen für alle Märkte Kurzüberblick Suchen Sie eine verlässliche Methode, um Support- und Resistance-Level in jedem Markt zu identifizieren—egal ob Währungspaare, Indizes, Aktien oder Rohstoffe? FX Levels vereint die traditionelle „Lighthouse“-Methode mit einem modernen dynamischen Ansatz und bietet nahezu universelle Genauigkeit. Durch unsere Erfahrung mit echten Brokern sowie automatischen täglichen und Echtzeit-Updates hilft
Golden Trend Indicator MT5
Noha Mohamed Fathy Younes Badr
4.86 (14)
Golden Trend indicator  is The best indicator for predicting trend movement this indicator never lags and never repaints and never back paints    and give  arrow buy and sell    before the candle appear  and it will help you and  will make your trading decisions clearer its work on all currencies and  gold and crypto and all time frame This unique  indicator uses very secret algorithms to catch the  trends, so you can trade using this indicator and see the trend clear on charts  manual guide and
Dieses Dashboard zeigt die   neuesten verfügbaren harmonischen   Muster für die ausgewählten Symbole, so dass Sie Zeit sparen und effizienter sein werden /   MT4-Version . Kostenloser Indikator:   Basic Harmonic Pattern Spalten des Indikators Symbol:   die ausgewählten Symbole werden angezeigt Trend:   bullish oder bearish Pattern :   Art des Musters (Gartley, Schmetterling, Fledermaus, Krabbe, Hai, Cypher oder ABCD) Entry :   Einstiegskurs SL:   Stop-Loss-Kurs TP1:   1. Take-Profit-Kurs TP2
FX Power MT5 NG
Daniel Stein
5 (9)
FX Power: Analysieren Sie die Stärke von Währungen für intelligentere Handelsentscheidungen Übersicht FX Power ist Ihr unverzichtbares Werkzeug, um die tatsächliche Stärke von Währungen und Gold unter allen Marktbedingungen zu verstehen. Indem Sie starke Währungen kaufen und schwache verkaufen, vereinfacht FX Power Ihre Handelsentscheidungen und deckt Chancen mit hoher Wahrscheinlichkeit auf. Ob Sie Trends folgen oder extreme Delta-Werte nutzen, um Umkehrungen zu prognostizieren, dieses Tool p
FX Dynamic: Volatilität und Trends mit anpassbarer ATR-Analyse im Blick Übersicht FX Dynamic ist ein leistungsstarkes Tool, das die Berechnungen des Average True Range (ATR) nutzt, um Tradern unübertroffene Einblicke in die tägliche und intraday-Volatilität zu geben. Durch das Festlegen klarer Volatilitätsschwellen — beispielsweise 80%, 100% und 130% — kannst du schnell potenzielle Gewinnchancen erkennen oder Warnungen erhalten, wenn der Markt seine üblichen Spannen überschreitet. FX Dynamic p
TPSpro RFI Levels MT5
Roman Podpora
4.71 (17)
ANWEISUNGEN       Russland       -        ENG    Die Empfehlung basiert auf dem Indikator -   TPSpro   TREND PRO -   Version MT5 Die wichtigsten Elemente in der Branche sind entweder in Zonen oder in der Fabrik enthalten, oder sie führen zu einer Lösung bei einem Kauf oder dem Verkauf eines anderen Instruments. Wenn viele Menschen ihre Rechte nicht auf dem Händlerkonto verschlüsseln, werden die Folgen nicht schnell genug sein. Ich habe es damit abgeschlossen, dass ich diese Folgen nun noch inter
Dies ist ein Indikator für MT5, der genaue Signale für den Einstieg in einen Handel ohne Repainting (Neuzeichnen) liefert. Er kann auf alle Finanzwerte angewendet werden: Forex, Kryptowährungen, Metalle, Aktien, Indizes. Er liefert ziemlich genaue Schätzungen und sagt Ihnen, wann es am besten ist, eine Position zu eröffnen und zu schließen. Sehen Sie sich das Video (6:22) mit einem Beispiel für die Verarbeitung nur eines Signals an, das sich für den Indikator gelohnt hat! Die meisten Händler ver
Gold Stuff mt5
Vasiliy Strukov
4.92 (173)
Gold Stuff mt5-Ein Trendindikator, der speziell für Gold entwickelt wurde, kann auch auf allen Finanzinstrumenten verwendet werden. Der Indikator wird nicht neu gezeichnet und verzögert sich nicht. Empfohlener Zeitrahmen H1. WICHTIG! Kontaktieren Sie mich sofort nach dem Kauf, um Anweisungen und Bonus zu erhalten!     Sie können eine kostenlose Kopie unseres Strong Support- und Trendscanner-Indikators erhalten, bitte senden Sie uns eine persönliche Nachricht. Mich! DATEN Draw Arrow - inkl.a
Zunächst einmal ist es wichtig zu betonen, dass dieses Handelstool ein Nicht-Repaint-, Nicht-Redraw- und Nicht-Verzögerungsindikator ist, was es ideal für professionelles Trading macht. Online-Kurs, Benutzerhandbuch und Demo. Der Smart Price Action Concepts Indikator ist ein sehr leistungsstarkes Werkzeug sowohl für neue als auch erfahrene Händler. Er vereint mehr als 20 nützliche Indikatoren in einem und kombiniert fortgeschrittene Handelsideen wie die Analyse des Inner Circle Traders und Str
Support And Resistance Screener ist ein Level-Indikator für MetaTrader, der mehrere Tools innerhalb eines Indikators bietet. Die verfügbaren Werkzeuge sind: 1. Marktstruktur-Screener. 2. Bullische Pullback-Zone. 3. Bärische Pullback-Zone. 4. Tägliche Pivot-Punkte 5. wöchentliche Pivots-Punkte 6. monatliche Pivots-Punkte 7. Starke Unterstützung und Widerstand basierend auf harmonischem Muster und Volumen. 8. Zonen auf Bankebene. ZEITLICH BEGRENZTES ANGEBOT: HV Support and Resistance Indicator ist
IX Power MT5
Daniel Stein
4.83 (6)
IX Power: Markteinblicke für Indizes, Rohstoffe, Kryptowährungen und Forex Überblick IX Power ist ein vielseitiges Tool zur Analyse der Stärke von Indizes, Rohstoffen, Kryptowährungen und Forex-Symbolen. Während FX Power die höchste Präzision für Währungspaare bietet, indem es alle verfügbaren Paardaten einbezieht, konzentriert sich IX Power ausschließlich auf die Marktdaten des zugrunde liegenden Symbols. Dies macht IX Power zu einer hervorragenden Wahl für Nicht-Forex-Märkte und zu einem zuv
Zunächst einmal ist es wichtig zu betonen, dass dieses Handelssystem ein Nicht-Repainting-, Nicht-Redrawing- und Nicht-Verzögerungsindikator ist, was es sowohl für manuelles als auch für automatisches Trading ideal macht. Online-Kurs, Handbuch und Vorlagen herunterladen. Das "Smart Trend Trading System MT5" ist eine umfassende Handelslösung, die für neue und erfahrene Trader maßgeschneidert ist. Es kombiniert über 10 Premium-Indikatoren und bietet mehr als 7 robuste Handelsstrategien, was es zu
Matrix Arrow Indicator MT5
Juvenille Emperor Limited
5 (13)
Matrix Arrow Indicator MT5   ist ein einzigartiger 10-in-1-Trend, der zu   100 % nicht neu gezeichnet   werden kann. Multi-Timeframe-Indikator, der für alle Symbole/Instrumente verwendet werden kann:   Forex ,   Rohstoffe ,   Kryptowährungen ,   Indizes ,   Aktien .  Der  Matrix Arrow Indicator MT5  wird den aktuellen Trend in seinen frühen Stadien bestimmen und Informationen und Daten von bis zu 10 Standardindikatoren sammeln, die sind: Durchschnittlicher Richtungsbewegungsindex (ADX) Rohstoff
Jetzt 147 US -Dollar (nach ein paar Aktualisierungen auf 499 US -Dollar) - Unbegrenzte Konten (PCs oder MACs) RelicusRoad Benutzerhandbuch + Schulungsvideos + Zugang zur privaten Discord-Gruppe + VIP-Status EINE NEUE ART, DEN MARKT ZU BETRACHTEN RelicusRoad ist der weltweit leistungsstärkste Handelsindikator für Forex, Futures, Kryptowährungen, Aktien und Indizes und gibt Händlern alle Informationen und Tools, die sie benötigen, um profitabel zu bleiben. Wir bieten technische Analysen und Ha
Auto Order Block with break of structure based on ICT and Smart Money Concepts (SMC) Futures Break of Structure ( BoS )             Order block ( OB )            Higher time frame Order block / Point of Interest ( POI )    shown on current chart           Fair value Gap ( FVG ) / Imbalance   -  MTF      ( Multi Time Frame )    HH/LL/HL/LH  -  MTF      ( Multi Time Frame )  Choch  MTF      ( Multi Time Frame )  Volume Imbalance     ,  MTF          vIMB Gap’s Power of 3 Equal High / Low’s  
Legacy of Gann for MT5
Pavel Zamoshnikov
5 (5)
The indicator very accurately determines the levels of the possible end of the trend and profit fixing. The method of determining levels is based on the ideas of W.D.Gann, using an algorithm developed by his follower Kirill Borovsky. Extremely high reliability of reaching levels (according to K. Borovsky  - 80-90%) Indispensable for any trading strategy – every trader needs to determine the exit point from the market! Precisely determines targets on any timeframes and any instruments (forex, met
ICT, SMC, SMART MONEY CONCEPTS, SMART MONEY, Smart Money Concept, Support and Resistance, Trend Analysis, Price Action, Market Structure, Order Blocks, BOS/CHoCH,   Breaker Blocks ,  Momentum Shift,   Supply&Demand Zone/Order Blocks , Strong Imbalance,   HH/LL/HL/LH,    Fair Value Gap, FVG,  Premium  &   Discount   Zones, Fibonacci Retracement, OTE, Buy Side Liquidity, Sell Side Liquidity, BSL/SSL Taken, Equal Highs & Lows, MTF Dashboard, Multiple Time Frame, BigBar, HTF OB, HTF Market Structure
Der Forex TPA Indikator deckt die wahren Aktionen der Marktmacher auf, immer dann wenn sie passieren. "Kämpfe nicht gegen die Marktmacher an, sondern folge ihnen", ist wohl der beste Rat, den ein Trader bekommen kann. Der TPA Indikator zeigt jedesmal seine Signale an wenn die Bullen definitiv stärker sind als die Bären und umgekehrt. Dieser Indikator wurde VON Tradern FÜR Trader gemacht und ist 100% NICHT NACHZEICHNEND! Signale werden STRENG am Schluss einer Kerze  generiert. Das sagen unsere Ku
I just sell my products in mql5.com, any other websites are stolen old versions, So no any new updates or support. - Lifetime update free -   Real price is 80$   - 25% Discount ( It is 59$ now ) Contact me for instruction, any questions! Related Product:  Gold Trade Expert MT5 - Non-repaint Introduction The breakout and retest strategy is traded support and resistance levels. it involves price breaking through a previous level.  The break and retest strategy is designed to help traders do two
Gartley Hunter Multi
Siarhei Vashchylka
5 (9)
Gartley Hunter Multi - An indicator for searching for harmonic patterns simultaneously on dozens of trading instruments and on all possible timeframes. Manual (Be sure to read before purchasing) | Version for MT4 Advantages 1. Patterns: Gartley, Butterfly, Shark, Crab. Bat, Alternate Bat, Deep Crab, Cypher 2. Simultaneous search for patterns on dozens of trading instruments and on all possible timeframes 3. Search for patterns of all possible sizes. From the smallest to the largest 4. All fou
Atomic Analyst MT5
Issam Kassas
4.32 (19)
Zunächst einmal ist es erwähnenswert, dass dieser Handelsindikator nicht neu malt, nicht neu zeichnet und keine Verzögerung aufweist, was ihn sowohl für manuellen als auch für Roboterhandel ideal macht. Benutzerhandbuch: Einstellungen, Eingaben und Strategie. Der Atom-Analyst ist ein PA-Preisaktionsindikator, der die Stärke und das Momentum des Preises nutzt, um einen besseren Vorteil auf dem Markt zu finden. Ausgestattet mit fortschrittlichen Filtern, die helfen, Rauschen und falsche Signale z
ATrend
Zaha Feiz
4.75 (12)
ATREND: How It Works and How to Use It How It Works The " ATREND " indicator for the MT5 platform is designed to provide traders with robust buy and sell signals by utilizing a combination of technical analysis methodologies. This indicator primarily leverages the Average True Range (ATR) for volatility measurement, alongside trend detection algorithms to identify potential market movements. Leave a massage after purchase and receive a special bonus gift. Key Features: ⦁ Dynamic Trend Detect
Was: $249  Now: $149   Market Profile defines a number of day types that can help the trader to determine market behaviour. A key feature is the Value Area, representing the range of price action where 70% of trading took place. Understanding the Value Area can give traders valuable insight into market direction and establish the higher odds trade. It is an excellent addition to any system you may be using. Inspired by Jim Dalton’s book “Mind Over Markets”, this indicator is designed to suit the
Celebrate Vietnamese Tet 2025 with Special Offer : ALL TOOLS  only $35 ! Entfesseln Sie die Kraft des Inversion Fair Value Gap (IFVG) -Konzepts von ICT mit dem Inversion Fair Value Gaps Indicator ! Dieses hochmoderne Tool hebt Fair Value Gaps (FVGs) auf die nächste Ebene, indem es umgekehrte FVG-Zonen identifiziert und anzeigt – wichtige Unterstützungs- und Widerstandsbereiche, die nach einer Preisanpassung entstehen. Egal, ob Sie ein Scalper, Swing-Trader oder langfristiger Investor sind, der
Atbot
Zaha Feiz
4.67 (46)
AtBot: Wie es funktioniert und wie man es benutzt ### Wie es funktioniert Der "AtBot"-Indikator für die MT5-Plattform generiert Kauf- und Verkaufssignale mithilfe einer Kombination von technischen Analysetools. Er integriert den einfachen gleitenden Durchschnitt (SMA), den exponentiellen gleitenden Durchschnitt (EMA) und den Durchschnitt der wahren Reichweite (ATR)-Index, um Handelsmöglichkeiten zu identifizieren. Darüber hinaus kann er Heikin Ashi-Kerzen verwenden, um die Signalgenauigkeit zu
Blahtech Supply Demand MT5
Blahtech Limited
4.54 (13)
Was: $299  Now: $149  Supply Demand uses previous price action to identify potential imbalances between buyers and sellers. The key is to identify the better odds zones, not just the untouched ones. Blahtech Supply Demand indicator delivers functionality previously unavailable on any trading platform. This 4-in-1 indicator not only highlights the higher probability zones using a multi-criteria strength engine, but also combines it with multi-timeframe trend analysis, previously confirmed swings
Weitere Produkte dieses Autors
This indicator informs the user when the ATR is above a certain value defined by the user, as well as when the ATR prints a percentage increase or percentage decrease in its value, in order to offer the user information about the occurrence of spikes or drops in volatility which can be widely used within volatility-based trading systems or, especially, in Recovery Zone or Grid Hedge systems. Furthermore, as the volatility aspect is extremely determining for the success rate of any system based o
This indicator is the converted Metatrader 4 version of the TradingView indicator "ATR Based Trendlines - JD" by Duyck. This indicator works by automatically and continuously drawing trendlines not based exclusively on price, but also based on the volatility perceived by the ATR. So, the angle of the trendlines is determined by (a percentage of) the ATR. The angle of the trendlines follows the change in price, dictated by the ATR at the moment where the pivot point is detected. The ATR percentag
FREE
This indicator is the converted Metatrader 5 version of the TradingView indicator "ATR Based Trendlines - JD" by Duyck. This indicator works by automatically and continuously drawing trendlines not based exclusively on price, but also based on the volatility perceived by the ATR. So, the angle of the trendlines is determined by (a percentage of) the ATR. The angle of the trendlines follows the change in price, dictated by the ATR at the moment where the pivot point is detected. The ATR percentag
FREE
The Rayol Code Hour Interval Lines indicator was  designed to assist your trading experience.  It  draws the range of hours chosen by the user directly on the chart, so that it enables traders to visualize price movements during their preferred trading hours, providing  traders a more comprehensive view of price movements and market dynamics. This indicator allows the user to choose not only the Broker's time, but also the Local time. This way, the user no longer needs to calculate local time in
FREE
The Rayol Code Hour Interval Lines indicator was  designed to assist your trading experience.  It  draws the range of hours chosen by the user directly on the chart, so that it enables traders to visualize price movements during their preferred trading hours, providing  traders   a more comprehensive view of   price movements and market dynamics. This indicator allows the user to choose not only the Broker's time, but also the Local time. This way, the user no longer needs to calculate local ti
FREE
This indicator accurately identifies and informs market reversals and continuation patterns by analyzing and signaling the Three White Soldiers / Three Black Crows pattern. It also offers a  "real-time backtesting"  panel in the indicator itself in a way that every change made on the indicator parameters will immediately show the user how many signals are occurred, how many take profits and stop losses were hit and, by having these informations, the Win Rate and the Profit Factor of the setup ba
This indicator informs the user when the ATR is above a certain value defined by the user, as well as when the ATR prints a percentage increase or percentage decrease in its value, in order to offer the user information about the occurrence of spikes or drops in volatility which can be widely used within volatility-based trading systems or, especially, in Recovery Zone or Grid Hedge systems. Furthermore, as the volatility aspect is extremely determining for the success rate of any system based o
Auswahl:
William J Pabon Caraballo
220
William J Pabon Caraballo 2024.08.02 20:20 
 

Awesome indicator, thanks for your quick response.

Francisco Rayol
6278
Antwort vom Entwickler Francisco Rayol 2024.08.02 20:21
You are always welcome. God bless you. And have good trades!
Antwort auf eine Rezension
Version 1.3 2024.08.03
In this latest update, two new buffers have been added to the indicator to inform the Take Profit and Stop Loss prices. This allows the developer to use not only the existing Buy or Sell signals but also to choose to use the Take Profit or Stop Loss prices provided by the indicator. The indicator's presentation page now also includes an example code of an Expert Advisor, demonstrating how to use the indicator's buffers to add Buy or Sell signals as well as the Take Profit and Stop Loss prices offered by the indicator.
Version 1.2 2024.03.03
The hours filter has been updated. Now the time lines show the start time and end time.
Another update was regarding the pre-defined color for the timetable lines, now it is Palegreen.
Version 1.1 2024.02.29
Minor changes to the groups of the indicator parameters for better visual aspects.