RC Soldiers and Crows MT5
- インディケータ
- Francisco Rayol
- バージョン: 1.3
- アップデート済み: 3 8月 2024
- アクティベーション: 10
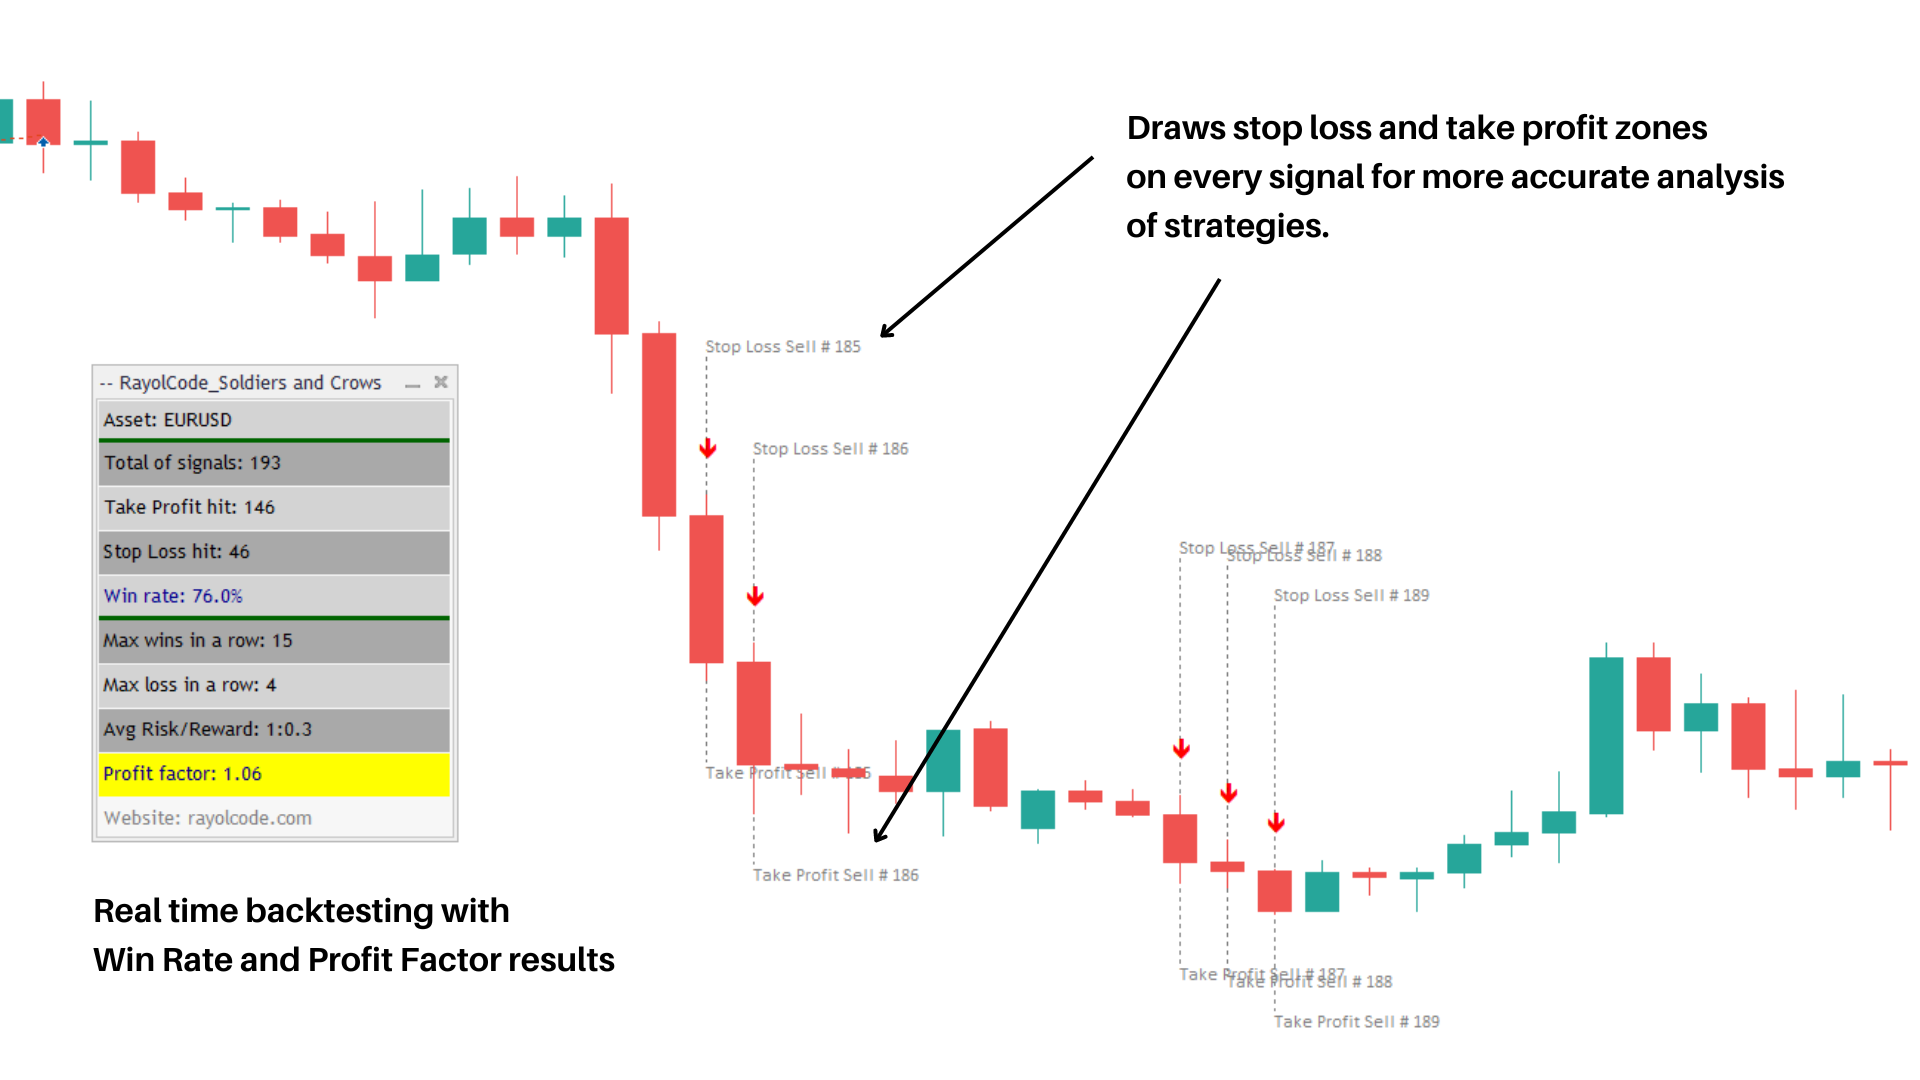
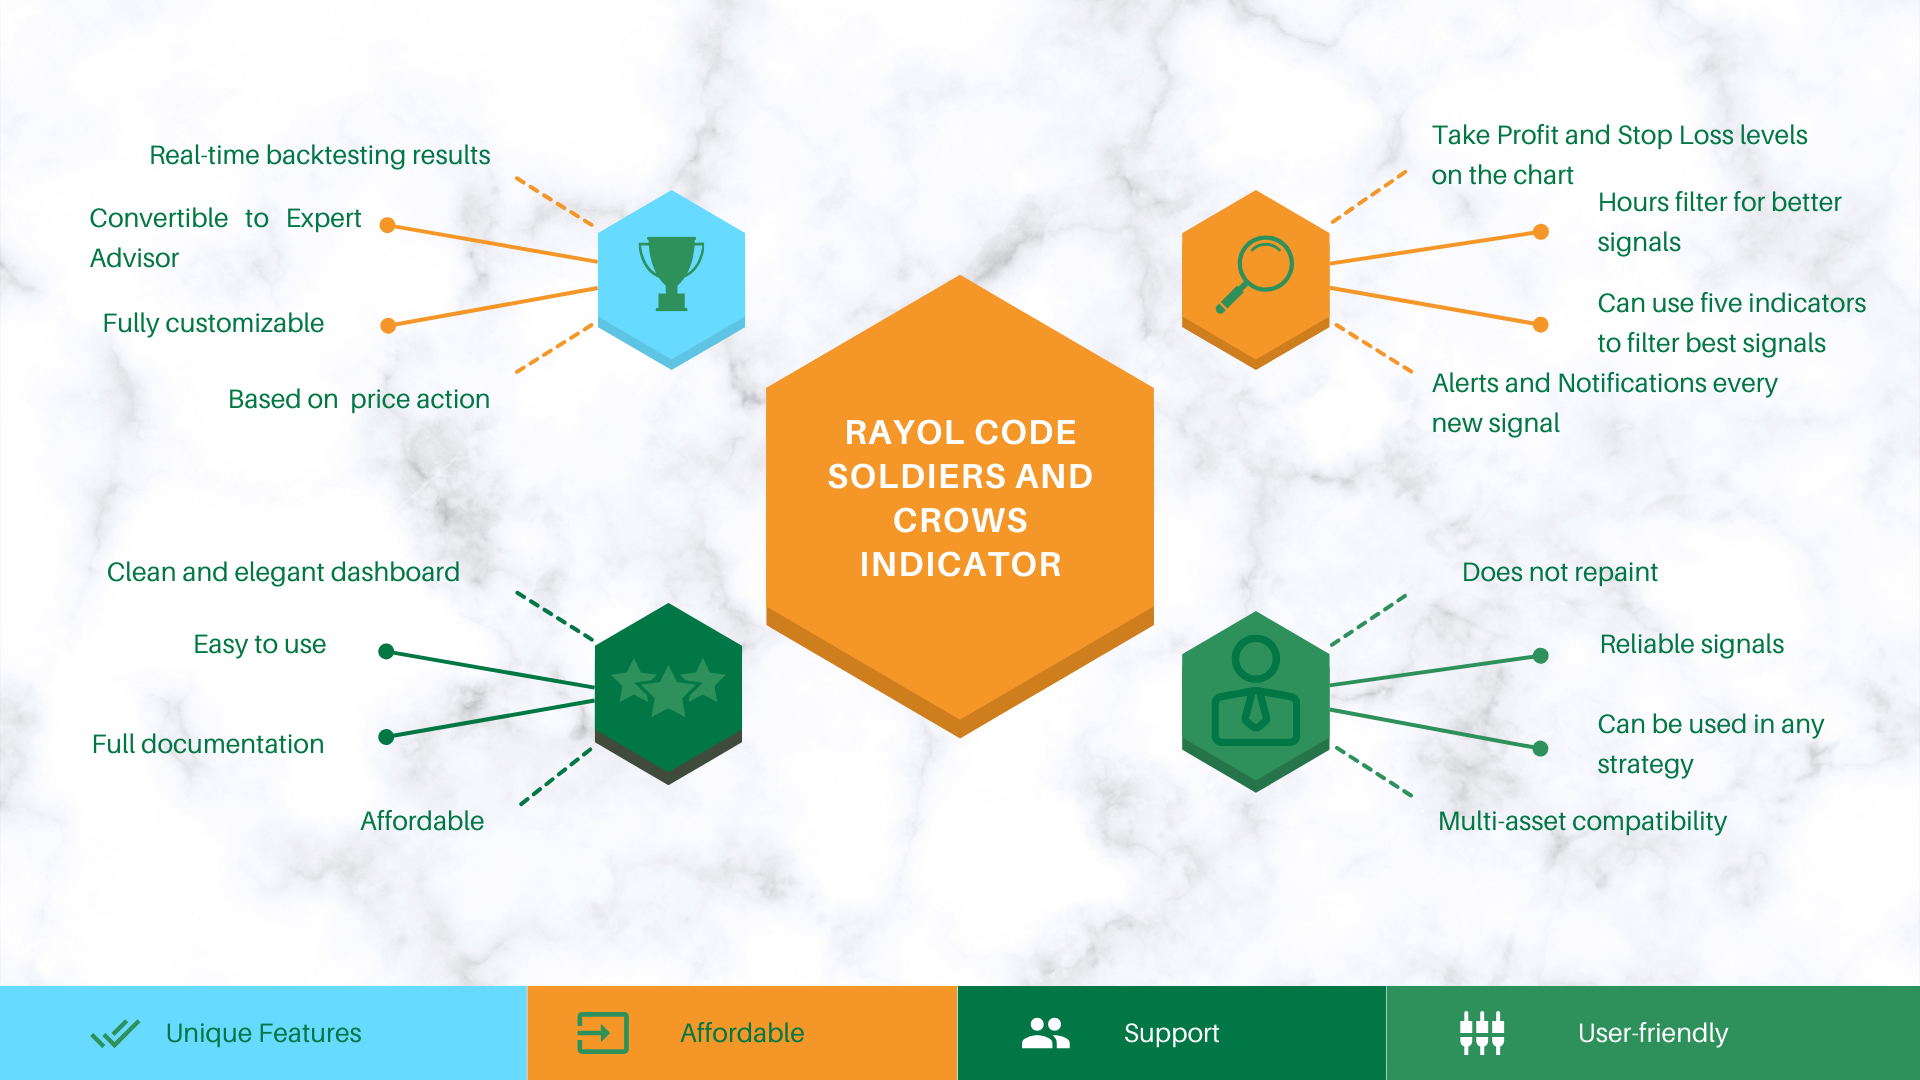
This indicator accurately identifies and informs market reversals and continuation patterns by analyzing and signaling the Three White Soldiers / Three Black Crows pattern. It also offers a "real-time backtesting" panel in the indicator itself in a way that every change made on the indicator parameters will immediately show the user how many signals are occurred, how many take profits and stop losses were hit and, by having these informations, the Win Rate and the Profit Factor of the setup based on the parameters defined by the user.
- User-friendly interface and multi-asset compatibility
- Fully customizable parameters and colors
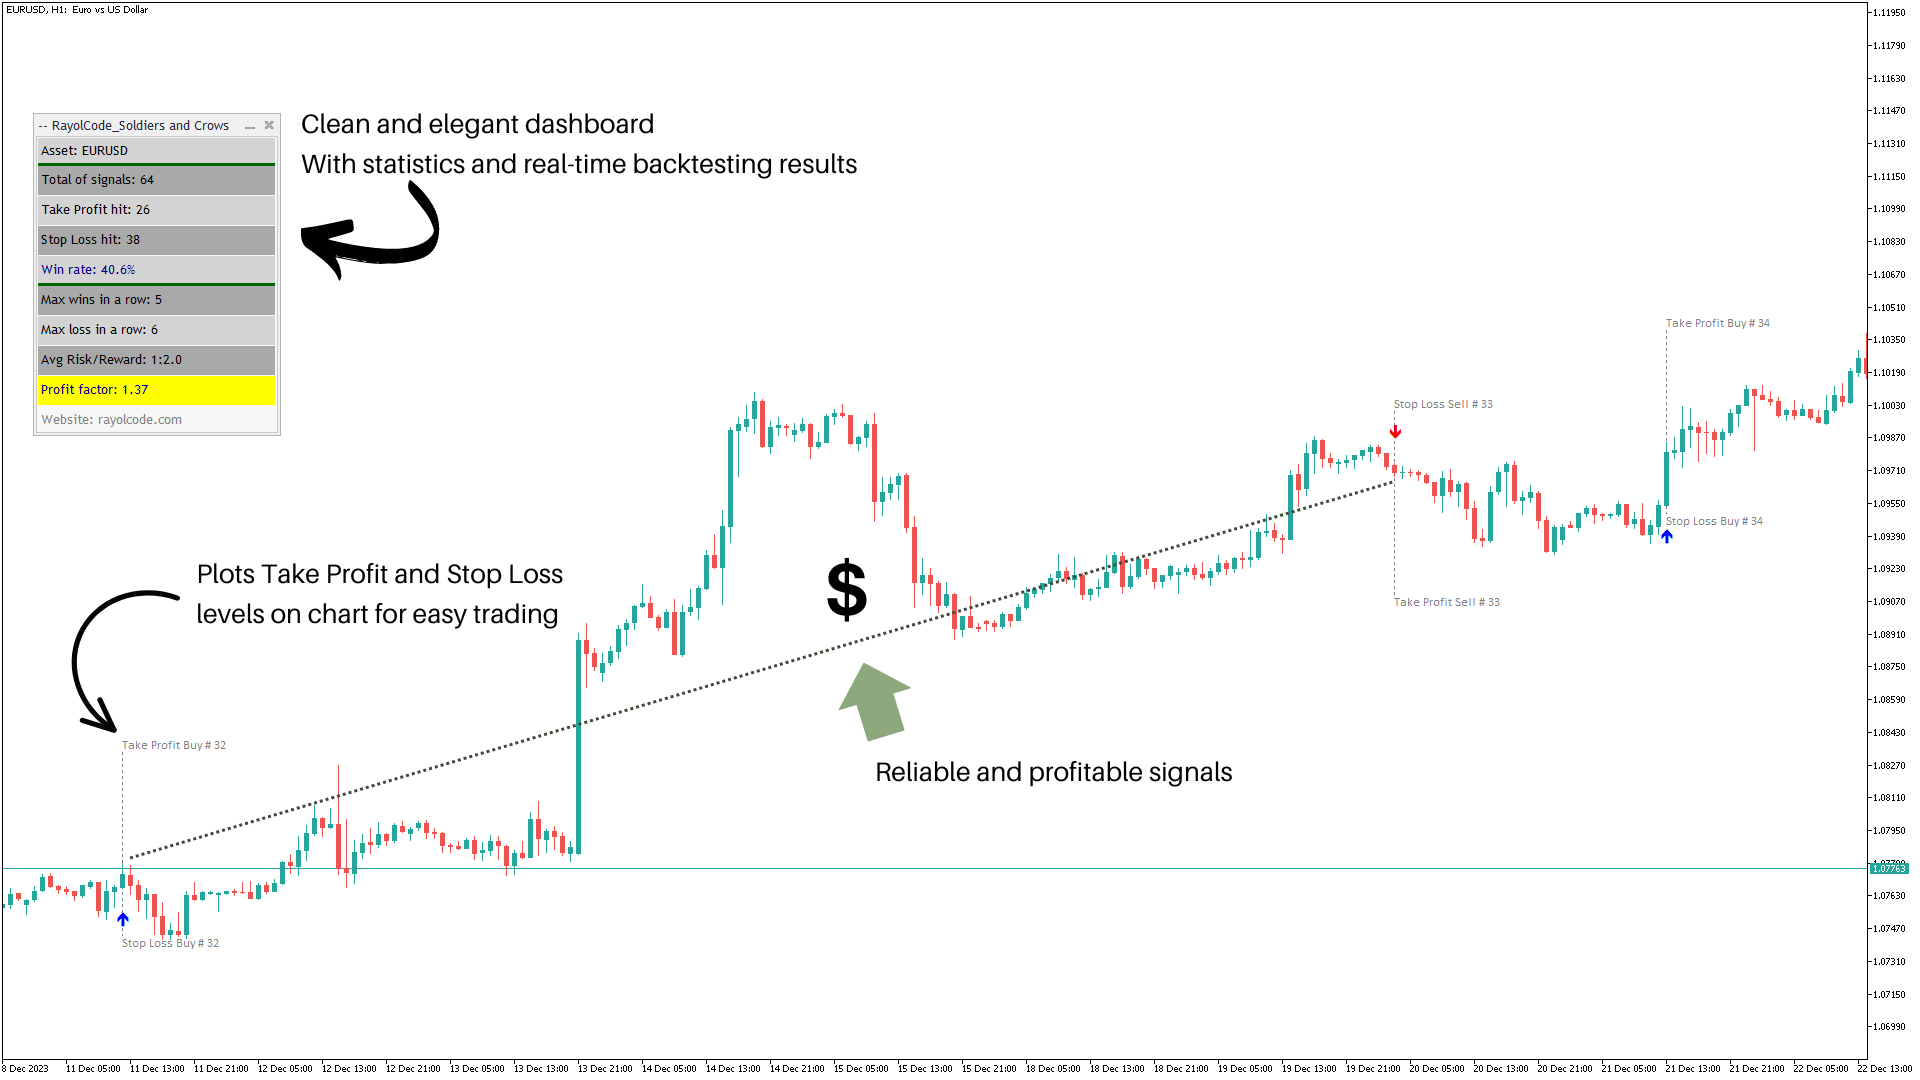
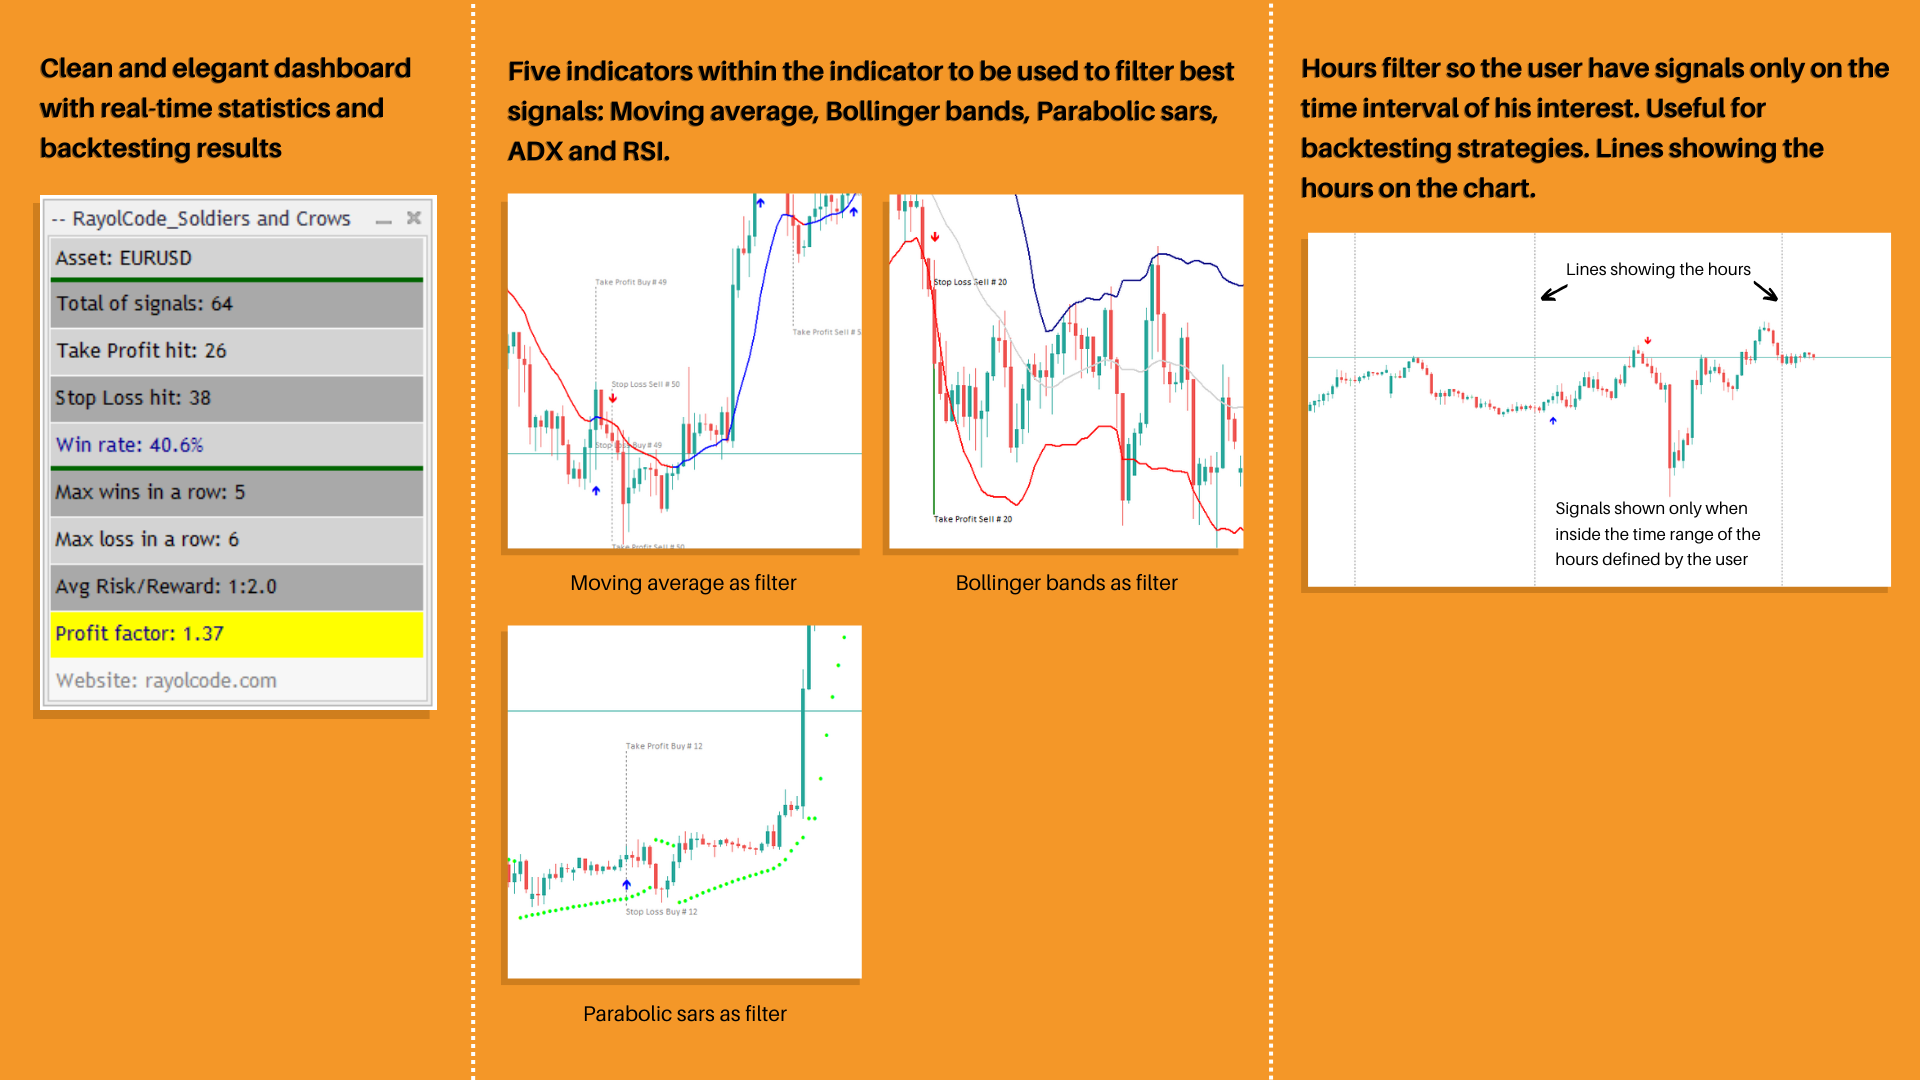
- Clean panel with real-time backtesting and statistics informations
- Offers many different traditional indicators to filter the signals (Moving Average, Bollinger Bands, Parabolic Sars, ADX and RSI), allowing them to be used together within the indicator itself to optimize the best signals suitable for the user's strategy and knowledge
- Time hours filter, so that the user can backtest and have signals only within the time range compatible to his trading routine
- Displays Take Profit and Stop Loss levels defined by the user based on: a) Fixed points, b) Pivot levels or c) x candles before the signal
- Switch on/off Alerts and App Notifications when new signals occur
- Does not repaint
- Can be easily convert its signals into an Expert Advisor. Full support granted.
FOR MT4 VERSION: CLICK HERE
//+-------------------------------------------------------------------------+
//|                                  	     RC_Soldiers_Crows_EA_Sample.mq5|
//|                                          Copyright 2024, Francisco Rayol|
//|                                                https://www.rayolcode.com|
//+-------------------------------------------------------------------------+
#property description "RC_Soldiers_Crows_EA_Sample"
#property version   "1.00"
#property strict
#property script_show_inputs

#include <Trade\Trade.mqh>
#include <Trade\PositionInfo.mqh>

CTrade         Ctrade;
CPositionInfo  Cposition;

enum en_options
  {
   Yes = 0,             // Yes
   No = 1,              // No
  };

enum tp_type
  {
   Fixed_tp = 0,        // Fixed Take Profit
   Indicator_tp = 1,    // Take Profit from indicator
  };

enum sl_type
  {
   Fixed_sl = 0,        // Fixed Stop Loss
   Indicator_sl = 1,    // Stop Loss from indicator
  };

//--- input parameters
input int              inMagic_Number = 18272;          // Magic number
//----
input double           inLot_Size = 0.01;               // Initial lot size
//----
input tp_type          inTP_Type = 0;                   // Choose Take Profit method
input double           inTake_Profit = 150.0;           // Fixed Take Profit (in points)
input sl_type          inSL_Type = 0;                   // Choose Stop Loss method
input double           inStop_Loss = 100.0;             // Fixed Stop Loss (in points)
//----
//+------------------------------------------------------------------+
//|                                                                  |
//+------------------------------------------------------------------+
//--- signal handles
int   handle_rc_soldiers_crows;
//--- signal arrays
double RC_Buy_Signal[], RC_Sell_Signal[], RC_Take_Profit[], RC_Stop_Loss[];
//--- global variables
int   initial_bar;

//+------------------------------------------------------------------+
//| Expert initialization function                                   |
//+------------------------------------------------------------------+
int OnInit()
  {
//---
   initial_bar = iBars(_Symbol,_Period);
//---
//--- RC Soldiers and Crows indicator handle
   handle_rc_soldiers_crows = iCustom(_Symbol, PERIOD_CURRENT, "\\Indicators\\Market\\RC_Soldiers_Crows.ex5");
   if(handle_rc_soldiers_crows == INVALID_HANDLE)
     {
      Print("Error getting information from \"RC_Soldiers_Crows\" indicator, check input parameters and try again");
      Alert("Error getting information from \"RC_Soldiers_Crows\" indicator, check input parameters and try again");
      return(INIT_FAILED);
     }
//---
   ArraySetAsSeries(RC_Buy_Signal, true);
   ArraySetAsSeries(RC_Sell_Signal, true);
   ArraySetAsSeries(RC_Take_Profit, true);
   ArraySetAsSeries(RC_Stop_Loss, true);
//---
   Ctrade.SetExpertMagicNumber(inMagic_Number);
//---
   return(INIT_SUCCEEDED);
  }
//+------------------------------------------------------------------+
//| Expert deinitialization function                                 |
//+------------------------------------------------------------------+
void OnDeinit(const int reason)
  {
//---
   Comment("");
  }
//+------------------------------------------------------------------+
//| Expert tick function                                             |
//+------------------------------------------------------------------+
void OnTick()
  {

//--- Ask and Bid prices
   double Ask = SymbolInfoDouble(_Symbol,SYMBOL_ASK);
   double Bid = SymbolInfoDouble(_Symbol,SYMBOL_BID);
//+------------------------------------------------------------------+
//--- Indicator Signals
//--- RC_Soldiers_Crows signal: buy
   if(CopyBuffer(handle_rc_soldiers_crows,0,0,2,RC_Buy_Signal)<=0) // Buy signal
     {
      Print("Getting RC_Soldiers_Crows data is failed! Error ",GetLastError());
      return;
     }
//--- RC_Soldiers_Crows signal: sell
   if(CopyBuffer(handle_rc_soldiers_crows,1,0,2,RC_Sell_Signal)<=0) // Sell signal
     {
      Print("Getting RC_Soldiers_Crows data is failed! Error ",GetLastError());
      return;
     }
//--- RC_Soldiers_Crows signal: take profit
   if(CopyBuffer(handle_rc_soldiers_crows,10,0,2,RC_Take_Profit)<=0) // Take Profit price
     {
      Print("Getting RC_Soldiers_Crows data is failed! Error ",GetLastError());
      return;
     }
//--- RC_Soldiers_Crows signal: stop loss
   if(CopyBuffer(handle_rc_soldiers_crows,11,0,2,RC_Stop_Loss)<=0) // Stop Loss price
     {
      Print("Getting RC_Soldiers_Crows data is failed! Error ",GetLastError());
      return;
     }
//+------------------------------------------------------------------+
//---
   if(!F_CheckOpenOrders() && initial_bar!=iBars(_Symbol,_Period))
     {
      if(RC_Buy_Signal[1] != 0.0 && RC_Buy_Signal[1] != EMPTY_VALUE)
        {
         if(Ctrade.Buy(inLot_Size, _Symbol, Ask, inSL_Type == 0 ? Bid - inStop_Loss*_Point : RC_Stop_Loss[1],
                       inTP_Type == 0 ? Ask + inTake_Profit*_Point : RC_Take_Profit[1],"Buy open"))
           {
            initial_bar = iBars(_Symbol,_Period);
           }
         else
            Print("Error on opening buy position :"+IntegerToString(GetLastError()));
        }
      else
         if(RC_Sell_Signal[1] != 0.0 && RC_Sell_Signal[1] != EMPTY_VALUE)
           {
            if(Ctrade.Sell(inLot_Size, _Symbol, Bid, inSL_Type == 0 ? Ask + inStop_Loss*_Point : RC_Stop_Loss[1],
                           inTP_Type == 0 ? Bid - inTake_Profit*_Point : RC_Take_Profit[1],"Sell open"))
              {
               initial_bar = iBars(_Symbol,_Period);
              }
            else
               Print("Error on opening sell position :"+IntegerToString(GetLastError()));
           }
     }
//---
  }
//---
//+------------------------------------------------------------------+
//+------------------------------------------------------------------+
bool F_CheckOpenOrders()
  {
   for(int i = 0; i<PositionsTotal(); i++)
     {
      Cposition.SelectByIndex(i);
        {
         long ord_magic = PositionGetInteger(POSITION_MAGIC);
         string ord_symbol = PositionGetString(POSITION_SYMBOL);
         ENUM_POSITION_TYPE type = Cposition.PositionType();
         if(ord_magic==inMagic_Number && ord_symbol==_Symbol)
            return(true);
        }
     }
   return(false);
  }
//+------------------------------------------------------------------+
How to trade using this indicator
Although the indicator can be used as a trading system in itself, as it offers information about the Win Rate and Profit Factor, it can also be used in conjunction with some trading systems shown below:
#1 As a confirmation trend in a Moving Average crossing setup
Setup: One fast exponential moving average with 50 periods, one slow exponential moving average with 200 periods, timeframe M5, any volatile asset like XAUUSD for example.
Wait for a crossover between the two averages above. After that, open a position only when the indicator gives a signal after this crossover and in the direction of the trend signaled by the crossing of the faster average in relation to the slower one. Set stop loss at Pivot points for a higher hit rate. (click here for more details)
#2 As a confirmation signal on a Breakout system
Setup: Find the current main trend, draw a consolidation channel and look for breakouts in the direction of it. When the indicator gives a signal outside the channel confirming the breakout open a correspondent position. (click here for more details)
#3 Swing trading on higher timeframes using the inner Moving Average filter
Setup: Add the indicator on a high timeframe like H4 or higher. Use the Moving Average filter, present in the indicator itself. After that, also activate the "One signal direction at a time" option.
Open a buy position when the indicator signals it and close it only when a new sell signal appears or vice versa.
//----
Best results are obtained if you use this setup in the direction of the larger trend and open orders only in its direction, especially in assets that have a clearly defined fundamental bias such as the SP500, Nasdaq index or even Gold. (click here for more details)
I also strongly recommend reading the article "Trading with a Bias vs. Trading without a Bias: A Deep Dive on How to Boost your Performance in Automatic Trading" for a better understanding on how to achieve better results with algo trading. (click here)
Input parameters
- Setup defintion: Set the sequence of candles to get the pattern verified; Set how many candles in the past to analyze; Choose which signals to be shown; Only when reversal signal is detected before the pattern; One signal at a time; Reverse the signal; Show statistic panel
- Visual aspects: Up arrow color; Down arrow color; Take profit line color; Stop loss line color; Color for active current signal; Color for past signals
- Trade regions definition: Show regions of stop loss; Set the stop loss model (1 - on pivot levels, 2 - fixed points, 3 - candle of sequence); Show regions of take profit, Set the take profit model (1 - fixed points, 2 - x times multiplied by the stop loss)
- Maximum values definition: Set a maximum value for stop loss in points (true or false); Maximum stop loss points; Set a maximum value for take profit in points (true or false); Maximum take profit points
- Indicator filter: Choose which indicator to use as a filter (1 - No indicator filter, 2 - Moving average filter, 3 - Bollinger bands filter, 4 - ADX filter, 5 - RSI filter)
- Hour filter: Use hour filter (true or false); Show hour filter lines (true or false); Time to start hour filter (Format HH:MM); Time to finish hour filter (Format HH:MM)
- Alert definition: Sound alert every new signal (true or false); Alert pop-up every new signal (true or false); Send notification every new signal (true or false)
Disclaimer
By purchasing and using this indicator, users agree to indemnify and hold harmless its author from any and all claims, damages, losses, or liabilities arising from the use of the indicator. Trading and investing carry inherent risks, and users should carefully consider their financial situation and risk tolerance before using this indicator.


Awesome indicator, thanks for your quick response.