• Übersicht
  • Bewertungen
  • Diskussion

ParbMA The Most Intuitive Parabolic SAR

Im Bereich der technischen Analyse zeigt sich ParbMA als äußerst intuitive Werkzeug zur Untersuchung des Parabolic SAR-Trends. Dieser innovative Ansatz nutzt eine anpassbare Linie, die sich durch ihre Vielseitigkeit in Farb-, Form- und Breitenoptionen auszeichnet. Diese Flexibilität verbessert die visuelle Analyse erheblich und unterstützt wesentlich bei der Entwicklung von Strategien und Entscheidungsfindung.

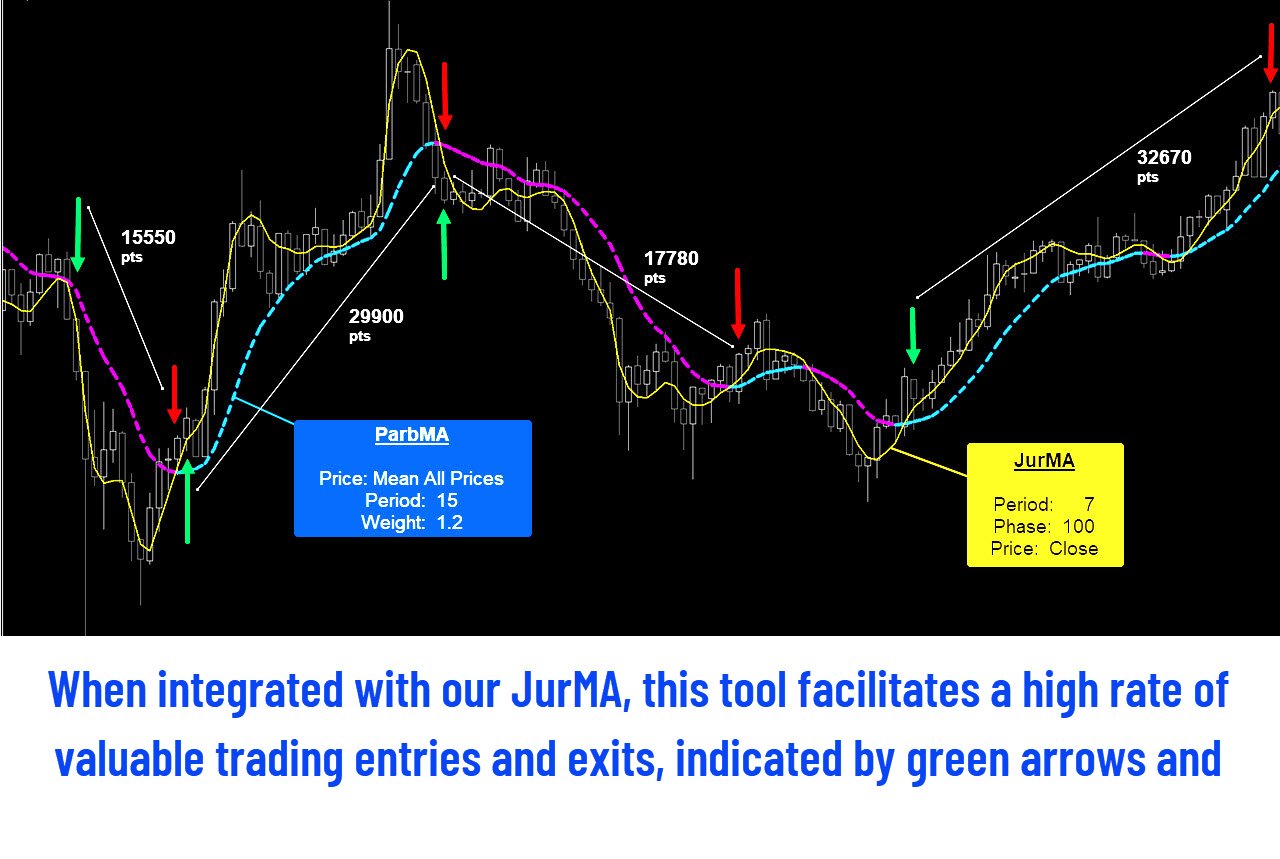
Das ParbMA (Parabolic Moving Average) ist ein individueller technischer Indikator, der die Konzepte des Parabolic SAR (Stop and Reverse) von J. Welles Wilder und eines gleitenden Durchschnitts kombiniert. Dieser Hybridindikator soll Tradern ein Werkzeug bieten, das die Vorteile beider Methoden einfängt und eine einzigartige Möglichkeit bietet, Preisentwicklungen und potenzielle Umkehrpunkte auf den Finanzmärkten zu verfolgen.

Hauptmerkmale von ParbMA

Anpassbare visuelle Darstellung: Im Kern von ParbMA steht die Fähigkeit, Trends durch eine Linie darzustellen. Benutzer können diese Linie nach ihren Vorlieben gestalten und dabei aus einer Vielzahl von Farben, Formen und Breiten wählen. Diese Anpassungsebene stellt sicher, dass die Trenddarstellung perfekt zum analytischen Stil und den Anforderungen des Benutzers passt.

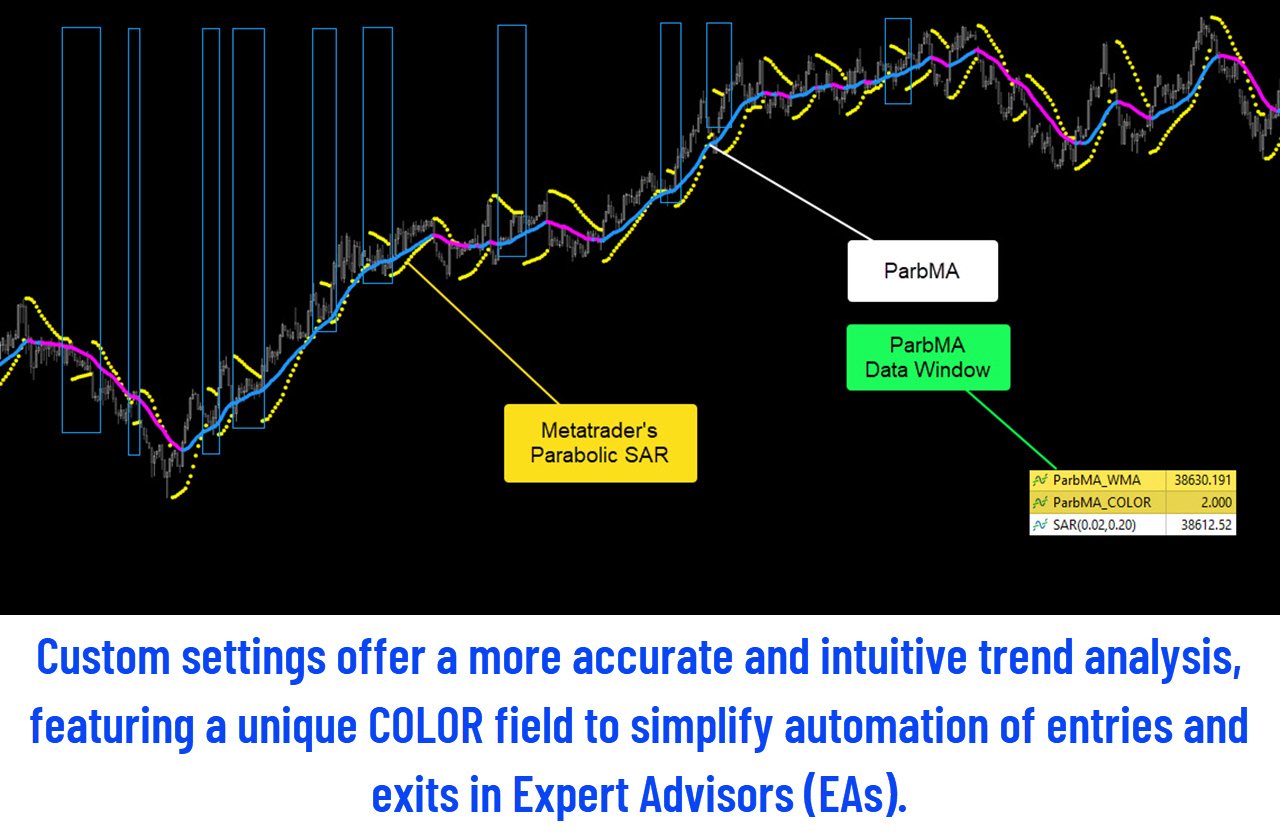
Einfache Integration mit Expert Advisors (EAs): Die Nützlichkeit von ParbMA erstreckt sich in den Bereich der Expert Advisors und bietet einen klaren Vorteil für automatisierte Handelsstrategien, die vom Parabolic SAR unterstützt werden: die Einbeziehung eines "Farbfelds", das die Umsetzung einer Strategie vereinfacht, die von Farbänderungen abhängt. Durch Bereitstellung eines einfach interpretierbaren, farbcodierten Systems ermöglicht ParbMA Programmierern, Verschiebungen in Trends zu identifizieren und ihre Strategie entsprechend schnell anzupassen. Diese nahtlose und effiziente Integration verbessert die Fähigkeiten von EAs in der Trendanalyse.

ParbMA zeichnet sich als umfassendes und benutzerfreundliches Tool zur Analyse des Parabolic SAR-Trends aus. Die Kombination von anpassbaren visuellen Elementen und der innovativen Farbfeldfunktion macht es zu einer unschätzbaren Ressource sowohl für manuelle Trader als auch für diejenigen, die Expert Advisors nutzen. Durch die Vereinfachung und Verbesserung des Trendanalyseprozesses ebnet ParbMA den Weg für effizientere und wirksamere Handelsstrategien.

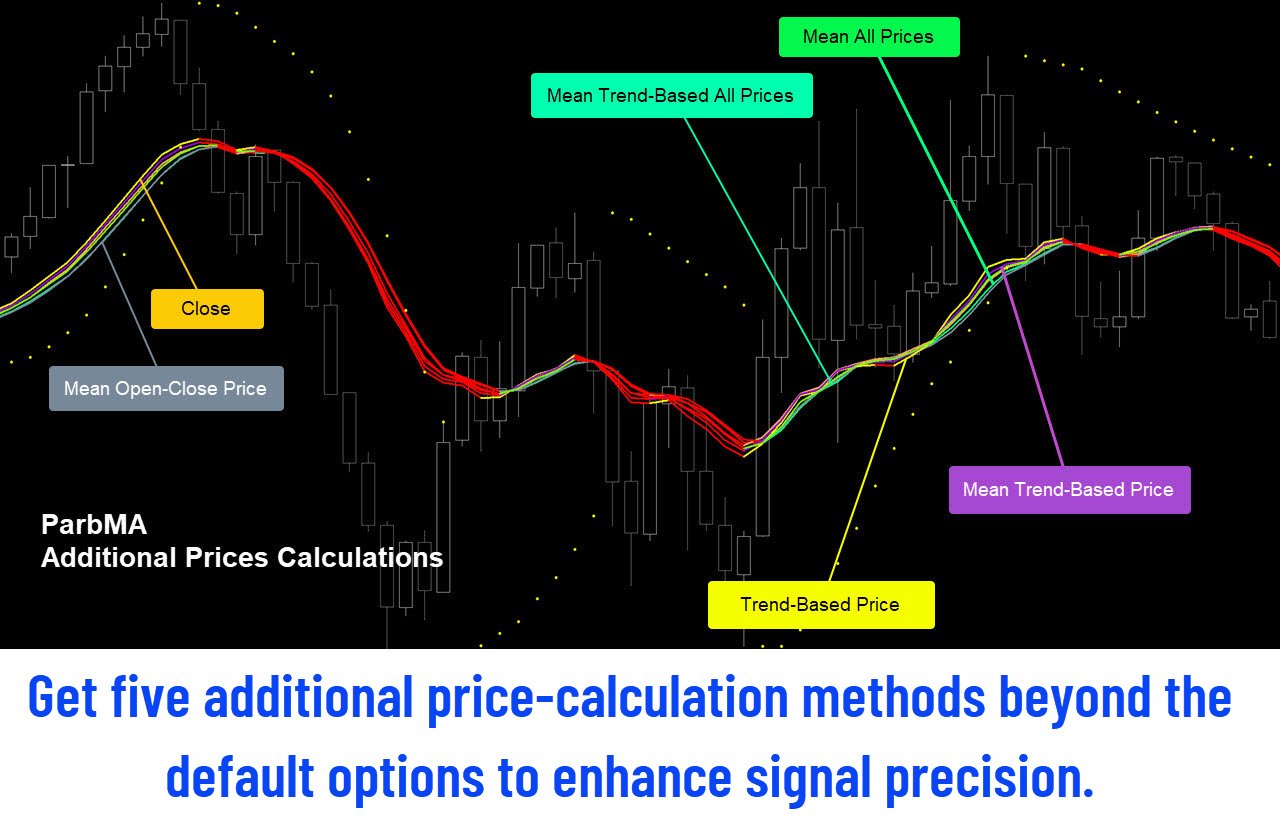
Zusätzlich bietet ParbMA eine vielfältige Auswahl an Preisberechnungsoptionen, die die standardmäßigen Preisberechnungen in der MetaTrader-Plattform ergänzen:

Metatrader-Standard (Schluss, Eröffnung, Hoch, Tief, Median, Typisch, Gewichtet); Durchschnitt von Eröffnung bis Schluss; Durchschnitt aller Preise; Trendbasiert (Hoch für Bullenkerze, Tief für Bärenkerze, sonst Schluss); Trendbasiertes Mittel; Mittlerer Trendbasierte Alle Preise Gewichtet.

Funktionen

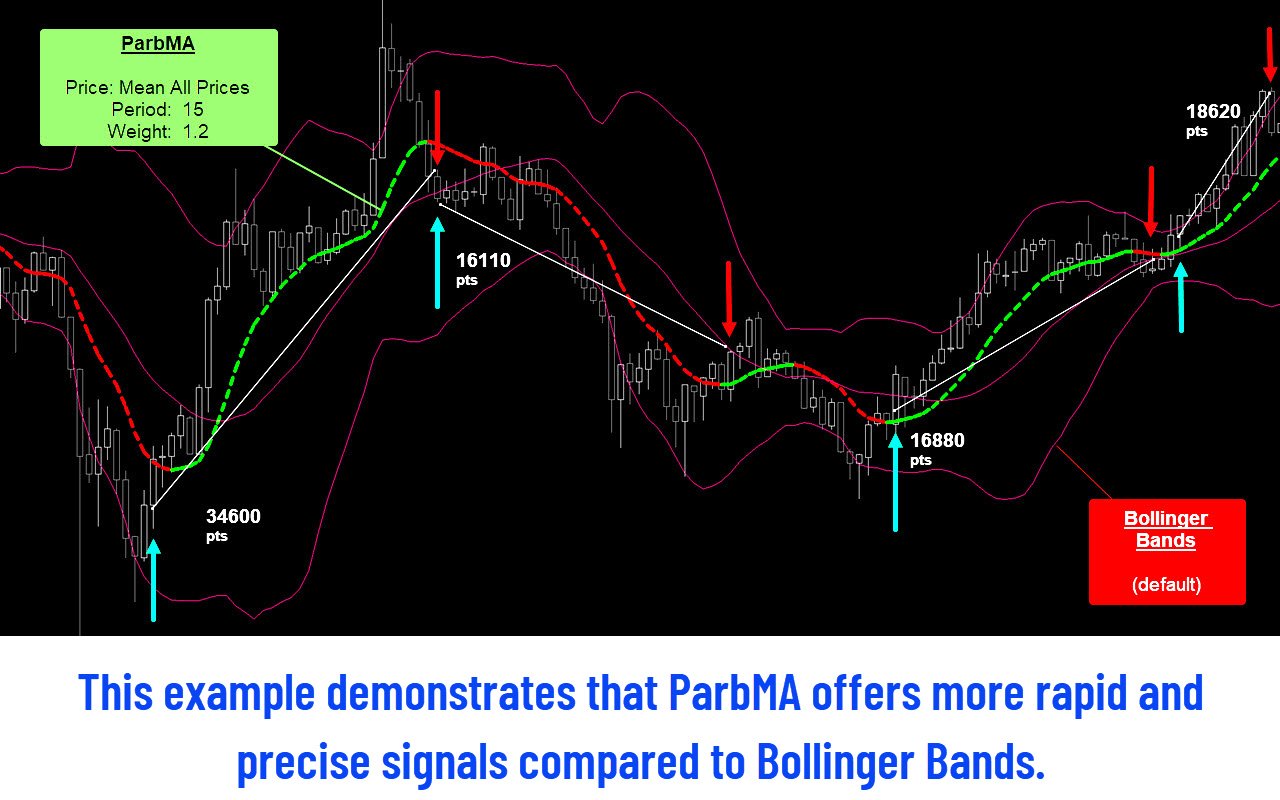
  • Nicht neu zeichenbasierter Parabolic-SAR-Indikator auf Linienbasis, Optimierung der Identifizierung von Stopps und Umkehrungen in Trends.
  • Exklusiver MA-Ansatz zur Verbesserung des Parabolic-SAR für kurz- und langfristige Trades.
  • Exklusive 2-Farben-Linie für eine einfachere und schnellere Visualisierung des Parabolic-SAR. 
  • Exklusives COLOR-Datenfeld zur Verwendung in EA, erleichtert die Anpassung von Legacy-Strategien an eine schnellere Operation.
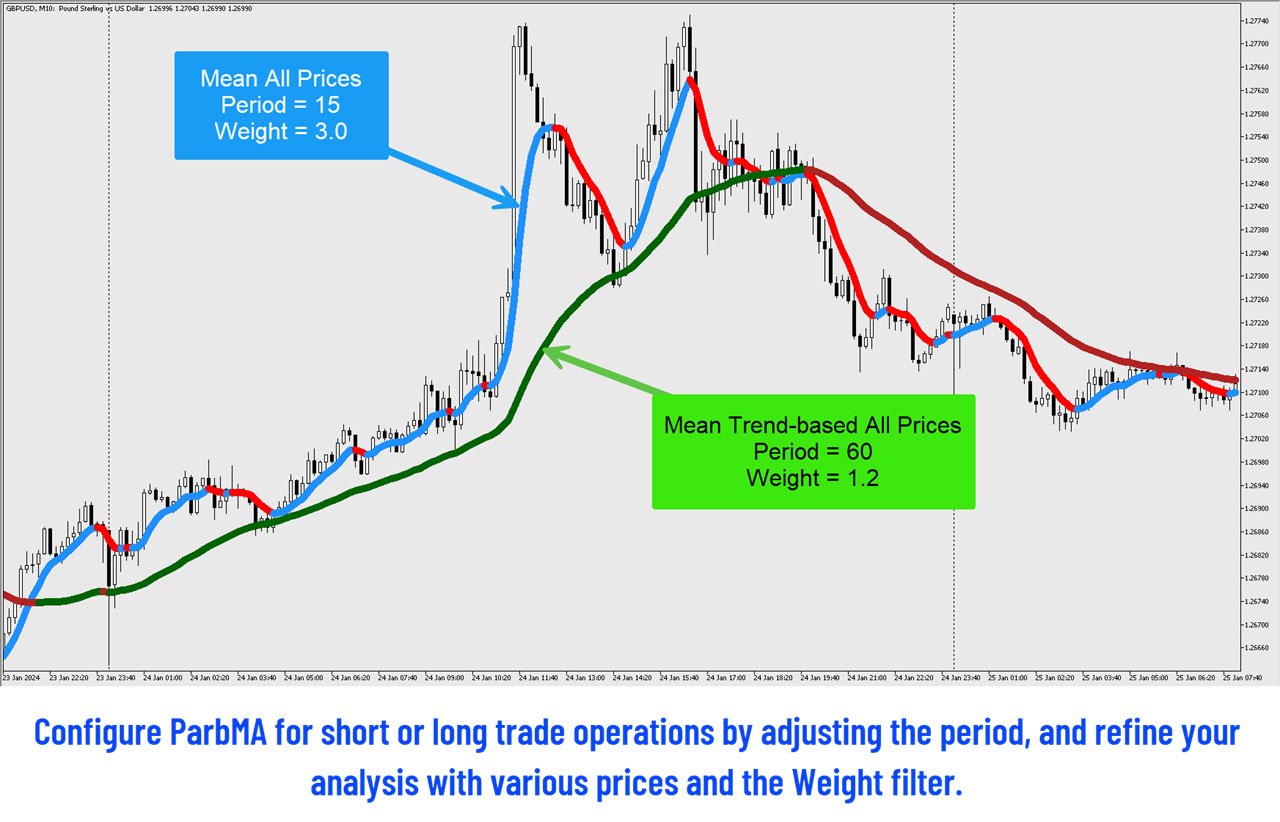
  • PERIOD- und WEIGHT-Parameter zur vollständigen Anpassung für jedes Asset und jeden Zeitrahmen. 
  • Schnellere Durchschnittsberechnung als iMA() und andere technische Indikatoren von MetaTrader.
  • 12 verschiedene Preisberechnungen (7 Metatrader-Standard + 5 benutzerdefinierte Berechnungen).
  • Ermöglicht freies Ändern von Stil, Farbe und Breite seiner Linie.
  • Kann mit jedem ASSET und ZEITRAHMEN verwendet werden. Akzeptiert die Integration in "Expert-Advisor" über iCUSTOM-Aufruf.


Empfohlene Produkte
The SuperTrend MTF indicator is an excellent trend tracking indicator . It can not only display SuperTrend trends within the timeframe of the chart, but also set up to display SuperTrend trends for larger time frames simultaneously . This will be beneficial for grasping trends at a larger time scale and predicting future trends . At the same time, the price of the trend line can also be displayed at a glance, making it easy to observe. Input parameters :  ATR period used at chart timeframe   
Ichimoku MTF
Hoang Ngoc Thach
MTF Ichimoku is a MetaTrader 5 indicator based on well known Ichimoku. In MetaTrader 5 we have Ichimoku already included as a standard technical indicator. However it can be used only for the current timeframe. When we are looking for a trend, it is very desirable to have Ichimokuis showing higher timeframes. MTF Ichimoku presented here has additional parameter - TimeFrame. You can use it to set up higher timeframe from which Ichimokuis will calculate its values. Other basic parameters are not c
Bober Real MT5
Arnold Bobrinskii
4.76 (17)
Bober Real MT5 is a fully automatic Forex trading Expert Advisor. This robot was made in 2014 year and did a lot of profitbale trades during this period. So far over 7000% growth on my personal account. There was many updates but 2019 update is the best one. The robot can run on any instrument, but the results are better with EURGBP, GBPUSD, on the M5 timeframe. Robot doesn't show good results in tester or live account if you run incorrect sets. Set files for Live accounts availible only for cu
Trend Direction ADX indicator Trend Direction ADX is part of a serie of indicators used to characterize market conditions. Almost any strategy only work under certain market conditions. Therefore it is important to be able to characterize market conditions at any time: trend direction, trend strength, volatility, etc.. Trend Direction ADX is an indicator to be used to characterize trend direction: trending up trending down ranging Trend Direction ADX is based on ADX standard indicator. Tre
Golden Spike Premium
Kwaku Bondzie Ghartey
Golden Spikes Detector Acknowledgement and Dedications:  The name of this indicator was Inspired by an Original; Mr Grant Koopman; a Knowledgeable and experienced Synthetics trader. I dedicate this indicator to Mr Grant.  Overview:   The Golden Spikes Premium is a groundbreaking trading indicator meticulously crafted for the Boom and Crash indices on the Deriv market. Tailored to meet the needs of discerning traders, this powerful tool operates exclusively on the one-minute timeframe, providing
Boom and Crash Sniper Spike Detector - Boom 1000 The Boom and Crash Sniper Spike Detector is the ultimate tool for spike trading on Boom 1000, offering clear and reliable signals to help you capture high-probability trades. This advanced indicator is designed to enhance your trading strategy by simplifying spike detection and maximizing your profits. Key Features: Multi-Timeframe Compatibility : The indicator can be used on M1, M5, M15, M30, and H1 timeframes, but it works best on the M1 timefra
Meet the Tweezer Hunter, an essential tool for every Forex trader looking to make accurate, trend-following trades. This powerful, intuitive indicator helps traders spot potential trend reversals before they happen, providing a significant advantage in the fast-paced world of Forex trading. The Tweezer Hunter is more than your average tweezer candle indicator; it's designed with a built-in trend identification feature that accurately detects whether the market is bearish or bullish. By integrat
This is Multiple Timeframe of Malaysia SNR Levels and Storyline. The single timeframe version here Features: + Display level on multiple timeframe (higher or lower) + Turn on/off level on timeframe + Alert when price touch level 1. if high > resistance level but close of candle < resistance level , this level become unfresh - Name of level will have "(m)" meaning mitigated if close of candle > resistance level , this level become invalid and can be removed in chart (there is setting for keep/rem
Contact me for instruction, any questions! Introduction V Bottoms and Tops are popular   chart patterns   among traders due to their potential for identifying trend reversals. These patterns are characterized by sharp and sudden price movements, creating a V-shaped or inverted V-shaped formation on the   chart . By recognizing these patterns, traders can anticipate potential shifts in market direction and position themselves accordingly.  V pattern is a powerful bullish/bearish reversal pattern
Divergence MACD indicator shows price and MACD indicator divergence. The indicator is not redrawn! The algorithm for detection of price and MACD extremums has been balanced for the earliest entry allowing you to use the smallest SL order possible. The indicator displays all types of divergences including the hidden one, while having the minimum number of settings. Find out more about the divergence types in Comments tab. Launch settings: Max Bars - number of bars calculated on the chart. Indent
GENERAL OVERVIEW Introducing our new KDE Optimized RSI Indicator! This indicator adds a new aspect to the well-known RSI indicator, with the help of the KDE (Kernel Density Estimation) algorithm, estimates the probability of a candlestick will be a pivot or not. For more information about the process, please check the "HOW DOES IT WORK ?" section. Features of the new KDE Optimized RSI Indicator : A New Approach To Pivot Detection Customizable KDE Algorithm Realtime RSI & KDE Dashboard Alert
SignalArrow
Pavel Krysanov
Der Hauptzweck des Indikators besteht darin, die Zeitpunkte von Ein- und Ausstiegen aus Transaktionen zu bestimmen. Daher zeichnet ExactArrow nichts anderes als Pfeile, die die Orte für den Ein- und Ausstieg in den Markt anzeigen. Trotz der scheinbaren Einfachheit des Indikators verfügt er in seinem Inneren über komplexe Analysealgorithmen, mit deren Hilfe das System die Zeitpunkte der Ein- und Ausstiege bestimmt. Der Indikator gibt genaue und zeitnahe Signale zum Ein- und Ausstieg aus einem
ATR Line
Evgeny Levchenko
The indicator - "ATR Line" determines the current trend and gives signals to buy (green arrow to the top) or sell (red arrow to the bottom). The indicator calculation is based on the deviation of the average price of the instrument from its average true range - ATR. The moving average of prices is used to reduce "market noise". If the main line of the indicator - "ATR Line" is lower the instrument price chart, then the market is in a "bullish" trend. If the main line of the indicator is higher t
Marcon s Deviation
Luiz Antonio De Sousa Marcon
DESVIO DE MARCON  (Desvio Dinâmico de VWAP) O Desvio de Marcon é um indicador desenvolvido com o intuito de fornecer ao TRADER uma ferramenta capaz de antecipar pontos relevantes de suporte e resistência através de canais de desvios de VWAP traçados no gráfico.  Mas qual a diferença entre o Desvio de Marcon e os canais de desvio padrão da VWAP já existentes? O Desvio de Marcon utiliza um algoritmo estatístico desenvolvido por Luiz Antonio de Sousa Marcon, que lhe dá a capacidade de se auto calib
SlopeChannelB MT5
MIKHAIL VINOGRADOV
SlopeChannelB – ein technisches Analysewerkzeug, das einen geneigten Preisbewegungskanal erstellt und einzigartige Möglichkeiten bietet, den aktuellen Marktstatus zu bewerten und Handelssignale zu finden. Hauptmerkmale des Indikators: Geneigter Preisbewegungskanal : Der Indikator hilft dabei, Unterstützungs- und Widerstandsniveaus zu visualisieren, die mögliche Umkehrpunkte oder die Fortsetzung des Trends anzeigen können. Verschiedene Linienfarben und Hintergrundhervorhebung : Geneigte Unte
The "RMA Signal Indicator MT5" refers to an indicator called "RMA" (Running Moving Average) Signal Indicator designed specifically for the MetaTrader 5 (MT5) trading platform. The RMA is a variation of the Moving Average indicator that emphasizes recent price data. The specific details and functionality of the "RMA Signal Indicator MT5" may depend on the developer or the version you are using. However, in general, here is a general approach to using a signal indicator like RMA on the MT5 platfor
Ichimoku Kinko Hyo is a purpose-built trend trading charting system that has been successfully used in nearly every tradable market. It is unique in many ways, but its primary strength is its use of multiple data points to give the trader a deeper, more comprehensive view into price action. This deeper view, and the fact that Ichimoku is a very visual system, enables the trader to quickly discern and filter "at a glance" the low-probability trading setups from those of higher probability. This i
VarMomentPulse is a unique manual trading algorithm developed with precision and flexibility in mind, based on an extensive historical data cluster.  Its operation is grounded in the principles of analyzing crossovers between normalized moving averages and dispersions across various time intervals, enabling it to uncover new opportunities in evaluating market trends. Key Features of the VarMomentPulse Indicator: Adaptability to Volatility:The use of price dispersion analysis allows VarMomentPul
The Matrix Series indicator analyzes price action, moving averages, and volatility to detect trending conditions. Bullish Trend: Green zones or upward signals indicate a strong uptrend, ideal for long positions. Bearish Trend: Red zones or downward signals suggest a downtrend, perfect for short positions. Sideways/Neutral Market: Non-highlighted or gray zones show periods of market consolidation or low momentum, helping you avoid false signals. Use Cases: Trend Confirmation: Use the indicator to
Antabod Multiplier
Rev Anthony Olusegun Aboderin
Antabod Multiplier , the ultimate trading indicator designed to simplify your decision-making process and maximize your trading potential. Built with a robust combination of moving averages and stochastic oscillators, this tool provides clear, actionable signals for both buy and sell opportunities. The Antabod Multiplier stands out with its dynamic trend detection and precision filtering, giving you real-time visual signals to catch trend reversals and optimal entry/exit points with ease. Whethe
Swing or Scalp Mt5
Jermaine Wedderburn
Continuous Coloured dot lines under and above price when conditions are met. Arrows Red and Green for entry Points.  User can change the colours of the arrows in the colour section of the indicator.  It is consider a great scalping tool on lower time-frames, while higher time frames will have fewer opportunities but trades will possibly last longer.  There is an input for Alert on or off.  This can be used effectively on M15/M30 Chart until up to H4 chart time.  It is best if the user has some
Day Channel   Der Indikator zeichnet einen Kanal, der auf den Extremwerten von Balken aus dem in den Einstellungen festgelegten älteren Zeitraum basiert, und zeigt auch das Niveau der Schlusskurse an. Damit der Indikator korrekt funktioniert, muss die aktuelle Periode, für die der Indikator gesetzt wird, kleiner sein als der in den Indikatoreinstellungen angegebene Zeitraum. Beschreibung der Anzeigeeinstellungen: TimeFrame - Auswahl eines Zeitraums zum Zeichnen von Indikatorniveaus. Standardmäßi
ZLMA Trend Candles indicator uses an enhanced Zero-Lag Moving Average to highlight key trend shifts, repainting candles in real time. It reacts faster than traditional moving averages, helping you spot potential market turns earlier. Gain clear entry and exit signals and filter out market noise with ease! This product is also available for MetaTrader 4 =>  https://www.mql5.com/en/market/product/129279 1. What Is ZLMA Trend Candles? ZLMA Trend Candles is a MetaTrader 4/5 indicator based on the Z
Flow MTF
Guillaume Jouans
This indicator takes as parameters the periods for three moving averages (Short, Long, Very_Long) and displays them for the current timeframe: - in the form of a cloud (green if Short is greater than Long, red if Short is less than Long) - as a line for the Very_Long moving average. It also allows you to display the status (BUY or SELL) of these same moving averages but for the M15, H1, H4, W1 and MN1 timeframes. This information is summarized in the window titled "TREND", where, for each timefr
ExactArrows for MT5
Pavel Krysanov
3 (3)
The main objective of this indicator is to determine entry and exit points, that is why ExactArrow draws nothing but arrows showing entry and exit points. In spite of apparent simplicity of the indicator, it has complicated analytic algorithms which determine entry and exit points. The indicator generates exact and timely entry and exit signals which appear on the current candle. The indicator generates an average of 1-2 candles before its analogues do. The indicator is very easy to use. Open Bu
Advanced 4xZeovo MT5 Indicator (MetaTrader 5)   Product Description  4xZeovo is a powerful trading indicator system monitoring 24/7 financial markets. Metatrader5 tool designed to find the best buying/selling opportunities and notifies the user.    Making life easy for traders in helping with the two most difficult decisions with the use of advanced innovate trading indicators aiming to encourage users to hold the winning positions and take profit at the best times.    Equipped with a unique tra
Visual EMA MultiFlex Indicator
AL MOOSAWI ABDULLAH JAFFER BAQER
Visual EMA MultiFlex Indicator - Master the Trends with Precision! Achieve trading mastery with the Visual EMA MultiFlex Indicator , a dynamic tool designed to enhance your decision-making by combining the power of three Exponential Moving Averages (EMAs). Whether you're a beginner or an experienced trader, this indicator is your gateway to identifying precise market entries and exits. How It Works: The Visual EMA MultiFlex Indicator leverages Short, Medium, and Long EMAs to analyze ma
Fractal 358 Plus
Renato Fridschtein
Fractal 358 Plus is a predictive indicator that provides the clearest sight of price movements. Identifying graphic patterns such as Caixote (Crate), Pivot and Inside Candle , it shows entries and exits spots, as well as threats to your trades in the markets. It comes ready to use with B3 Mini Index (WIN$ series) and can be adjusted to use with any asset and timeframe. Fractal 358 unravels price movement Based on the Fibonacci sequence, Fractal 358 is a new and different way of reading and und
Ichimoku Tecnic
Ignacio Agustin Mene Franco
Ichimoku technic . is a candlestick indicator, which captures bullish and bearish trends according to its sail color! where there are breaks, it also captures with candle colors, The 2 most important colors to hunt trends are red and aqua, where clearly by color it tells you when it goes up or down, Serve for all seasons! It works for the forex markets and synthetic indices, also crypto! World Investor. Good profit!
Linear Regression is a statistical method used to model the relationship between two or more variables. The primary goal of Linear Regression is to predict the value of one variable (called the dependent variable or outcome variable) based on the value of one or more other variables (called independent variables or explanatory variables) Linear Regression can be applied to technical analysis, and it is indeed one of the tools used by traders and analysts to make predictions and identify trends i
Käufer dieses Produkts erwarben auch
RelicusRoad Pro MT5
Relicus LLC
4.78 (18)
Jetzt 147 US -Dollar (nach ein paar Aktualisierungen auf 499 US -Dollar) - Unbegrenzte Konten (PCs oder MACs) RelicusRoad Benutzerhandbuch + Schulungsvideos + Zugang zur privaten Discord-Gruppe + VIP-Status EINE NEUE ART, DEN MARKT ZU BETRACHTEN RelicusRoad ist der weltweit leistungsstärkste Handelsindikator für Forex, Futures, Kryptowährungen, Aktien und Indizes und gibt Händlern alle Informationen und Tools, die sie benötigen, um profitabel zu bleiben. Wir bieten technische Analysen und Ha
BookMap HeatMap
Roberto Spadim
1 (2)
This Indicator creates a heatmap based on depth of market of the current symbol or another symbol. Other symbol is useful when you trade futures market and a contract has 'mini' and 'full' split. For example, in Brazil (B3 - BMF&Bovespa), WDO and DOL are future Forex contract of BRL/USD (where 1 DOL = 5 WDO) and big banks work mostly with DOL (where liquidity is important). Please use with M1 timeframe , objects are too small to be displayed at higher timeframes (MT5 limit). The number of level
CBT Quantum Maverick Hocheffizientes Binäroptionshandelssystem CBT Quantum Maverick ist ein leistungsstarkes Handelssystem für Binäroptionen, das für Händler entwickelt wurde, die Präzision, Einfachheit und diszipliniertes Handeln suchen. Keine Anpassung erforderlich – das System ist von Anfang an optimiert. Mit etwas Übung sind die Signale leicht zu beherrschen. Hauptmerkmale: Präzise Signale: Handelssignale basierend auf der aktuellen Kerze, die auf die nächste Kerze abzielen, ohne häufige N
FxaccurateLS
Shiv Raj Kumawat
WHY IS OUR FXACCCURATE LS MT5 THE PROFITABLE ? PROTECT YOUR CAPITAL WITH RISK MANAGEMENT Gives entry, stop and target levels from time to time. It finds Trading opportunities by analyzing what the price is doing during established trends. POWERFUL INDICATOR FOR A RELIABLE STRATEGIES We have made these indicators with a lot of years of hard work. It is made at a very advanced level. Established trends provide dozens of trading opportunities, but most trend indicators completely ignore them! The
TrendMaestro5
Stefano Frisetti
note: this indicator is for METATRADER4, if you want the version for METATRADER5 this is the link:  https://www.mql5.com/it/market/product/108106 TRENDMAESTRO ver 2.4 TRENDMAESTRO recognizes a new TREND in the bud, he never makes mistakes. The certainty of identifying a new TREND is priceless. DESCRIPTION TRENDMAESTRO identifies a new TREND in the bud, this indicator examines the volatility, volumes and momentum to identify the moment in which there is an explosion of one or more of these data a
Elliot Waves Analyzer Pro
Viktor Weidenthal
2.67 (3)
Elliot Waves Analyzer Pro calculates Elliot Waves to Help Identify Trend direction and Entry Levels. Mainly for Swing Trading Strategies. Usually one would open a Position in trend direction for Wave 3 or a Correction for Wave C . This Indicator draws Target Levels for the current and next wave. Most important Rules for Elliot Wave Analysis are verified by the Indicator.  The Pro version analyzes Multiple Timeframes and shows the Subwaves and Target-Levels.   For an Overview  " Elliot Waves Anal
VIP Buy Sell Signals
Hapu Arachchilage Tharindu Lakmal
Contact me through this email aaddress to download the FREE strategy PDF for this indicator tharindu999lakmal@gmail.com Introduction   The   "Buy Sell Signals"   is designed to provide BUY and SELL trade signals based on the current market conditions.   A   Trading Strategy   (Chee sheet)  has been  provided for this trading indicator.   (Read the description). This indicator has time tuned e ntry signals . so,   you will enter the market at the very best price level   with this indicator .  
VTrende Pro
Andrii Diachenko
5 (1)
VTrende Pro - MTF indicator for trend trading with a display panel for MT5 *** Videos can be translated into any language using subtitles (video language - Russian) Although the signals of the VTrende Pro indicator can be used as signals of a full-fledged trading system, it is recommended to use them in conjunction with the Bill Williams TS. VTrende Pro is an extended version of the VTrende indicator. Difference between Pro version and VTrende: - Time zones - Signal V - signal 1-2 waves -    S
IVISTscalp5
Vadym Zhukovskyi
5 (6)
Wir stellen Ihnen den iVISTscalp5-Indikator vor, der nicht nur einzigartig, sondern auch effektiv im Handel ist. Dieser Indikator basiert auf Zeitdaten und ist das Ergebnis jahrelanger Erfahrung und eingehender Analyse der Finanzmärkte. Der iVISTscalp5-Indikator ist ein ausgezeichnetes Werkzeug für manuellen Handel. Bequemlichkeit, Einfachheit und Visualisierung - die gesamte Komplexität ist verborgen. Wir haben die Einstellungen und Verwendung des iVISTscalp5-Indikators auf das Maximum vereinfa
EXCLUSIVE! JUST  10 COPIES  AVAILABLE!   BONUS AUX VIP Club 2024 : Include EA CAP, CEP, LDH, PSC307 & AO4C to enhance the performance of this tool to its maximum potential  Click Here to Download Files   ( for users only ) FREE Trading Education Available Daily via Zoom --- For More Info or Instant Message Click link ---  https://t.me/abcdwave Transform your trading with the "Five Magic Bullets" Indicator, tailored for traders who embrace the power of Elliott Wave Chaos Theory.
Weis Wave with Alert MT5
Trade The Volume Waves Single Member P.C.
4.94 (16)
Rental/Lifetime Package Options and Privileges  Rent Monthly Six Months   Yearly/Lifetime Weis Wave with Speed with Alert+Speed Index x x x Manual  x x x Quick Set up Video x x x Blog x x x Lifetime Updates x x x Setup and Training Material x x Discord Access Channel "The SI traders"          x Rectangle Break Alert Tool      x How to trade with it:    http://www.tradethevolumewaves.com   ** If you purchase please contact me to setup your  : Two hour  webinar and  training Room and  complet
Seconds Charts
Aleksandr Goryachev
Micro  ******************* Секундные графики MT5 ********************** Более точного инструмента для входа в сделку вы не найдёте. Входные параметры: Timeframe, sek - период построения графика, секунды Displayed bars - отображаемые бары Step of price levels, pp, 0-off - шаг отрисовки ценовых уровней, пункты Scale points per bar, 0-off - масштаб в пунктах на бар Show lines - отображение текущих уровней Show comment - отображение комментария Standard color scheme - стандартная цветовая сх
Natürlich, hier ist die Übersetzung in Deutsch: Vorstellung des Astronomie-Indikators für   MT4 / MT5 : Dein ultimativer himmlischer Trading-Begleiter Bist du bereit, deine Trading-Erfahrung auf himmlische Höhen zu heben? Suche nicht weiter als unseren revolutionären Astronomie-Indikator für MT4. Dieses innovative Tool übertrifft herkömmliche Trading-Indikatoren und nutzt komplexe Algorithmen, um dir unvergleichliche astronomische Einblicke und präzise Berechnungen zu bieten. Ein Universum an In
WanaScalper
Isaac Wanasolo
1 (1)
A scalping indicator based on mathematical patterns, which on average gives signals with relatively small SL, and also occasionally helps to catch big moves in the markets (more information in the video) This indicator has three main types of notifications: The first type warns of a possible/upcoming signal on the next bar The second type indicates the presence of a ready signal to enter the market/open a position The third type is for SL and TP levels - you will be notified every time price re
AriBot
Arman Belassarov
AriMax   – AI-Powered Trading Robot AriMax is a cutting-edge AI-powered trading robot designed to help traders maximize profits while minimizing risk. Utilizing advanced machine learning algorithms and real-time market analysis, AriMax identifies high-probability trade opportunities with precision and speed. Key Features:     AI-Driven Market Analysis   – Analyzes market trends and patterns to make data-driven trading decisions.     Automated Execution   – Places trades seamlessly with optimiz
Big Player Range
Thalles Nascimento De Carvalho
5 (3)
Die Macht von "BigPlayerRange" entdecken: Ihr starker Verbündeter in der technischen Marktanalyse BigPlayerRange ist ein fortschrittliches technisches Analysetool, das dazu entwickelt wurde, institutionelle Interessensbereiche im Markt aufzudecken. Mit diesem leistungsstarken Werkzeug können Sie präzise feststellen, wo große Marktteilnehmer aktiv sind, und Ihre Handelsstrategien entsprechend verbessern. Hauptmerkmale: Kartierung institutioneller Interessensbereiche : BigPlayerRange hebt Z
All in One package includes the  Oscillator Predictor ,  MACD Predictor ,  Thrust Scanner  and  Advanced Fibonacci  indicators which are mandatory for applying  Dinapoli  trade plans.  Please visit below links for detailed explanations of indicators. Advanced Fibonacci Indicator =>  https://www.mql5.com/en/market/product/107933 Thrust Scanner Indicator =>  https://www.mql5.com/en/market/product/52829 Overbought /Oversold Predictor indicator => https://www.mql5.com/en/market/product/52628 Macd
Introduction to X3 Chart Pattern Scanner X3 Cherart Pattern Scanner is the non-repainting and non-lagging indicator detecting X3 chart patterns including Harmonic pattern, Elliott Wave pattern, X3 patterns, and Japanese Candlestick patterns. Historical patterns match with signal patterns. Hence, you can readily develop the solid trading strategy in your chart. More importantly, this superb pattern scanner can detect the optimal pattern of its kind. In addition, you can switch on and off individu
SMCpro
Arief
5 (2)
Indicator USER MANUAL, trade setups, solving issues, etc :  Direct Download Here     ( for users only ) Hello World! Introducing.. SMCpro tool and Indicator for  MetaTrader 5 , a cutting-edge feature designed to revolutionize your trading experience. With innovative ICT Smart Money Concept, you gain unparalleled insight into market dynamics, empowering you to make informed trading decisions like never before. SMC Indicator built on the foundation of advanced algorithms and real-time dat
The indicator is designed to close positions on the market in time. For example: to take profits ahead of schedule if the price has not reached TakeProfit, and the market is turning around. The indicator analyzes the momentum, not the trend. He does not give any information about the trend. The indicator is well suited for finding divergence. The Ershov 38 Parrots indicator dynamically adjusts to the market and detects price movement impulses of medium and high amplitude. It almost does not rea
SYSTEM INTRODUCTION:   The Binary Options Conqueror System Is Specifically Designed For Binary Options Trading. Unlike Other Systems And Indicators That Were Adopted From Other Trading Environments For Binary Options. Little Wonder Why Many Of Such Systems Fail To Make Money . Many End Up Loosing Money For Their Users.     Forward Testing Of The System Has Shown Remarkable Results . The Results Of Forward Testing On Live Trading Account Is Consistent With The Results Obtained By Back Testing .
Der Precision Index Oscillator (Pi-Osc) von Roger Medcalf von Precision Trading Systems Version 2 wurde sorgfältig neu codiert, um extrem schnell auf Ihrem Chart geladen zu werden, und es wurden einige andere technische Verbesserungen eingearbeitet, um die Erfahrung zu verbessern. Pi-Osc wurde entwickelt, um genaue Handelstimingsignale bereitzustellen, die darauf abzielen, extreme Erschöpfungspunkte zu finden, an die die Märkte gezwungen werden, um einfach die Stops aller herauszunehmen. Die
The   Gann Scalping Gold Indicator   is a robust technical analysis tool designed for precision trading in gold markets. It leverages Gann-based methodologies to identify key price levels, enabling traders to anticipate potential market reversals, breakouts, and areas of consolidation. Daily Reset Logic: Automatically resets touch statuses at the start of a new trading day, ensuring that the indicator aligns with fresh daily trends. How It Works: The indicator draws horizontal lines at predefine
This is an indicator that includes the best basic forex indicators, without redrawing. Based on this data, a sell or buy signal is generated. It does not disappear anywhere after the signal, which gives us the opportunity to see the results on the history. It can be used on any currency pair, crypto, metals, stocks It is best used on an hourly chart, but other periods are also acceptable. The best results for the period H1,H4,daily If customers have any questions, I will answer them and aft
Scalping Fast2
Ywsf Hsyn Hmad Alrsh
Dieser Koeffizient wird im 5-Minuten-5M-Frame gehandelt Bitte beachten Sie die Erläuterungen in den beigefügten Bildern Der Handel erfolgt nach dem Trend. Wenn der Trend steigt, kaufen wir nur, wenn er die rote Linie berührt Wenn der Trend rückläufig ist, verkaufen wir nur, wenn er die blaue Linie berührt Im Falle eines Seitwärtstrends können wir verkaufen, wenn er die blaue Linie berührt, und kaufen, wenn er die rote Linie berührt Wenn der Preis die rote Kauflinie oder die Verkaufslinie von
GannTools
issam rahhal sabour
GannTools Indicator The GannTools Indicator is a powerful trading tool inspired by W.D. Gann's strategies. This indicator provides traders with dynamic support and resistance levels, trend analysis, and key price patterns using Gann angles and cycles. Key Features: Customizable Gann Fans, Angles, and Cycles for precise market analysis. Automatic identification of key price levels and trend directions. Works on all timeframes and instruments for flexible trading strategies. Integrated visualiza
How to use Pair Trading Station Pair Trading Station is recommended for H1 time frame and you can use it for any currency pairs. To generate buy and sell signal, follow few steps below to apply Pair Trading Station to your MetaTrader terminal. When you load Pair Trading Station on your chart, Pair Trading station will assess available historical data in your MetaTrader platforms for each currency pair. On your chart, the amount of historical data available will be displayed for each currency pai
XCalper TFO
Aecio de Feo Flora Neto
This oscillator was developed exclusively by xCalper in 2015 based on moving averages calculations to indicate and try predicting oversold and overbought levels. The fast line (white, by default) oscillates basically between values -0.5 (oversold) and +0.5 (overbought). Whenever this line crosses upward value -0.5, it means an oversold price level. When it crosses downward value +0.5, it means an overbought price level. When fast line crosses value 0.0 and returns, it is a strong pull-back indic
Smooth price for Monarch
Konstantin Gruzdev
5 (1)
The Smooth Price technical indicator is used for plotting a smoothed line as close to the price of the financial instrument as possible, and serves to eliminate its noise components. The indicator is part of the Monarch trading system, but here it is presented as an independent technical analysis tool. The indicator is based on the cluster digital filter , which, unlike the ClusterSMA , is applied directly to the price time series. Smooth Price does not redraw (except the very last, zero bar) an
The Expert Advisor and the video are attached in the Discussion tab . The robot applies only one order and strictly follows the signals to evaluate the indicator efficiency. Pan PrizMA CD Phase is an option based on the Pan PrizMA indicator. Details (in Russian). Averaging by a quadric-quartic polynomial increases the smoothness of lines, adds momentum and rhythm. Extrapolation by the sinusoid function near a constant allows adjusting the delay or lead of signals. The value of the phase - wave s
Weitere Produkte dieses Autors
Wie oft haben Sie schon nach einem PIVOT gesucht, der jeden Tag zu einer bestimmten Kerze funktioniert? Viele Händler schätzen gerne die Richtung des Tagestrends zu einem bestimmten Zeitpunkt am Tag ein, z. B. 30 Minuten nach Markteröffnung oder um 12 Uhr mittags und so weiter. Mit diesem Indikator können Sie einen bestimmten Zeitpunkt (Stunde und Minute) festlegen und einen Pivot von diesem Zeitpunkt bis zum nächsten Tag zur gleichen Zeit einzeichnen. Er zeigt fünf Linien an, die auf dieser
FREE
Keltner-Enhanced verbessert die Genauigkeit und Lesbarkeit von Keltner-Kanälen mit vielen Optionen für deren Anpassung und fünf weiteren Preisberechnungen über die META-Standardwerte hinaus. Der Keltner-E-Indikator ist ein bandförmiger Indikator, ähnlich wie Bollinger Bänder und Moving Average Envelopes. Er besteht aus einer oberen Hüllkurve oberhalb einer Mittellinie und einer unteren Hüllkurve unterhalb der Mittellinie.  Die wichtigsten Ereignisse, auf die man bei der Verwendung von Keltner
FREE
Der Jurik Advanced MA (JurMA) ist ein nicht nachgebildeter technischer Indikator, der auf der Grundlage des von Mark Jurik konzipierten JMA entwickelt wurde.  Er wurde entwickelt, um die Verzögerung traditioneller gleitender Durchschnitte zu verringern, die Glätte zu verbessern und das Rauschen zu reduzieren. JurMA passt sich der Marktvolatilität an und kann vom Benutzer fein abgestimmt werden, was ihn für die Erkennung von Trends und Umkehrungen auf den Finanzmärkten nützlich macht. Diese Anp
Trend On Close
David Ben Svaiter
TrendOnClose ist ein hochentwickelter Indikator, der für Anleger im Binärmarkt entwickelt wurde und sich auf die statistische Analyse von Trends und Gegentrends innerhalb bestimmter Kerzenzyklen konzentriert. Jeder Zyklus wird durch den CLOSE-Kurs der Kerze definiert, der die Trendrichtung (UP/DOWN - BULL/BEAR) für die anschließende statistische Analyse bis zum Beginn des nächsten Zyklus festlegt. Die statistische Analyse arbeitet mit zwei Konfigurationen: ⦁ Statistisches Ziel als SUBSEQUENT CA
HAshi-E ist eine verbesserte Methode zur Analyse von Heiken-Ashi-Signalen. Unterrichtung: Heiken-Ashi wird besonders für seine Fähigkeit geschätzt, kurzfristige Volatilität herauszufiltern, was es zu einem bevorzugten Instrument für die Identifizierung und Verfolgung von Trends macht. Es hilft bei der Entscheidungsfindung in Bezug auf Einstiegs- und Ausstiegspunkte und unterstützt bei der Unterscheidung zwischen falschen Signalen und echten Trendumkehrungen. Im Gegensatz zu traditionellen Can
Der ADXW wurde von Welles Wilder für tägliche Rohstoff-Charts entwickelt und wird heute in verschiedenen Märkten von technischen Händlern verwendet, um die Stärke eines Trends oder sogar eines Trends für kurz- oder langfristige Trades zu bewerten. Der ADXW verwendet zusätzlich zu seiner Trendlinie (ADX) einen positiven (DI+) und einen negativen (DI-) Richtungsindikator. Laut Wilder hat ein Trend Stärke, wenn das ADX-Signal über 25 liegt; Der Trend ist schwach (oder der Preis hat keinen Trend)
Das On-Balance-Volumen (OBV) ist ein technischer Indikator, der Volumen und Preis miteinander in Beziehung setzt, um Preisbewegungen zu erkennen. Die Grundidee hinter dem OBV ist, dass Volumenänderungen im Allgemeinen Preisänderungen vorausgehen. Der Indikator akkumuliert das Volumen für Zeiträume, in denen der Kurs höher schließt, und zieht das Volumen für Zeiträume ab, in denen der Kurs niedriger schließt. Daraus ergibt sich ein Wert, mit dem sich die Trendrichtung des Vermögenswerts ermittel
Slow AMA
David Ben Svaiter
Compared to simple or exponential moving averages, slow adaptive trend lines might offer a more nuanced view of the trend by adjusting their sensitivity based on market conditions. However, their slow nature might also mean they are late in signaling reversals when market conditions change rapidly - and that is the difference between them and our SlowAMA . SlowAMA was designed to be a better long-term trend indicator than EMA and other Moving Averages. It uses our JurMA calculations, reducing
HAshi-E ist eine verbesserte Methode zur Analyse von Heiken-Ashi-Signalen. Unterrichtung: Heiken-Ashi wird besonders für seine Fähigkeit geschätzt, kurzfristige Volatilität herauszufiltern, was es zu einem bevorzugten Instrument für die Identifizierung und Verfolgung von Trends macht. Es hilft bei der Entscheidungsfindung in Bezug auf Einstiegs- und Ausstiegspunkte und unterstützt bei der Unterscheidung zwischen falschen Signalen und echten Trendumkehrungen. Im Gegensatz zu traditionellen Can
Wie oft haben Sie schon nach einem PIVOT gesucht, der jeden Tag in einem bestimmten Zeitrahmen funktioniert? Viele Händler möchten jeden Tag die Richtung des Tagestrends auf der Grundlage eines bestimmten Zeitintervalls einschätzen, z. B. von 2 Stunden vor der NYSE-Eröffnung bis 1 Stunde danach oder von der NYSE-Eröffnung bis 30 Minuten danach. Mit diesem Indikator können Sie ein bestimmtes Zeitintervall (Stunde und Minute) festlegen und einen Pivot von diesem Intervall bis zum nächsten Tag i
VIDYA Enhanced
David Ben Svaiter
Der Indikator VIDYA-ENHANCED (Variable Index Dynamic Average) ist ein technisches Analyseinstrument zur Erkennung von Trends und Seitwärtsbewegungen. Er passt seine Empfindlichkeit dynamisch an die Marktvolatilität an und verwendet den Chande Momentum Oscillator als Volatilitätsindex. Diese Funktion ermöglicht es VIDYA-ENHANCED, in Zeiten starker Kursbewegungen agiler zu sein und in weniger volatilen Phasen stabiler zu bleiben.  Merkmale: - Wählen Sie den Preis aus 12 Optionen - 5 mehr als i
Auswahl:
Keine Bewertungen
Antwort auf eine Rezension