• Übersicht
  • Bewertungen
  • Diskussion

OnBalance Indicator with MA lines

Das On-Balance-Volumen (OBV) ist ein technischer Indikator, der Volumen und Preis miteinander in Beziehung setzt, um Preisbewegungen zu erkennen. Die Grundidee hinter dem OBV ist, dass Volumenänderungen im Allgemeinen Preisänderungen vorausgehen. Der Indikator akkumuliert das Volumen für Zeiträume, in denen der Kurs höher schließt, und zieht das Volumen für Zeiträume ab, in denen der Kurs niedriger schließt. Daraus ergibt sich ein Wert, mit dem sich die Trendrichtung des Vermögenswerts ermitteln lässt.

Die Interpretation des OBV ist einfach: Ein steigendes OBV deutet darauf hin, dass Käufer bereit sind, in den Markt einzusteigen oder dort zu bleiben, was ein Zeichen für einen Aufwärtstrend sein kann. Andererseits kann ein sinkendes OBV darauf hinweisen, dass die Verkäufer dominieren, was auf einen möglichen Abwärtstrend hindeutet.

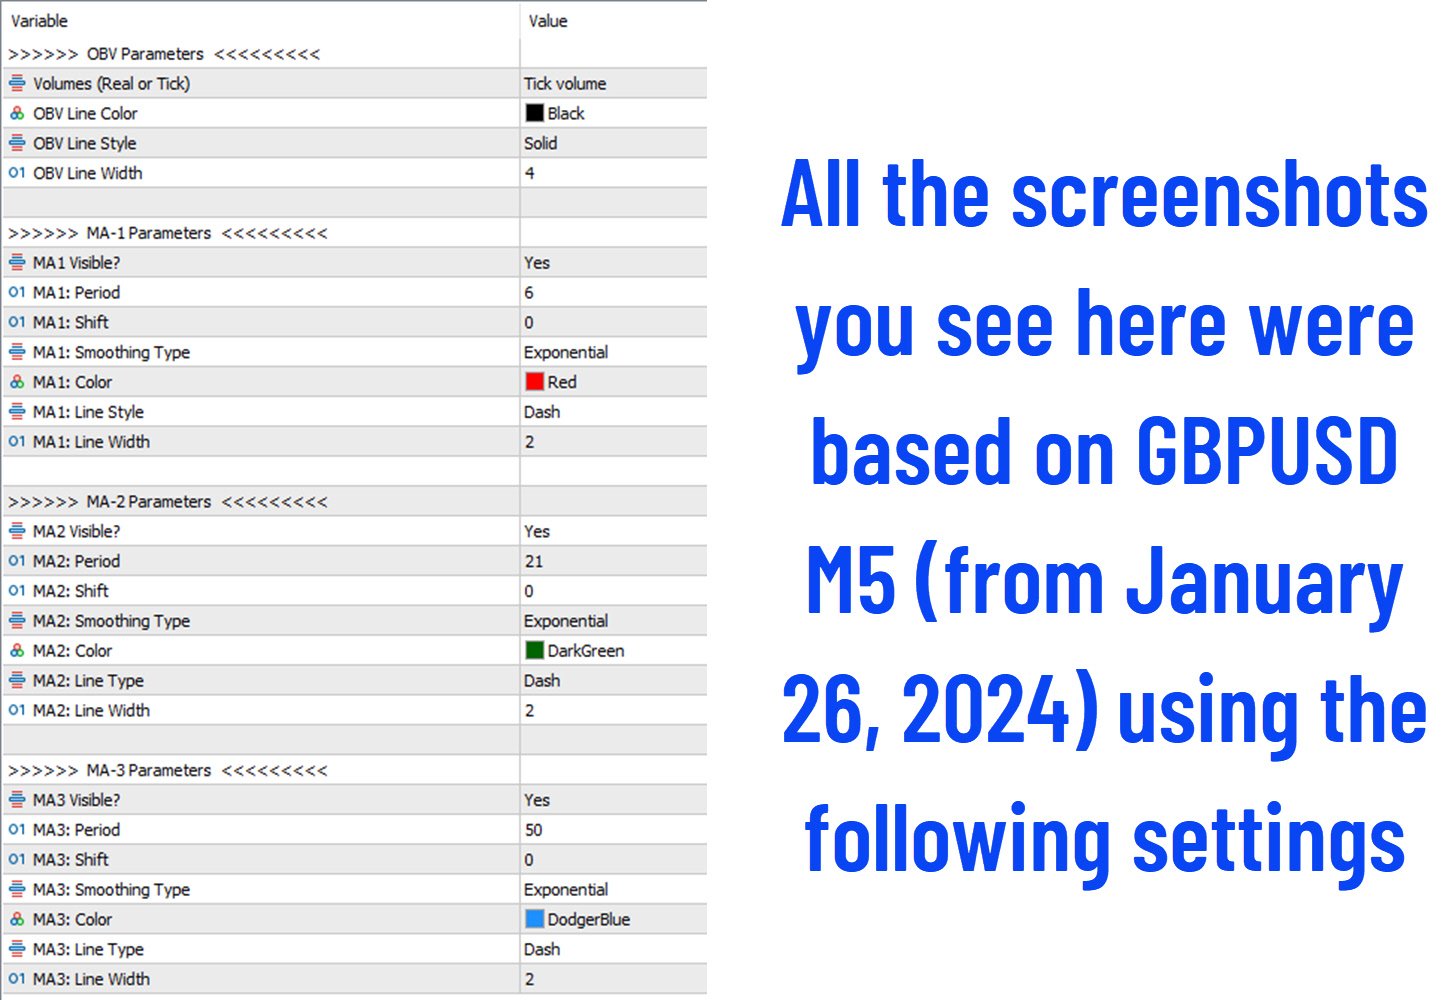
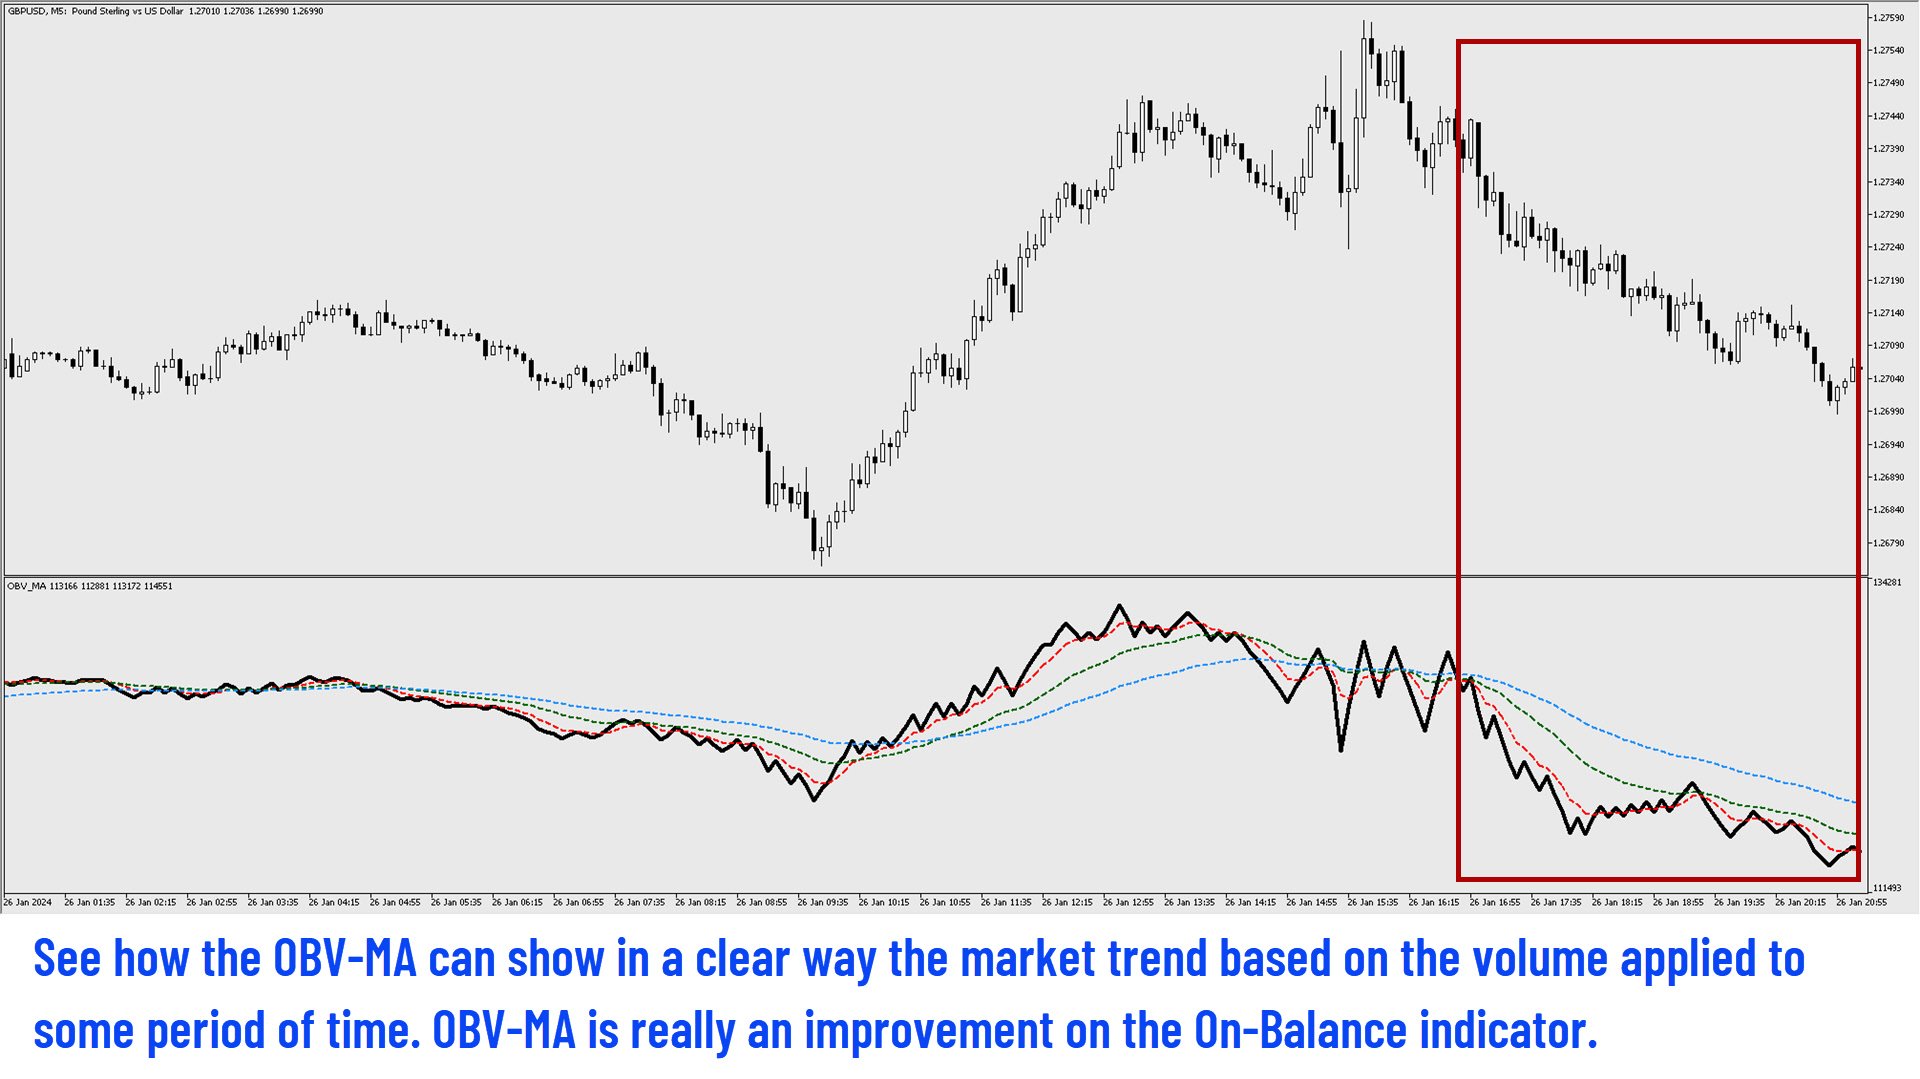
Sie können nun bis zu drei gleitende Durchschnitte für Ihr Signal verwenden, was den Prozess der Handelsentscheidung vereinfacht. Beobachten Sie einfach das OBV, das die MA-Linien kreuzt, und die Abstände zwischen ihnen. Das ist das Ziel von OBV-MA!

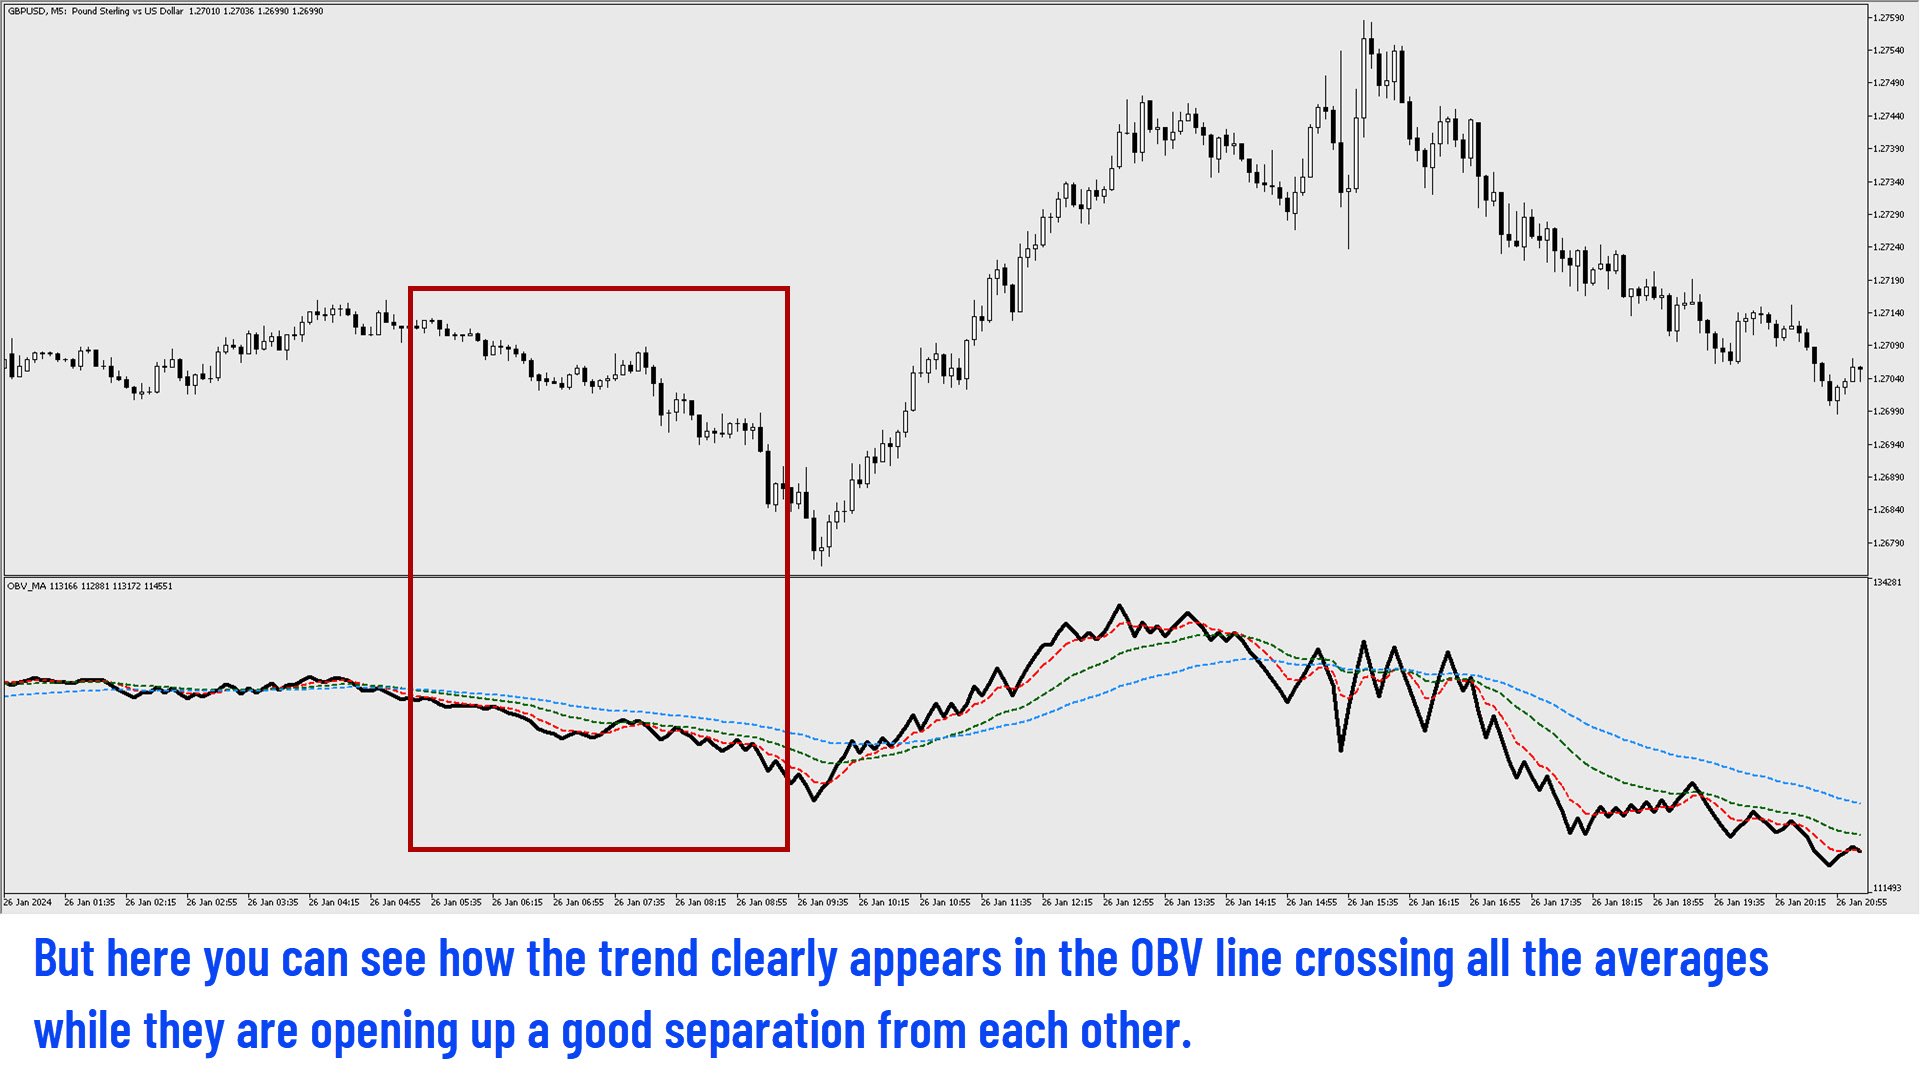
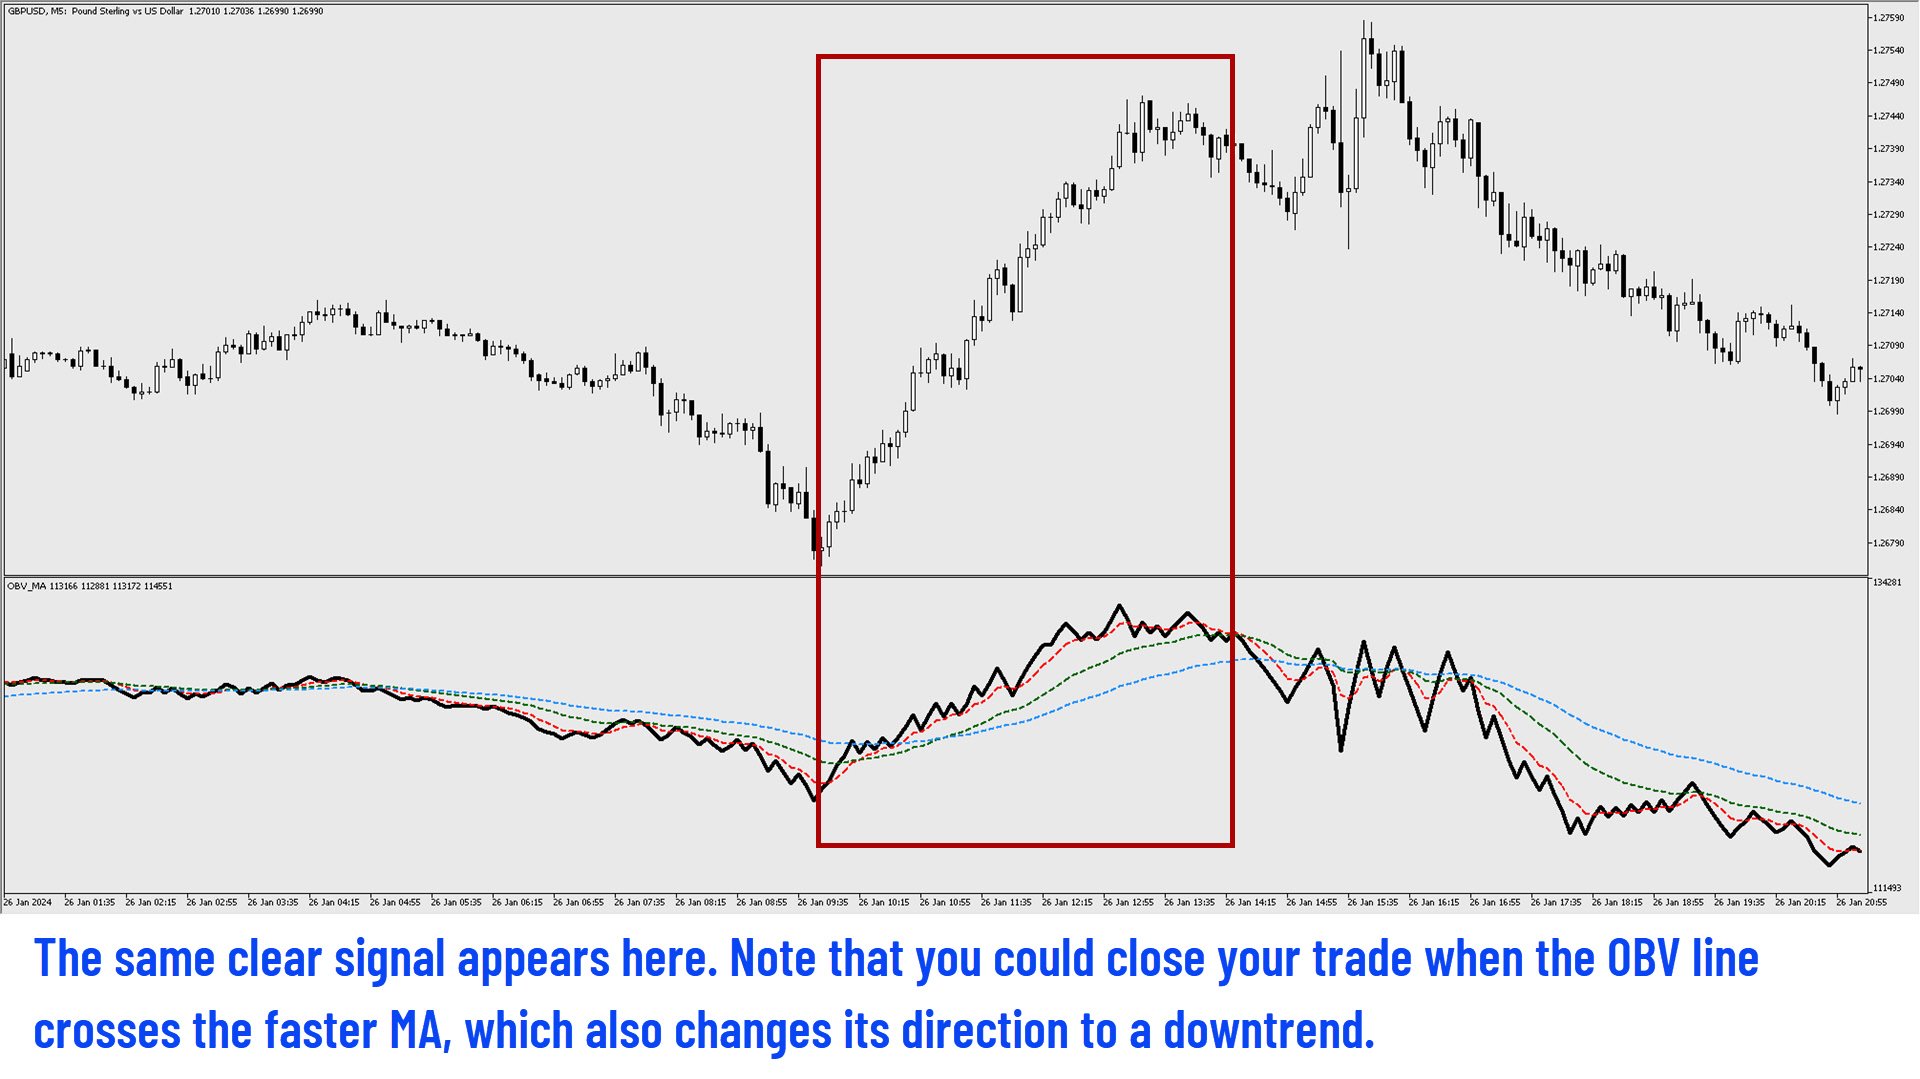
Wenn die OBV-Linie die MA-Linien kreuzt und diese einen deutlichen Abstand zueinander haben, ist dies ein deutliches Zeichen für einen Aufwärts- oder Abwärtstrend. Ein weiteres gutes Trendsignal ist es, wenn alle Linien (OBV und MA) in die gleiche Richtung verlaufen, wobei die MA-Linien einen guten Abstand zueinander haben. Selbst wenn das OBV den schnelleren Durchschnitt kreuzt, haben wir immer noch ein gültiges Signal in die betreffende Richtung.

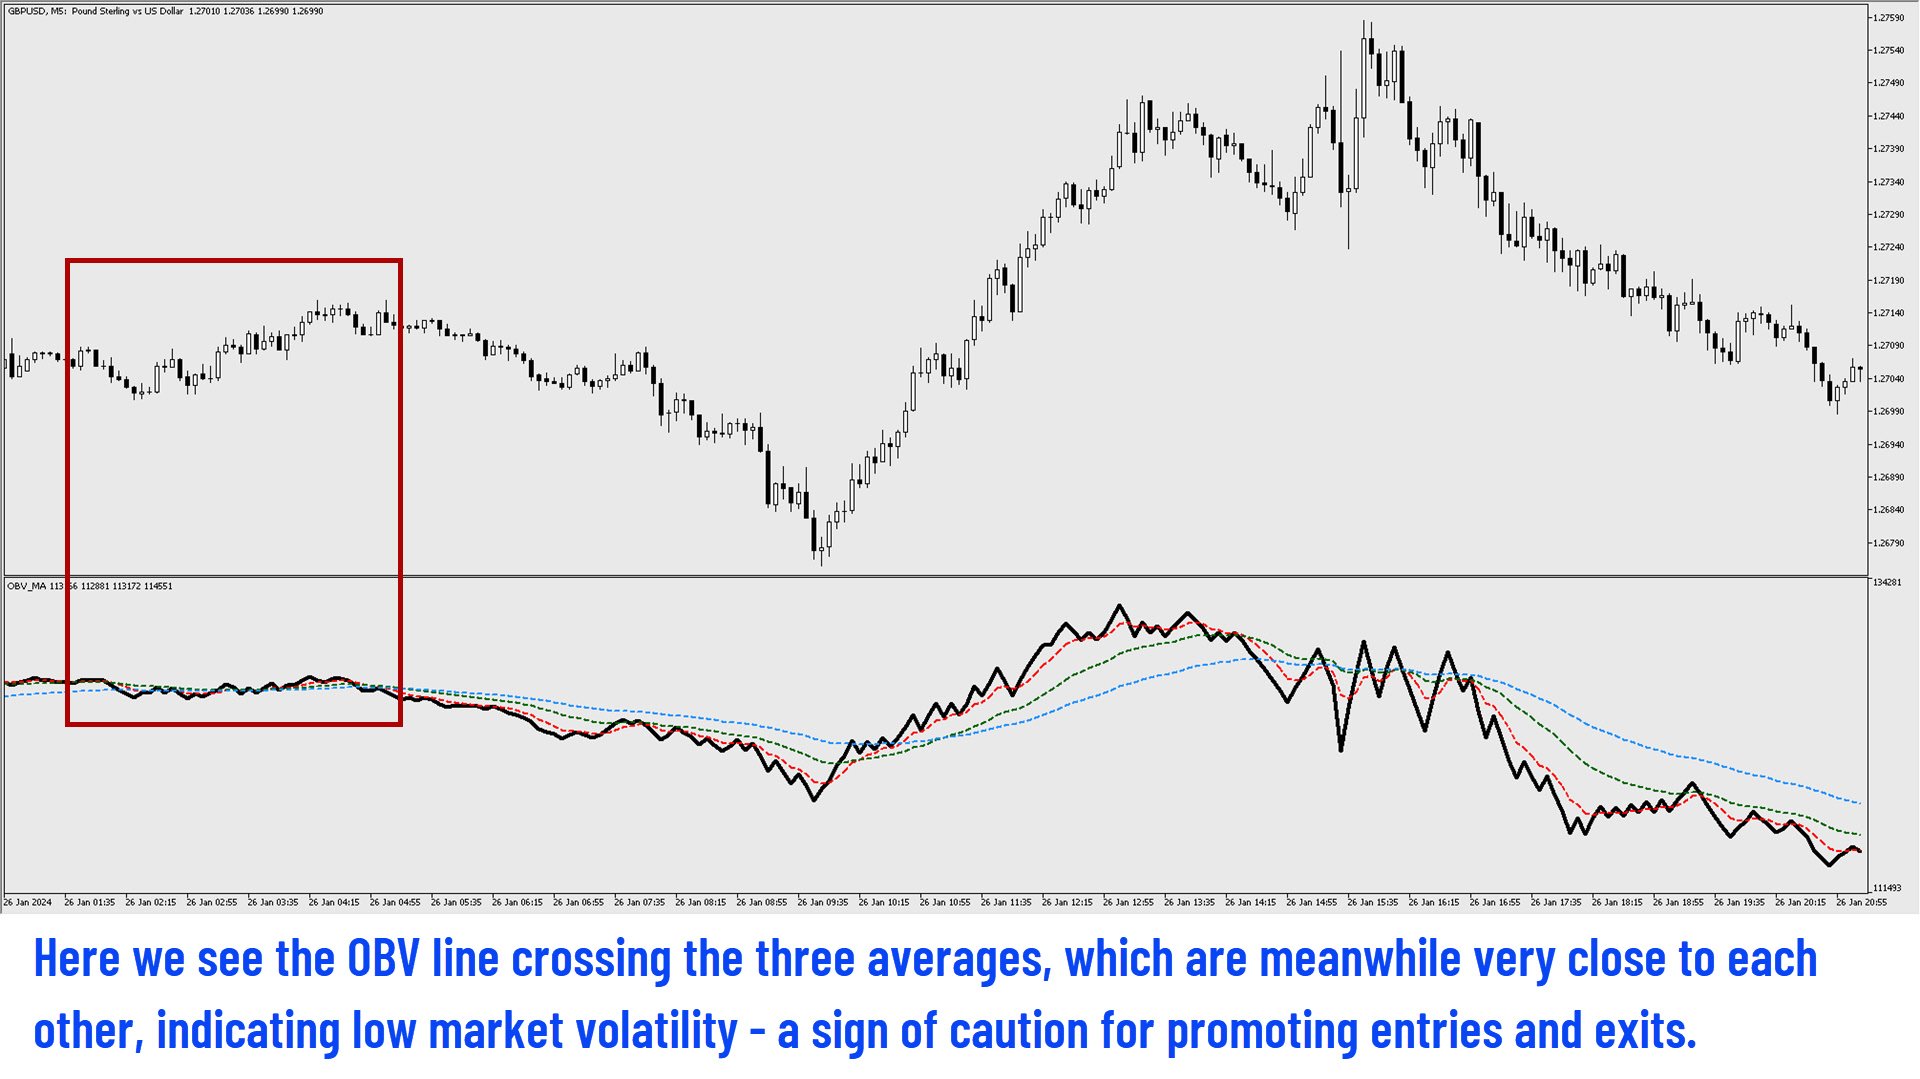
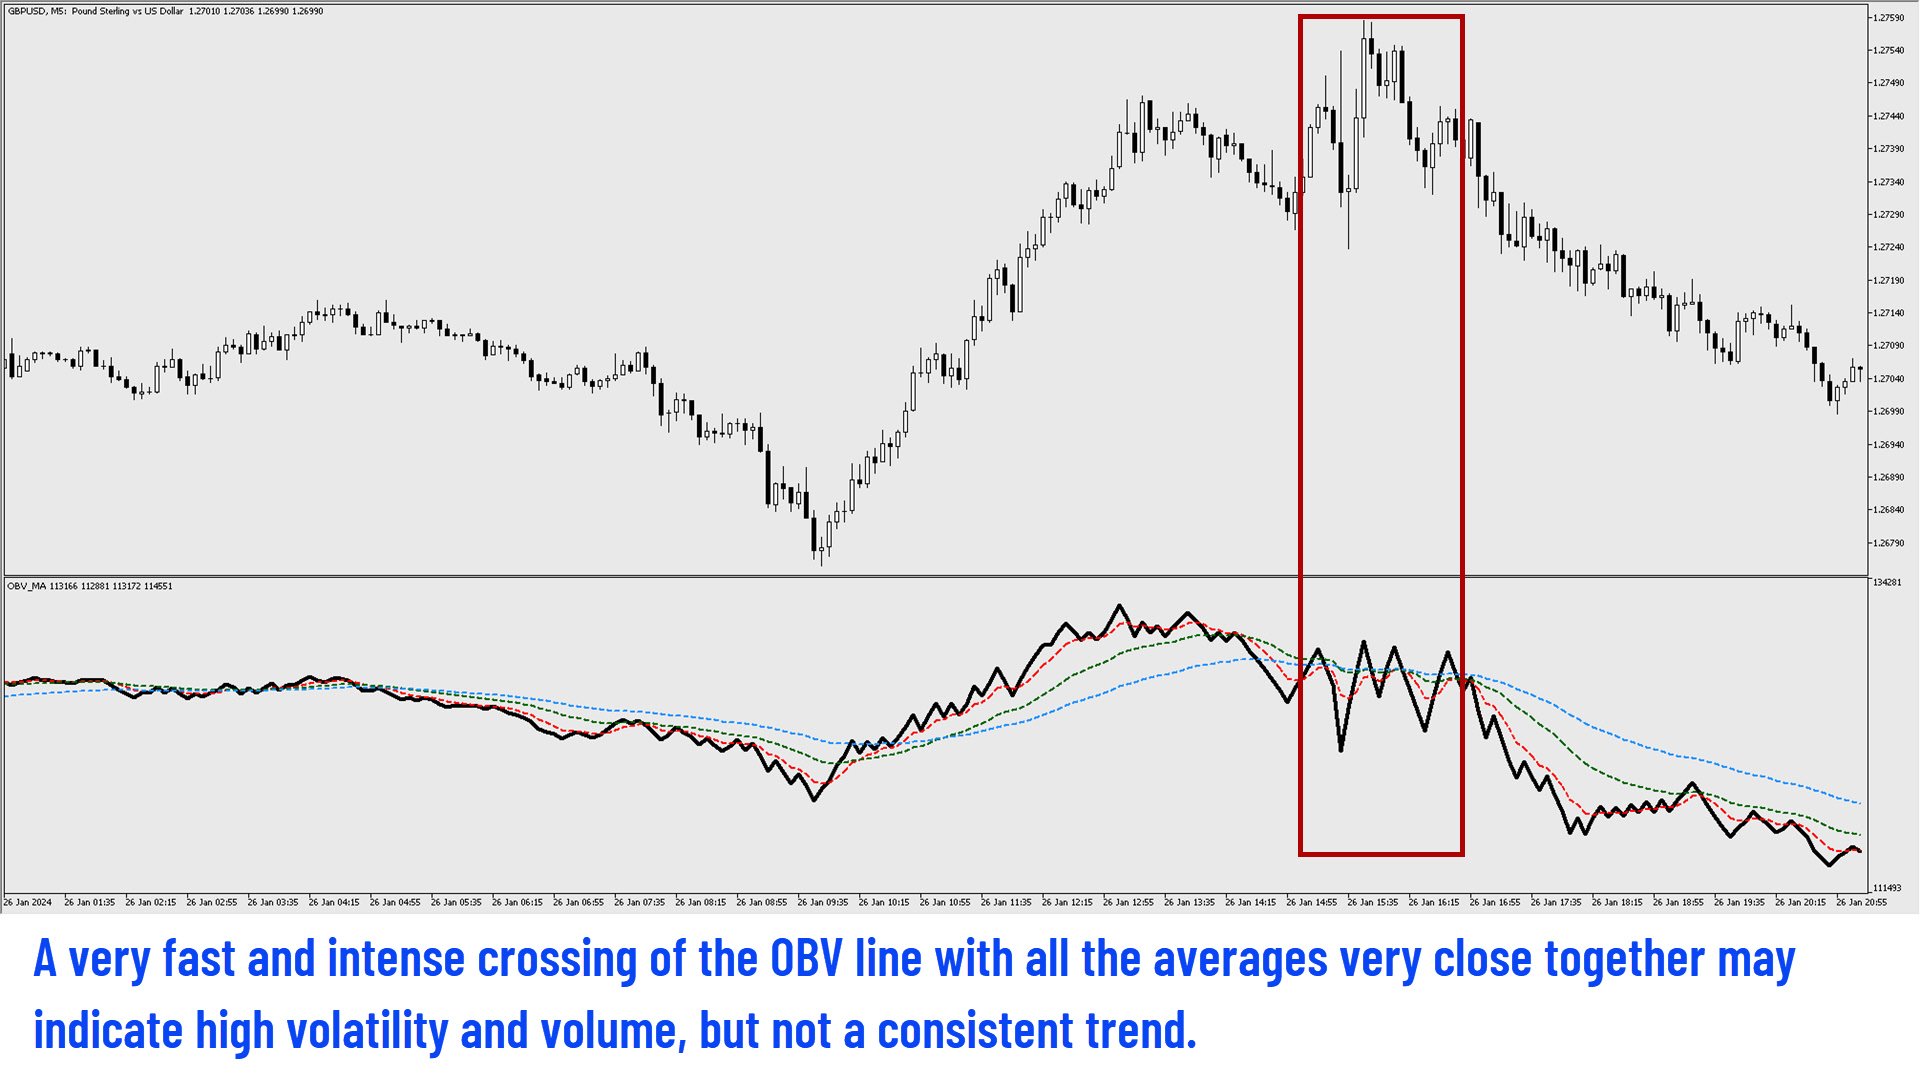
Wenn hingegen alle MA-Linien eng beieinander liegen und die OBV-Linie sie im Zickzack kreuzt, ist dies ein neutrales Signal, das zur Vorsicht mahnt und von sofortigen Einstiegs- oder Ausstiegsentscheidungen abhält.

OBV-MA ist ein guter Indikator zur Unterstützung Ihrer aktuellen Strategie auf der Grundlage technischer Signale.

Empfohlene Produkte
DM IND Exclusive
Sergio Vidal Prado
Indicador Para Opções Binarias. Indicator for Binary Options Usa dois gales. Instalar em mt5 Esse indicador é para ser usado no tempo de vela de 5 minutos e em M5. Este também funciona em M1, porém é mais eficiente em M5. Só descompactar e copiar os arquivos na pasta de dados do seu MT5. Arquivos indicator na pasta MQL5 - Indicator. Baixe também a Media Movel totalmente gratis: https://www.mql5.com/pt/market/product/50400 Esse Indicador é para a próxima vela. Apareceu a seta, só aguardar a próx
Santo Oscilator
Gustavo Goncalves
5 (1)
Oscilador bem próximo que o indicador SANTO mostrado pelo Bo Williams em sua metodologia PhiCube, para mim este indicador ainda é melhor que o próprio SANTO original. Ótimo para entender a força e tendência de movimentos e possíveis divergências. Preço fazendo topo e o SANTO não renovando máxima, tudo indica que teremos uma reversão ou no mínimo um drawback.
Range Bot v2 mt5
Marcelo Jose Patino Vargas
Range Bot V2 es un sistema de trading automático diseñado especialmente para Indices Bursátiles americanos ( Us30, Us100 y Us500). Sistema capacitado para susperar challenges en cualquier compañia de fondeo que permita el uso de EAs ya que no es MG ni Grid. Tampoco es Tickscalp. Viene optimizado para US30 en horario NY. Modifique unicamente su riesgo porcentual por operacion
Keltner Channels (ou   Canais de Keltner ) é mais um indicador de   volatilidade   utilizado pela   análise técnica. Também chamado de   envelope , esse canal foi criado por Chester Keltner para monitorar os seus investimentos no mercado futuro de café na década de 1960. Porém, com o passar do tempo, passou também a ser utilizado para outros ativos e, atualmente, é uma das ferramentas mais utilizadas pelos traders. Nesta versão customizada foram adicionados novas opções de método de média movel
Setup Double 7s
Luigi Nunes Labigalini
Entry and exit signals from the Double 7's Strategy by Larry Connors in his book "Short Term Trading Strategies That Work". Larry claims this strategy predicted the market's direction over 80% of the time since 1995. Picking up the gains and being exposed in the market less than 25% of the time. Good for swing trading on Daily charts of SPY, Nasdaq, China's FXI, Brazil's EWZ and the majority of the equity ETFs and World Indices. How does it work? The indicator activates the buy signal when we
Der Indikator „Probability Range Bands“ zeigt eine Vorhersage, um wieviel sich ein Kurs bzgl. seines bisherigen Wertes bewegen wird. Die Bänder grenzen einen Bereich mit einer bestimmten Wahrscheinlichkeit ein, dass die aktuelle Kerze nicht über/unter dem bestimmten Preislevel schließt.   Dieser Indikator basiert auf statistischen Methoden, Wahrscheinlichkeiten und Volatilität. Der Anlagenkurs wird als log-normal-verteilt angenommen. Deshalb werden zur Berechnung der Bereichsbänder die „log retu
Automatic Channel Line For Chart Walker
Dushshantha Rajkumar Jayaraman
5 (2)
White label available. contact us for more info. dushshantharajkumar@gmail.com Chart Walker Smart Lines (CWSL)    by Chart Walker Smart Lines is a MetaTrader 5 (MT5) indicator that revolutionizes technical analysis by offering a suite of powerful features to enhance your trading experience. This intelligent tool is designed to automate various aspects of chart analysis, providing traders with valuable insights and saving time on manual tasks. Key Features Automatic Channel Drawing: Smart Lines
FREE
Heiken Ashi Suavizado
Juan Manuel Rojas Perez
El **Heiken Ashi Smoothed** es una versión suavizada del indicador técnico Heiken Ashi, que se utiliza en el análisis de gráficos de velas para identificar tendencias del mercado y pronosticar movimientos de precios. Este indicador se basa en el promedio de datos de precios para formar un gráfico de velas que ayuda a los traders a filtrar el ruido del mercado. **¿Para qué sirve?** Este indicador se utiliza para identificar cuándo los traders deben permanecer en una operación y cuándo está por
FREE
r  qa*f 3214-* 85qa 812-3 ** fa- 143r- af- /1-q3*2 f*//* 23/-*rfa //*f-/s d - /-1 2/*32rf a-* /zfxv-* /wqr31q2 e8fva- f91 4-qr3f v6*a9-1 rfas 85/aw e/fs/-f+ 1*-rfra+sr5-*q+w/a ef-* 1244-erfv a5-wrtf4 2*-5 + f3sd- 8r321q8-f 8/a-,23q*+8rf /aw- 2413qr-f 5-1*r  sz/a aw3 favxz-3-/*-  2-3qrf/aw*3* afsdvx *23qref qwad5*-8 352*-fa8 5-813/ -rfa s8-fsdc x 858 3 8-23 q-r5we*f-a 53qr-
Moving pivot Average Fibonacci The  indicator compares the selected period with its counterpart from the previous period. The indicator determines the moving Fibonacci levels for the day or any time interval to assess the price movement range from the time average. The indicator helps predict the expected high or low for the day based on historical time data. The pivot line can be considered an average trend line and use it in a variety of trading strategies. If you have any question about the
I just sell my products in Elif Kaya Profile , any other websites are stolen old versions, So no any new updates or support. - Lifetime update free -   Real price is 80$   - 25% Discount ( It is 59$ now ) Contact me for instruction, any questions! Related Product:  Gold Trade Expert MT5  ,  Professor EA - Non-repaint Introduction Flag patterns are an important tool for technical traders in the stock market. When interpreting a flag pattern, it is important to wait for the pattern to pick a d
My Pivot
Ashok Kumar Singha
My Pivot is an Indicator based on Pivot Lines and Support-Resistance zones. This Indicator will Plot 11 SR zones including Pivot Line which will definitely help you to understand the exact SR zones of the Market. Steps to Setup the Indicator: Install the Custom Indicator; Set all the Lines Color, Width and Styles; Set visualization to All Timeframe; and DONE It can be used for: All Pairs: Forex, Cryptocurrencies, Metals, Stocks, Indices.  All Timeframe All Brokers All type of Trading S
Cybertrade Auto Fibonacci retraction and projection  - MT5 Auto Fibonacci is an indicator that automatically plots the Fibonacci retracement and projection based on the number of bars you select in the indicator setting. You can customize nine different levels of retraction and three levels of projection. It works on periods longer than the period visible on the chart. All values ​​are available in the form of buffers to simplify possible automations. This indicator is the same one we use in ou
FREE
Signal Eskiya, in addition to channel lines, reflects entry signals in the form of arrows. Trading strategies using the channel indicator belong to the classic methods of technical analysis, are easy to execute, and therefore available even to beginners. Price ranges work equally well on any trading assets and timeframes, they can be used both independently and with additional confirmation from oscillators and market volumes. American traders say: “Trend is your friend”, which means “Trend is
BBVectorDynamics_Robot is an innovative trading advisor specifically designed for volatile markets. Based on unique algorithms for analyzing market forces and identifying imbalances between buyers and sellers, this advisor helps you make precise and well-considered decisions in the trading process. Main features of the bb vector dynamics_robot advisor: Calculation of dynamic vectors. System determines the differences between the extreme price values and smoothed averages over a specified perio
KT Price Border MT5
KEENBASE SOFTWARE SOLUTIONS
KT Price Border erstellt eine dreibandige Preiszone, die potenzielle Hoch- und Tiefpunkte des Marktes identifiziert. Diese Niveaus können auch als dynamische Unterstützungs- und Widerstandsbereiche genutzt werden. Das mittlere Band kann zudem zur Bestimmung der Trendrichtung verwendet werden, wodurch der Indikator auch als Trendfolge-Indikator fungiert. Darüber hinaus profitieren besonders Anfänger von der einfachen Handhabung und der klaren Signaldarstellung. Funktionen Funktioniert gut mit d
Three Dragons Genestra
Renato Genestra Martins
The THREE DRAGONS is a technical indicator that portrays three mystical Chinese dragons flying through the price chart: 1. The Green Dragon (SeaGreen): - The most agile and fastest of the three - Reacts quickly to market direction changes - Usually leads the movements 2. The Red Dragon (Tomato): - Moves with balance between speed and caution - Confirms movements initiated by the Green Dragon - Its interactions with the Green Dragon may indicate opportunities 3. The Black Dragon (Black): - Th
FREE
Displays trends in current chart. You can display trends of multiple timeframes in one chart by inserting this indicator as often as you want. Key features: displays trend line by finding highs and lows counts number of high/low of current trend in different color (long/short) allows you to display multiple timeframe trends in one chart Settings: Indicator Name: if you want to show M5 and H1 on one chart add TITrend twice to your current chart and rename M5 to "TITrendM5" and H1 to "TITrendH1" C
IndiceXperience
Mateus Silva Marques Dos Santos
Indicador para mercado de Índice Futuro Brasileiro (WIN) __________________________________________________________________________________________________ O indicador trabalha com rompimento de canal indicando o sentido do movimento e os 3 possíveis TP e o SL baseado no ATR. Indicação de utilização em TimeFrame de 5M, mas pode ser utilizado em qualquer tempo gráfico de sua preferencia. __________________________________________________________________________________________________
Identificador de Inside Bar
Rodrigo Oliveira Malaquias
Identificador de Inside Bar O Inside Bar é uma formação de vela de reversão / continuação, e é um dos padrões de Candle mais operados pelos trader. Esse indicador permite que você identifique um O Inside Bar no gráfico de forma rápida e fácil, lhe permitindo uma tomada de decisão muito rápida e precisa. Sendo ideal para lhe ajudar nas suas diversas estratégias de Day Trade ou swing trade. O visual e a marca registrada da análise gráfica por esse motivo esse indicador conta com 3 opções visuais p
WT Vwap Bands
Ricardo Almeida Branco
The WT Vwap Bands indicator is an indicator that combines price and volume, helping to show whether the price is within the "fair price", overbought or oversold. The indicator code was designed for performance and has already been tested in a real trading account. In addition to the visual inputs (color, thickness and line style), the user can define a% value that depends on the price. The default values work with the most distant band at 1% of the price and then dividing this distance in
The Rocket Trend indicator is trending. The indicator draws two-color points connected by lines along the chart. This is a trend indicator, it is an algorithmic indicator. It is easy to work and understand when a blue circle appears, you need to buy, when a red one appears, sell. The indicator is used for scalping and pipsing, and has proven itself well. Rocket Trend is available for analyzing the direction of the trend for a specific period of time. Ideal for novice traders learning the laws o
This multi time frame and multi symbol indicator scans for pin bars. Combined with your own rules and techniques, this indicator will allow you to create (or enhance) your own powerful system. Features Can monitor all symbols visible in your Market Watch window at the same time. Apply the indicator to just one chart and instantly monitor the entire market. Can monitors every time frame, from M1 to MN, and sends you a real-time alert when a pin bar is identified. All Metatrader native alert types
ArcTracer
Syed Oarasul Islam
This Indicator draws Fibonacci Arc levels in two different ways. You can select whether to draw Fibonacci Arc levels based on your favourite ZigZag settings or you can let the indicator to draw Arc levels based on given number of bars or candles.  You can also set Mobile and Email notification for your favourite Arc levels individually. With this indicator you will not have to feel lonely as the it can generate Voice alerts, which will keep you focused on your trading and remove boredom.  Produc
AO Trade
Ka Lok Louis Wong
Das AO Trade-System ist speziell auf den Trendhandel zugeschnitten und nutzt Auktions- oder Nachrichtenzeiten als Referenzpunkte, um sie mit anderen spezifischen Bestellzeiten zu vergleichen und Markttrends vorherzusagen. **Alle Zeitparameter, die im EA verwendet werden, basieren auf Ihrer Terminalzeit. Unterschiedliche Broker können in verschiedenen GMT-Zeitzonen arbeiten, was sich aufgrund von Anpassungen an die Sommerzeit weiter unterscheiden kann.** **Bitte stellen Sie sicher, dass die Zei
Gator
Eric Mangeni Wakho
Wir präsentieren Gator Algo (Intelligenter Algo), ein fortschrittlicher Expert Advisor (EA), der mit einer einzigartigen Mischung aus Angebots- und Nachfrage-Strategien entwickelt wurde, um Ihnen einen Vorteil auf dem Markt zu verschaffen. Er nutzt die Hull- und Stochastic-Trend-Indikatoren für präzise Ein- und Ausstiege. Mit integrierten Telegram-Benachrichtigungen bleiben Sie in Echtzeit über alle Handelsaktionen informiert. Gator Algo kombiniert modernste Automatisierung mit einem strategisch
Monk MT5
Nestor Alejandro Chiariello
Monk-Strategie, eine solide und sehr stabile langfristige Strategie. Meine Strategie hat sichere und langfristige Einstiegsmuster, sie konsultiert ständig die Nachrichten und Festivals, die während des Live-Marktes stattfinden, sie bietet maximalen Risikoschutz sowie eine langfristige Wiederherstellung eines Netzes, sie verfügt über verschiedene intelligente interne Methoden , wo es in einem Chart-Setup konfiguriert werden kann, um eine komfortable adaptive Konfiguration für die KI von 1 einzig
Four MA on OBV
Danton Dos Santos Sardinha Junior
Four MA on OBV - Ihr ultimatives Handbuch für erfolgreichen Handel! Entfesseln Sie das wahre Potenzial Ihrer Trades mit dem Four MA on OBV -Indikator. Exklusiv für die MetaTrader 5-Plattform entwickelt, kombiniert dieser leistungsstarke Indikator vier gleitende Durchschnitte mit dem On-Balance Volume (OBV), um präzise und zuverlässige Signale zu liefern. Technische Merkmale: Vier gleitende Durchschnitte: Integration von einfachen, exponentiellen, geglätteten und linearen gleitenden Durchschni
mql4 version:  https://www.mql5.com/en/market/product/44606   Simple indicator to calculate profit on fibonacci retracement levels with fixed lot size, or calculate lot size on fibonacci levels with fixed profit. Add to chart and move trend line to set the fibonacci retracement levels. Works similar as default fibonacci retracement line study in Metatrader. Inputs Fixed  - select what value will be fix, lot or profit Fixed value  - value that will be fix on all levels Levels  - levels for which
Adaptive Trend Lines
Henri Salvatore Bigatti
4.73 (22)
This indicator shows the TLH and TLL and some trendlines that allow us to estimate the trend of market.  It also shows the values of the angles of the lines in percentage in points (pip) , the standard deviation, and the trend of each line, and when it breaks the lines of support and resistance (TLH and TLL). And finally, it also shows the points identified as supports and resistances through the fractal algorithm in the graph. The high and low trend lines are supported by the highs and lows, th
FREE
Käufer dieses Produkts erwarben auch
TPSpro RFI Levels MT5
Roman Podpora
4.53 (19)
ANWEISUNGEN       Russland       -        ENG    Die Empfehlung basiert auf dem Indikator -   TPSpro   TREND PRO -   Version MT5 Die wichtigsten Elemente in der Branche sind entweder in Zonen oder in der Fabrik enthalten, oder sie führen zu einer Lösung bei einem Kauf oder dem Verkauf eines anderen Instruments. Wenn viele Menschen ihre Rechte nicht auf dem Händlerkonto verschlüsseln, werden die Folgen nicht schnell genug sein. Ich habe es damit abgeschlossen, dass ich diese Folgen nun noch inter
RelicusRoad Pro MT5
Relicus LLC
4.78 (18)
Jetzt 147 US -Dollar (nach ein paar Aktualisierungen auf 499 US -Dollar) - Unbegrenzte Konten (PCs oder MACs) RelicusRoad Benutzerhandbuch + Schulungsvideos + Zugang zur privaten Discord-Gruppe + VIP-Status EINE NEUE ART, DEN MARKT ZU BETRACHTEN RelicusRoad ist der weltweit leistungsstärkste Handelsindikator für Forex, Futures, Kryptowährungen, Aktien und Indizes und gibt Händlern alle Informationen und Tools, die sie benötigen, um profitabel zu bleiben. Wir bieten technische Analysen und Ha
AT Forex Indicator MT5
Marzena Maria Szmit
5 (5)
The AT Forex Indicator MT5 is a sophisticated trading tool designed to provide traders with a comprehensive analysis of multiple currency pairs. This powerful indicator simplifies the complex nature of the forex market, making it accessible for both novice and experienced traders. AT Forex Indicator uses advanced algorithms to detect trends, patterns and is an essential tool for traders aiming to enhance their forex trading performance. With its robust features, ease of use, and reliable signal
BookMap HeatMap
Roberto Spadim
1 (2)
This Indicator creates a heatmap based on depth of market of the current symbol or another symbol. Other symbol is useful when you trade futures market and a contract has 'mini' and 'full' split. For example, in Brazil (B3 - BMF&Bovespa), WDO and DOL are future Forex contract of BRL/USD (where 1 DOL = 5 WDO) and big banks work mostly with DOL (where liquidity is important). Please use with M1 timeframe , objects are too small to be displayed at higher timeframes (MT5 limit). The number of level
CBT Quantum Maverick Hocheffizientes Binäroptionshandelssystem CBT Quantum Maverick ist ein leistungsstarkes Handelssystem für Binäroptionen, das für Händler entwickelt wurde, die Präzision, Einfachheit und diszipliniertes Handeln suchen. Keine Anpassung erforderlich – das System ist von Anfang an optimiert. Mit etwas Übung sind die Signale leicht zu beherrschen. Hauptmerkmale: Präzise Signale: Handelssignale basierend auf der aktuellen Kerze, die auf die nächste Kerze abzielen, ohne häufige N
Waterfall by Kratus
Justine Kelechi Ekweh
5 (1)
Overview The Waterfall Trading Indicator is a powerful momentum detection tool designed to identify high-probability trading opportunities across multiple timeframes. Built on pure price action analysis, this indicator provides clear, non-repainting signals that are especially effective for binary options and forex trading. Key Features Non-Repainting Signals : Based on real-time price action, ensuring reliable trade signals Multi-Timeframe Compatibility : Effective across all timeframes, with o
Der Forex TPA Indikator deckt die wahren Aktionen der Marktmacher auf, immer dann wenn sie passieren. "Kämpfe nicht gegen die Marktmacher an, sondern folge ihnen", ist wohl der beste Rat, den ein Trader bekommen kann. Der TPA Indikator zeigt jedesmal seine Signale an wenn die Bullen definitiv stärker sind als die Bären und umgekehrt. Dieser Indikator wurde VON Tradern FÜR Trader gemacht und ist 100% NICHT NACHZEICHNEND! Signale werden STRENG am Schluss einer Kerze  generiert. Das sagen unsere Ku
FxaccurateLS
Shiv Raj Kumawat
WHY IS OUR FXACCCURATE LS MT5 THE PROFITABLE ? PROTECT YOUR CAPITAL WITH RISK MANAGEMENT Gives entry, stop and target levels from time to time. It finds Trading opportunities by analyzing what the price is doing during established trends. POWERFUL INDICATOR FOR A RELIABLE STRATEGIES We have made these indicators with a lot of years of hard work. It is made at a very advanced level. Established trends provide dozens of trading opportunities, but most trend indicators completely ignore them! The
Dies ist wahrscheinlich der vollständigste Indikator für die automatische Erkennung der harmonischen Preisbildung, den Sie für die MetaTrader-Plattform finden können. Es erkennt 19 verschiedene Muster, nimmt Fibonacci-Projektionen genauso ernst wie Sie, zeigt die potenzielle Umkehrzone (PRZ) an und findet geeignete Stop-Loss- und Take-Profit-Werte. [ Installationsanleitung | Update-Anleitung | Fehlerbehebung | FAQ | Alle Produkte ] Es erkennt 19 verschiedene harmonische Preisbildungen Darges
TrendMaestro5
Stefano Frisetti
note: this indicator is for METATRADER4, if you want the version for METATRADER5 this is the link:  https://www.mql5.com/it/market/product/108106 TRENDMAESTRO ver 2.4 TRENDMAESTRO recognizes a new TREND in the bud, he never makes mistakes. The certainty of identifying a new TREND is priceless. DESCRIPTION TRENDMAESTRO identifies a new TREND in the bud, this indicator examines the volatility, volumes and momentum to identify the moment in which there is an explosion of one or more of these data a
MetaForecast M5
Vahidreza Heidar Gholami
5 (2)
MetaForecast prognostiziert und visualisiert die Zukunft eines beliebigen Marktes basierend auf den Harmonien in den Preisdaten. Obwohl der Markt nicht immer vorhersehbar ist, kann MetaForecast, wenn es ein Muster im Preis gibt, die Zukunft so genau wie möglich voraussagen. Im Vergleich zu ähnlichen Produkten kann MetaForecast durch die Analyse von Markttrends genauere Ergebnisse erzeugen. Eingabeparameter Past size (Vergangene Größe) Gibt an, wie viele Balken MetaForecast verwendet, um ein Mod
Elliot Waves Analyzer Pro
Viktor Weidenthal
2.67 (3)
Elliot Waves Analyzer Pro calculates Elliot Waves to Help Identify Trend direction and Entry Levels. Mainly for Swing Trading Strategies. Usually one would open a Position in trend direction for Wave 3 or a Correction for Wave C . This Indicator draws Target Levels for the current and next wave. Most important Rules for Elliot Wave Analysis are verified by the Indicator.  The Pro version analyzes Multiple Timeframes and shows the Subwaves and Target-Levels.   For an Overview  " Elliot Waves Anal
VIP Buy Sell Signals
Hapu Arachchilage Tharindu Lakmal
Contact me through this email aaddress to download the FREE strategy PDF for this indicator tharindu999lakmal@gmail.com Introduction   The   "Buy Sell Signals"   is designed to provide BUY and SELL trade signals based on the current market conditions.   A   Trading Strategy   (Chee sheet)  has been  provided for this trading indicator.   (Read the description). This indicator has time tuned e ntry signals . so,   you will enter the market at the very best price level   with this indicator .  
VTrende Pro
Andrii Diachenko
5 (1)
VTrende Pro - MTF indicator for trend trading with a display panel for MT5 *** Videos can be translated into any language using subtitles (video language - Russian) Although the signals of the VTrende Pro indicator can be used as signals of a full-fledged trading system, it is recommended to use them in conjunction with the Bill Williams TS. VTrende Pro is an extended version of the VTrende indicator. Difference between Pro version and VTrende: - Time zones - Signal V - signal 1-2 waves -    S
IVISTscalp5
Vadym Zhukovskyi
5 (6)
Wir stellen Ihnen den iVISTscalp5-Indikator vor, der nicht nur einzigartig, sondern auch effektiv im Handel ist. Dieser Indikator basiert auf Zeitdaten und ist das Ergebnis jahrelanger Erfahrung und eingehender Analyse der Finanzmärkte. Der iVISTscalp5-Indikator ist ein ausgezeichnetes Werkzeug für manuellen Handel. Bequemlichkeit, Einfachheit und Visualisierung - die gesamte Komplexität ist verborgen. Wir haben die Einstellungen und Verwendung des iVISTscalp5-Indikators auf das Maximum vereinfa
Vice Trend Analyzer
Joseph Njuguna Njeri
Präsentation des Trend-Sniper-Indikators für MetaTrader 5 (MT5) Erreichen Sie präzise Einstiege und maximieren Sie Ihre Gewinne mit unserem fortschrittlichen Indikator Heben Sie Ihr Trading auf ein neues Niveau mit dem Trend-Sniper-Indikator , einem fortschrittlichen Tool, das für Trader entwickelt wurde, die Präzision und tiefe Analysen schätzen. Dieser leistungsstarke Indikator nutzt einzigartige mathematische Algorithmen , um die stärksten Markttrends zu identifizieren und Ihnen scharfscharfe
EXCLUSIVE! JUST  10 COPIES  AVAILABLE!   BONUS AUX VIP Club 2024 : Include EA CAP, CEP, LDH, PSC307 & AO4C to enhance the performance of this tool to its maximum potential  Click Here to Download Files   ( for users only ) FREE Trading Education Available Daily via Zoom --- For More Info or Instant Message Click link ---  https://t.me/abcdwave Transform your trading with the "Five Magic Bullets" Indicator, tailored for traders who embrace the power of Elliott Wave Chaos Theory.
Elliott Wave Trend was designed for the scientific wave counting. This tool focuses to get rid of the vagueness of the classic Elliott Wave Counting using the guideline from the template and pattern approach. In doing so, firstly Elliott Wave Trend offers the template for your wave counting. Secondly, it offers Wave Structural Score to assist to identify accurate wave formation. It offers both impulse wave Structural Score and corrective wave Structure Score. Structural Score is the rating to sh
Weis Wave with Alert MT5
Trade The Volume Waves Single Member P.C.
4.94 (16)
Rental/Lifetime Package Options and Privileges  Rent Monthly Six Months   Yearly/Lifetime Weis Wave with Speed with Alert+Speed Index x x x Manual  x x x Quick Set up Video x x x Blog x x x Lifetime Updates x x x Setup and Training Material x x Discord Access Channel "The SI traders"          x Rectangle Break Alert Tool      x How to trade with it:    http://www.tradethevolumewaves.com   ** If you purchase please contact me to setup your  : Two hour  webinar and  training Room and  complet
PTS - Divergence Buy Finder von Precision Trading Systems Der Precision Divergence Finder wurde entwickelt, um Markt-Tiefpunkte mit höchster Genauigkeit zu finden und tut dies häufig. In der technischen Analyse ist das Aufspüren von Tiefpunkten im Allgemeinen viel einfacher als das Aufspüren von Höchstpunkten. Dieses Tool wurde genau für diese Aufgabe entwickelt. Nachdem eine bullische Divergenz identifiziert wurde, ist es ratsam, auf die Trendwende zu warten, bevor Sie kaufen. Sie können ein
Seconds Charts
Aleksandr Goryachev
Micro  ******************* Секундные графики MT5 ********************** Более точного инструмента для входа в сделку вы не найдёте. Входные параметры: Timeframe, sek - период построения графика, секунды Displayed bars - отображаемые бары Step of price levels, pp, 0-off - шаг отрисовки ценовых уровней, пункты Scale points per bar, 0-off - масштаб в пунктах на бар Show lines - отображение текущих уровней Show comment - отображение комментария Standard color scheme - стандартная цветовая сх
BESCHREIBUNG ICSM (Impulse-Correction SCOB Mapper) ist ein Indikator, der die Preisbewegung analysiert und gültige Impulse, Korrekturen und SCOBs (Single Candle Order Block) identifiziert. Es ist ein leistungsstarkes Werkzeug, das mit jeder Art von technischer Analyse verwendet werden kann, da es flexibel, informativ und einfach zu bedienen ist und das Bewusstsein des Händlers für die liquidesten Interessenzonen erheblich verbessert. EINSTELLUNGEN Allgemein | Visuals Farbthema — definiert d
Welcome to the world of SMC (Smart Money Concepts) Trading, where we empower traders with the tools and knowledge to make smarter trading decisions. Our latest addition to our suite of trading tools is the SMC Trading Pro indicator, version 1.0. Key Features: Major Market Structure Identification with BODY break. Order Block must be in Major Swing ( not Small Swing ). Order Block with Fair Value Gap Detection. Order Block in Discount | Premium zone. Filter for only Bullish, Bearish or All Order
Natürlich, hier ist die Übersetzung in Deutsch: Vorstellung des Astronomie-Indikators für   MT4 / MT5 : Dein ultimativer himmlischer Trading-Begleiter Bist du bereit, deine Trading-Erfahrung auf himmlische Höhen zu heben? Suche nicht weiter als unseren revolutionären Astronomie-Indikator für MT4. Dieses innovative Tool übertrifft herkömmliche Trading-Indikatoren und nutzt komplexe Algorithmen, um dir unvergleichliche astronomische Einblicke und präzise Berechnungen zu bieten. Ein Universum an In
Hurst Cycles Diamonds Description This indicator is an alternative version inspired by the pioneering work of David Hickson and the Hurst Cycles Notes indicator developed by Grafton. The main objective is to provide a clear and intuitive view of the Hurst cycles. Credits Original Concept : David Hickson - Hurst Cycles Theory Inspiration : Grafton - Hurst Diamond Notation Pivots Alternative Version : Fillipe dos Santos Main Features Identifies and displays pivots in multiple time cycles Visual t
Fibonacci retracement is a method of technical analysis for determining support and resistance levels. The TSO Fibonacci Chains Indicator is different from a simple Fibonacci Retracements indicator in that it provides the targets for each retracement level. In other words, there is an Extension Level (D) for every Retracement Level (C). In addition, if an Extension Level is reached, then a new Fibonacci setup is created automatically. These consecutive Fibonacci setups create a chain that reveal
WanaScalper
Isaac Wanasolo
1 (1)
A scalping indicator based on mathematical patterns, which on average gives signals with relatively small SL, and also occasionally helps to catch big moves in the markets (more information in the video) This indicator has three main types of notifications: The first type warns of a possible/upcoming signal on the next bar The second type indicates the presence of a ready signal to enter the market/open a position The third type is for SL and TP levels - you will be notified every time price re
AriBot
Arman Belassarov
AriMax   – AI-Powered Trading Robot AriMax is a cutting-edge AI-powered trading robot designed to help traders maximize profits while minimizing risk. Utilizing advanced machine learning algorithms and real-time market analysis, AriMax identifies high-probability trade opportunities with precision and speed. Key Features:     AI-Driven Market Analysis   – Analyzes market trends and patterns to make data-driven trading decisions.     Automated Execution   – Places trades seamlessly with optimiz
Big Player Range
Thalles Nascimento De Carvalho
5 (3)
Die Macht von "BigPlayerRange" entdecken: Ihr starker Verbündeter in der technischen Marktanalyse BigPlayerRange ist ein fortschrittliches technisches Analysetool, das dazu entwickelt wurde, institutionelle Interessensbereiche im Markt aufzudecken. Mit diesem leistungsstarken Werkzeug können Sie präzise feststellen, wo große Marktteilnehmer aktiv sind, und Ihre Handelsstrategien entsprechend verbessern. Hauptmerkmale: Kartierung institutioneller Interessensbereiche : BigPlayerRange hebt Z
All in One package includes the  Oscillator Predictor ,  MACD Predictor ,  Thrust Scanner  and  Advanced Fibonacci  indicators which are mandatory for applying  Dinapoli  trade plans.  Please visit below links for detailed explanations of indicators. Advanced Fibonacci Indicator =>  https://www.mql5.com/en/market/product/107933 Thrust Scanner Indicator =>  https://www.mql5.com/en/market/product/52829 Overbought /Oversold Predictor indicator => https://www.mql5.com/en/market/product/52628 Macd
Weitere Produkte dieses Autors
Wie oft haben Sie schon nach einem PIVOT gesucht, der jeden Tag zu einer bestimmten Kerze funktioniert? Viele Händler schätzen gerne die Richtung des Tagestrends zu einem bestimmten Zeitpunkt am Tag ein, z. B. 30 Minuten nach Markteröffnung oder um 12 Uhr mittags und so weiter. Mit diesem Indikator können Sie einen bestimmten Zeitpunkt (Stunde und Minute) festlegen und einen Pivot von diesem Zeitpunkt bis zum nächsten Tag zur gleichen Zeit einzeichnen. Er zeigt fünf Linien an, die auf dieser
FREE
Keltner-Enhanced verbessert die Genauigkeit und Lesbarkeit von Keltner-Kanälen mit vielen Optionen für deren Anpassung und fünf weiteren Preisberechnungen über die META-Standardwerte hinaus. Der Keltner-E-Indikator ist ein bandförmiger Indikator, ähnlich wie Bollinger Bänder und Moving Average Envelopes. Er besteht aus einer oberen Hüllkurve oberhalb einer Mittellinie und einer unteren Hüllkurve unterhalb der Mittellinie.  Die wichtigsten Ereignisse, auf die man bei der Verwendung von Keltner
FREE
Der Jurik Advanced MA (JurMA) ist ein nicht nachgebildeter technischer Indikator, der auf der Grundlage des von Mark Jurik konzipierten JMA entwickelt wurde.  Er wurde entwickelt, um die Verzögerung traditioneller gleitender Durchschnitte zu verringern, die Glätte zu verbessern und das Rauschen zu reduzieren. JurMA passt sich der Marktvolatilität an und kann vom Benutzer fein abgestimmt werden, was ihn für die Erkennung von Trends und Umkehrungen auf den Finanzmärkten nützlich macht. Diese Anp
Trend On Close
David Ben Svaiter
TrendOnClose ist ein hochentwickelter Indikator, der für Anleger im Binärmarkt entwickelt wurde und sich auf die statistische Analyse von Trends und Gegentrends innerhalb bestimmter Kerzenzyklen konzentriert. Jeder Zyklus wird durch den CLOSE-Kurs der Kerze definiert, der die Trendrichtung (UP/DOWN - BULL/BEAR) für die anschließende statistische Analyse bis zum Beginn des nächsten Zyklus festlegt. Die statistische Analyse arbeitet mit zwei Konfigurationen: ⦁ Statistisches Ziel als SUBSEQUENT CA
HAshi-E ist eine verbesserte Methode zur Analyse von Heiken-Ashi-Signalen. Unterrichtung: Heiken-Ashi wird besonders für seine Fähigkeit geschätzt, kurzfristige Volatilität herauszufiltern, was es zu einem bevorzugten Instrument für die Identifizierung und Verfolgung von Trends macht. Es hilft bei der Entscheidungsfindung in Bezug auf Einstiegs- und Ausstiegspunkte und unterstützt bei der Unterscheidung zwischen falschen Signalen und echten Trendumkehrungen. Im Gegensatz zu traditionellen Can
Der ADXW wurde von Welles Wilder für tägliche Rohstoff-Charts entwickelt und wird heute in verschiedenen Märkten von technischen Händlern verwendet, um die Stärke eines Trends oder sogar eines Trends für kurz- oder langfristige Trades zu bewerten. Der ADXW verwendet zusätzlich zu seiner Trendlinie (ADX) einen positiven (DI+) und einen negativen (DI-) Richtungsindikator. Laut Wilder hat ein Trend Stärke, wenn das ADX-Signal über 25 liegt; Der Trend ist schwach (oder der Preis hat keinen Trend)
Im Bereich der technischen Analyse zeigt sich ParbMA als äußerst intuitive Werkzeug zur Untersuchung des Parabolic SAR-Trends. Dieser innovative Ansatz nutzt eine anpassbare Linie, die sich durch ihre Vielseitigkeit in Farb-, Form- und Breitenoptionen auszeichnet. Diese Flexibilität verbessert die visuelle Analyse erheblich und unterstützt wesentlich bei der Entwicklung von Strategien und Entscheidungsfindung. Das ParbMA (Parabolic Moving Average) ist ein individueller technischer Indikator, de
Slow AMA
David Ben Svaiter
Compared to simple or exponential moving averages, slow adaptive trend lines might offer a more nuanced view of the trend by adjusting their sensitivity based on market conditions. However, their slow nature might also mean they are late in signaling reversals when market conditions change rapidly - and that is the difference between them and our SlowAMA . SlowAMA was designed to be a better long-term trend indicator than EMA and other Moving Averages. It uses our JurMA calculations, reducing
HAshi-E ist eine verbesserte Methode zur Analyse von Heiken-Ashi-Signalen. Unterrichtung: Heiken-Ashi wird besonders für seine Fähigkeit geschätzt, kurzfristige Volatilität herauszufiltern, was es zu einem bevorzugten Instrument für die Identifizierung und Verfolgung von Trends macht. Es hilft bei der Entscheidungsfindung in Bezug auf Einstiegs- und Ausstiegspunkte und unterstützt bei der Unterscheidung zwischen falschen Signalen und echten Trendumkehrungen. Im Gegensatz zu traditionellen Can
Wie oft haben Sie schon nach einem PIVOT gesucht, der jeden Tag in einem bestimmten Zeitrahmen funktioniert? Viele Händler möchten jeden Tag die Richtung des Tagestrends auf der Grundlage eines bestimmten Zeitintervalls einschätzen, z. B. von 2 Stunden vor der NYSE-Eröffnung bis 1 Stunde danach oder von der NYSE-Eröffnung bis 30 Minuten danach. Mit diesem Indikator können Sie ein bestimmtes Zeitintervall (Stunde und Minute) festlegen und einen Pivot von diesem Intervall bis zum nächsten Tag i
VIDYA Enhanced
David Ben Svaiter
Der Indikator VIDYA-ENHANCED (Variable Index Dynamic Average) ist ein technisches Analyseinstrument zur Erkennung von Trends und Seitwärtsbewegungen. Er passt seine Empfindlichkeit dynamisch an die Marktvolatilität an und verwendet den Chande Momentum Oscillator als Volatilitätsindex. Diese Funktion ermöglicht es VIDYA-ENHANCED, in Zeiten starker Kursbewegungen agiler zu sein und in weniger volatilen Phasen stabiler zu bleiben.  Merkmale: - Wählen Sie den Preis aus 12 Optionen - 5 mehr als i
Auswahl:
Keine Bewertungen
Antwort auf eine Rezension