ADX Color Script
- Utilitys
- Adrian Hernandez Castellanos
- Version: 2.3
- Aktualisiert: 29 Februar 2024
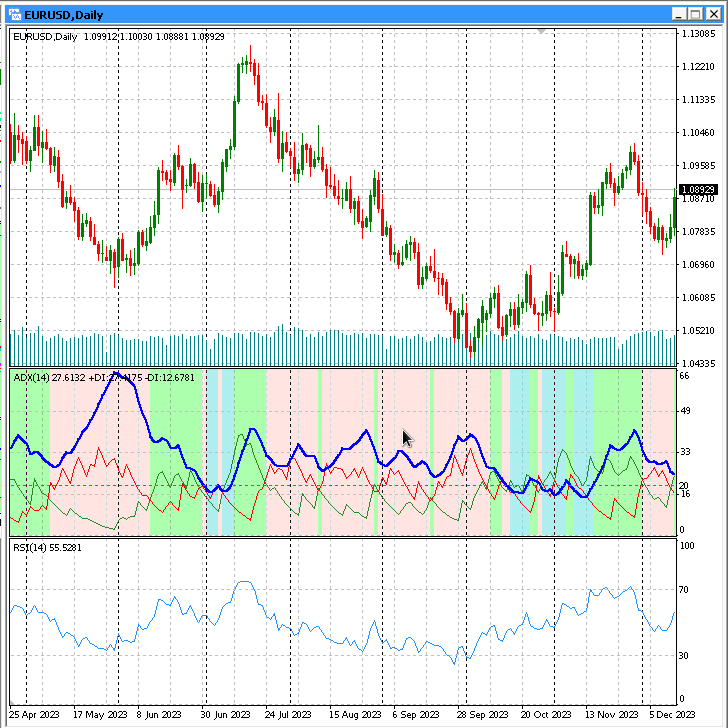
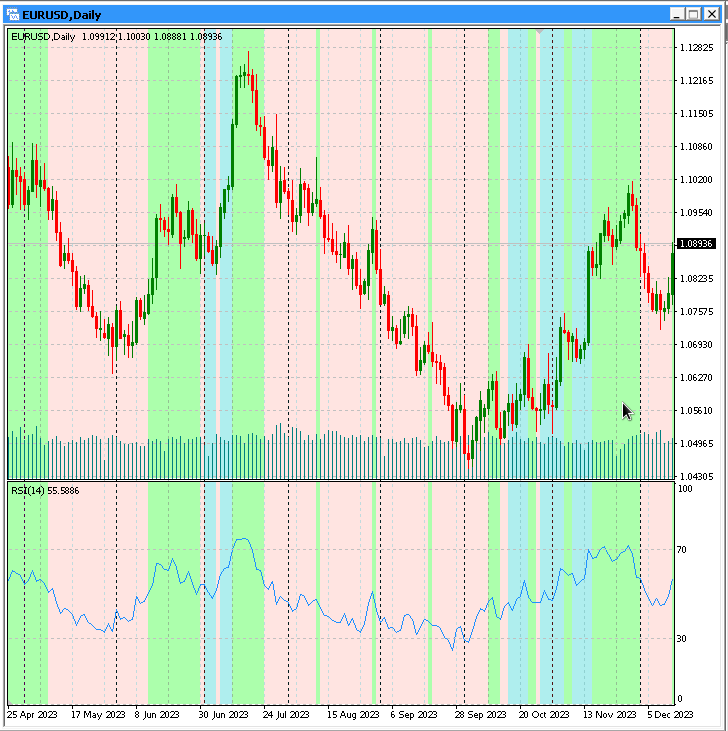
(Drag-and-drop)-Skript zum Einfärben des Hintergrunds des Average Directional Movement Index (ADX)-Indikators je nach Kauf- oder Verkaufstrend
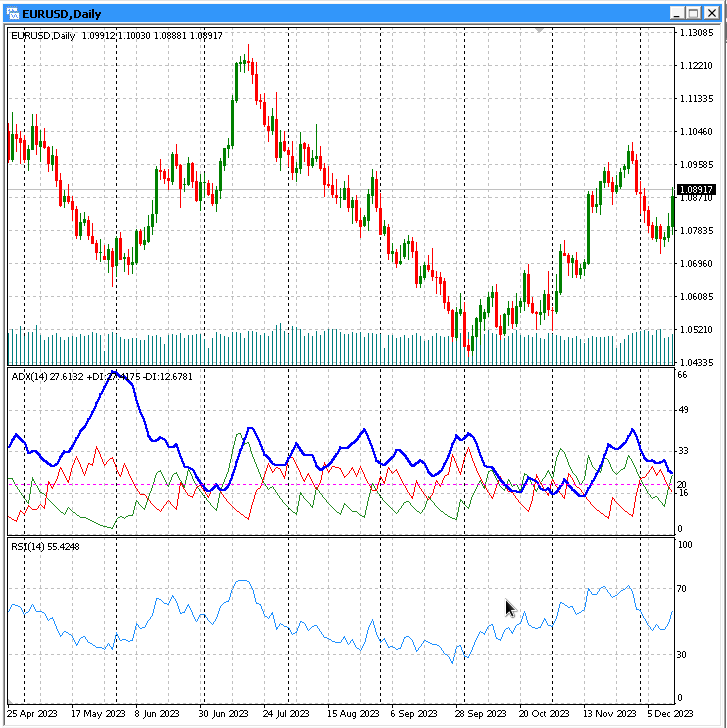
Der Average Directional Movement Index (ADX)-Indikator ist ein technischer Indikator, der zur Messung der Stärke eines Trends verwendet wird. Dieses (Drag-and-drop)-Skript färbt den Hintergrund des ADX-Indikators je nach Kauf- oder Verkaufstrend ein. Die Hintergrundfarbe wird durch die Parameter des Skripts bestimmt.
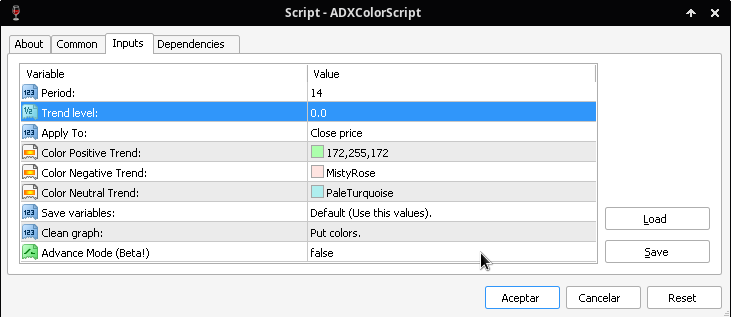
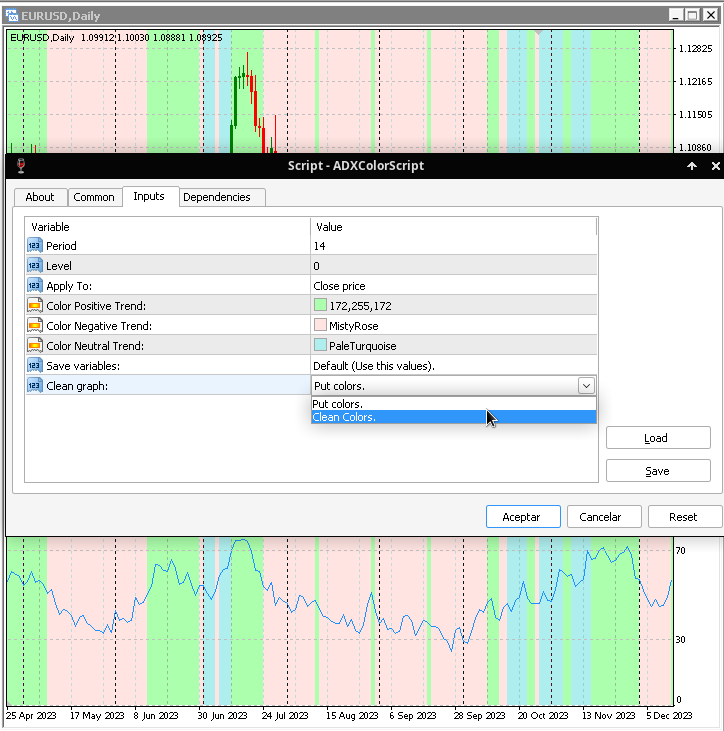
Änderbare Parameter:
- Period: Die Zeitspanne des ADX-Indikators.
- Level: Die Mindestschwelle, die erreicht werden muss, um zu filtern, ob der Trend bullisch oder bärisch ist (Standardwert: 0).
- Apply To: (Close price, Open price, High price, Low price, Median price, Typical price, Weighted price).
- Color Positive Trend: Die Hintergrundfarbe für einen Bullentrend.
- Color Negative Trend: Die Hintergrundfarbe für einen Bärentrend.
- Color Neutral Trend: Die Hintergrundfarbe für einen Neutraltrend.
- Save variables: Speichert die aktuellen Werte, um sie später wiederverwenden zu können.
- Clean graph: Löscht die Farben aus dem Diagramm (Clean colors).
Fazit:
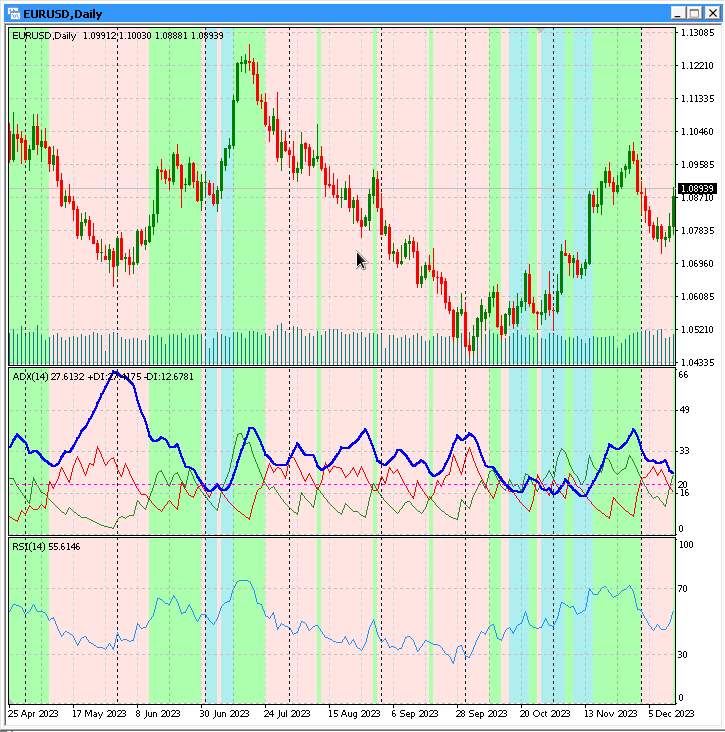
Dieses Skript ist ein nützliches Werkzeug für Marktanalysten, die den ADX-Indikator verwenden. Es erleichtert die Identifizierung von bullischen, bärischen und neutralen Trends.
Kaffee? Klar, ich nehme einen Kaffee. Als Gegenleistung biete ich Ihnen die Indikatorversion dieses Skripts an, damit auch Sie etwas als Geschenk mitnehmen können :-). https://www.mql5.com/de/market/product/109892