ADX Color Script
- Utilities
- Adrian Hernandez Castellanos
- Version: 2.3
- Updated: 29 February 2024
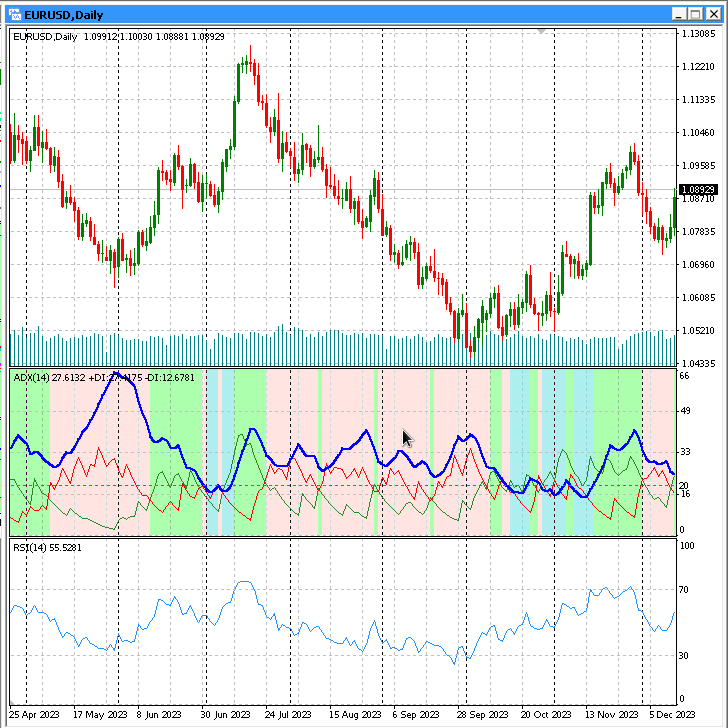
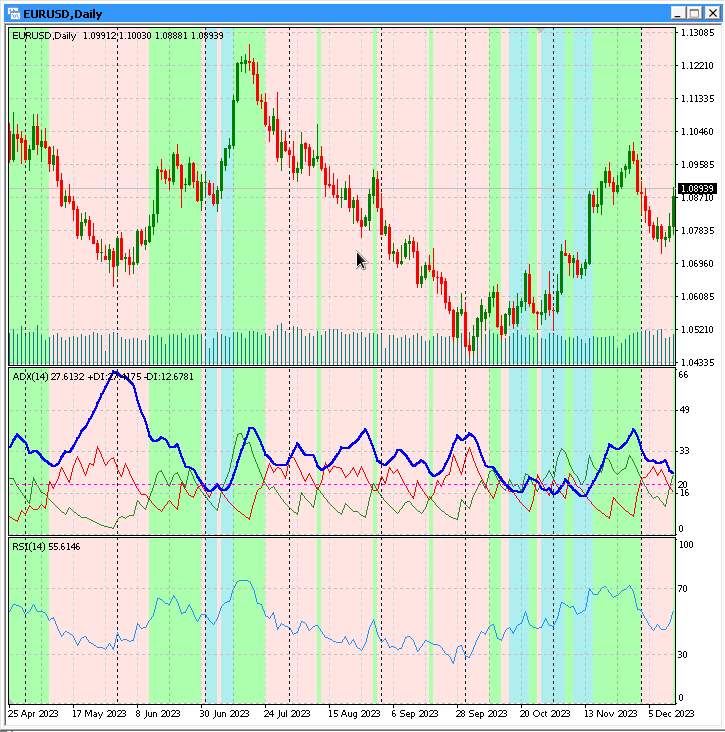
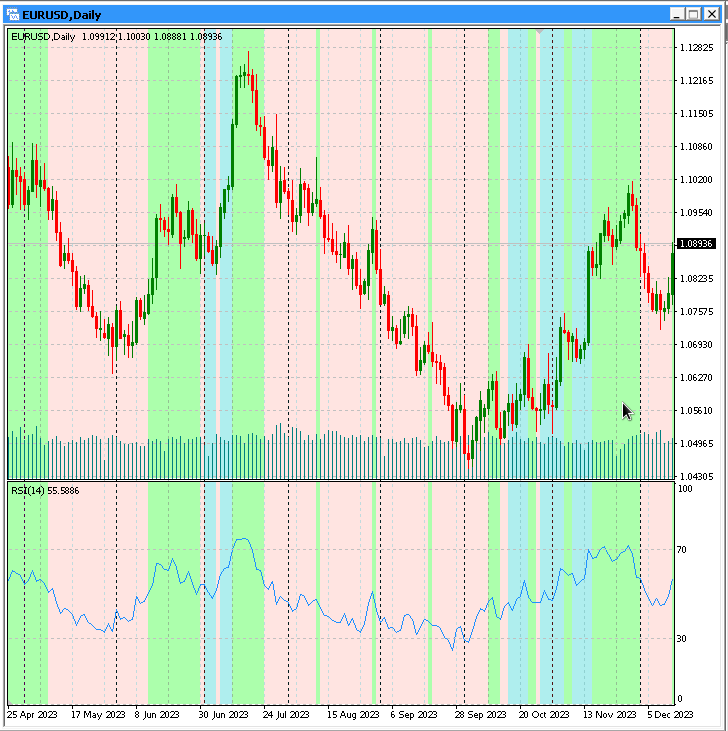
Script (drag and drop) that colors the background of the Average Directional Movement Index (ADX) indicator according to the buy or sell trend
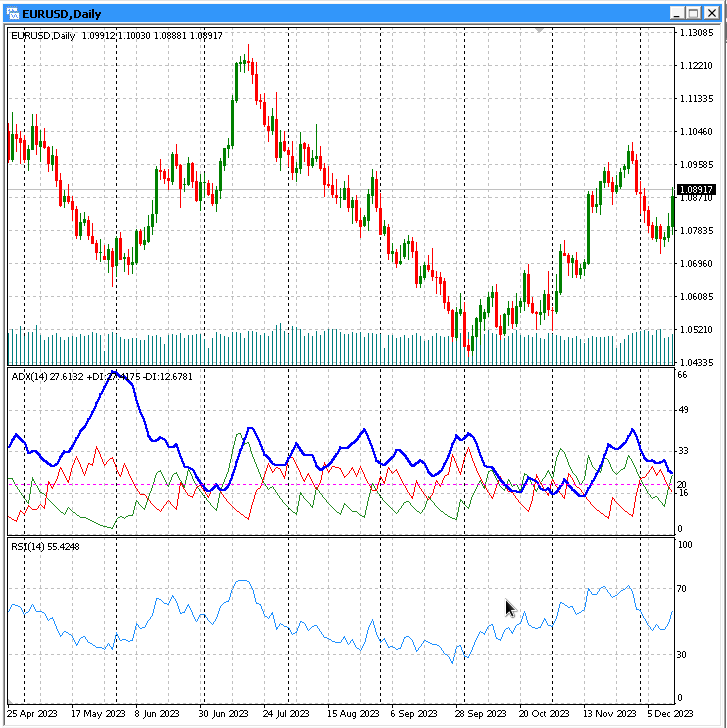
The Average Directional Movement Index (ADX) indicator is a technical indicator used to measure the strength of a trend. This script (drag and drop) colors the background of the ADX indicator according to the trend. The background color is determined by the script parameters.
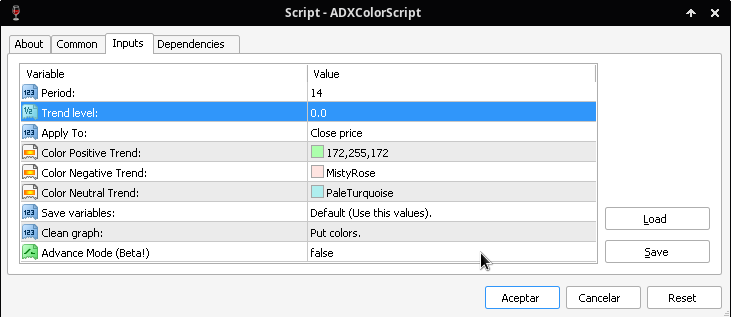
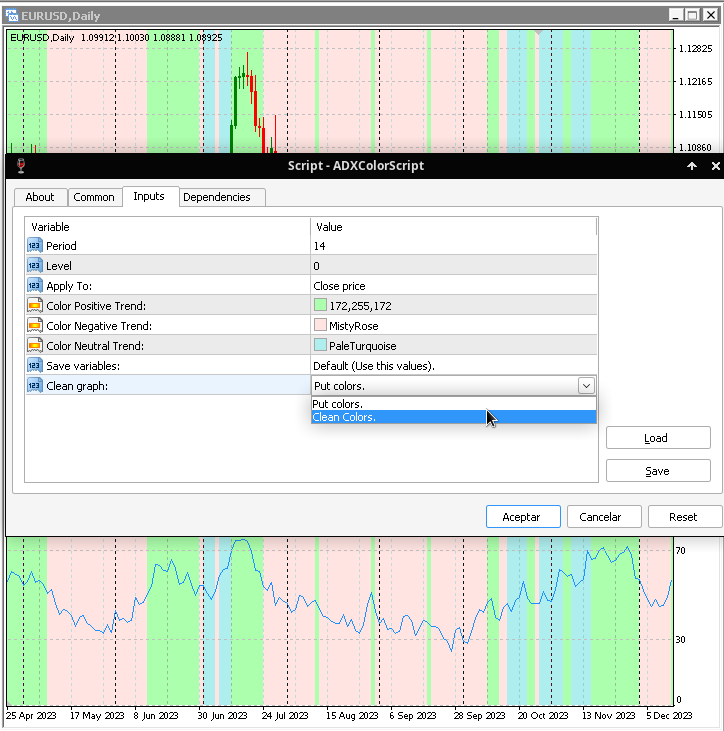
Parameters that can be modified:
- Period: The time period of the ADX indicator.
- Trend level: The minimum level to meet to filter if the trend is bullish or bearish (0 by default).
- Apply To: (Close price, Open price, High price, Low price, Median price, Typical price, Weighted price).
- Color Positive Trend: The background color for a bullish trend.
- Color Negative Trend: The background color for a bearish trend.
- Color Neutral Trend: The background color for a neutral trend.
- Save variables: Saves the current values for reuse later.
- Clean graph: Clears the colors from the graph (Clean colors).
How to use the script:
To use the script, simply drag and drop the indicator onto the chart. Depending on where you drop the indicator on the chart, you will get the result to obtain. From coloring the indicator, to coloring the entire chart. (See screenshots)
Conclusion:
This script is a useful tool for market analysts who use the ADX indicator. The script makes it easy to identify bullish, bearish, and neutral trends.
Coffee? Of course, I'll have a coffee. In return, I'll offer you the indicator version of this script, so that you can also take something as a gift :-). https://www.mql5.com/en/market/product/109892