Desk analytical table
- Utilitys
- Valeriy Medvedev
- Version: 1.8
- Aktualisiert: 7 Juli 2017
- Aktivierungen: 5
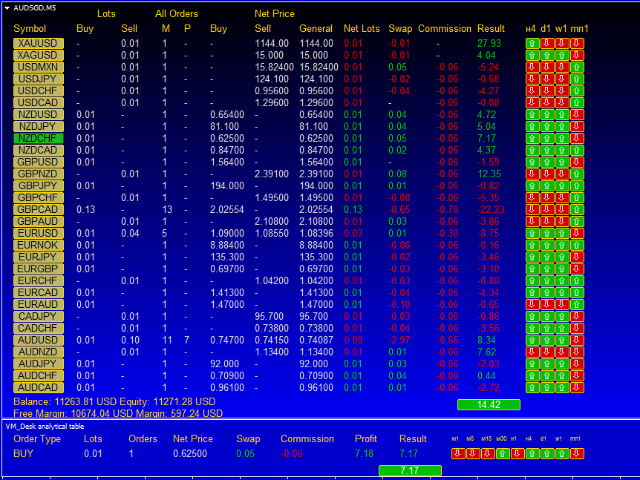
This indicator is designed for analyzing your positions on 30 financial instruments with the font size of the output information between 8 and 10. If the font size is 11 you will see only 26 instruments and so on: 12-25, 13-24, 14-20. The font size can range from 8 to 14.
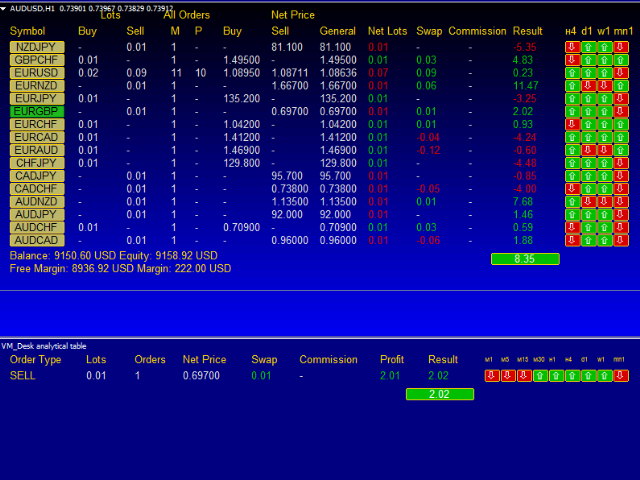
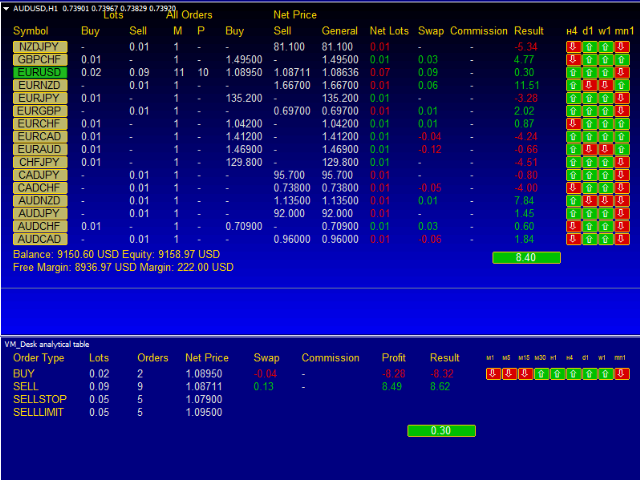
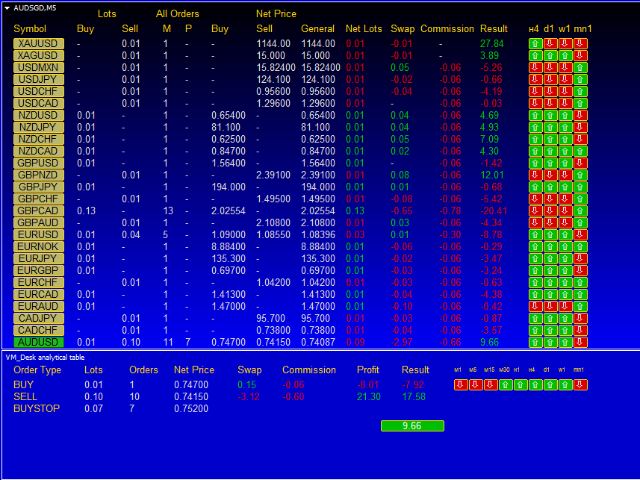
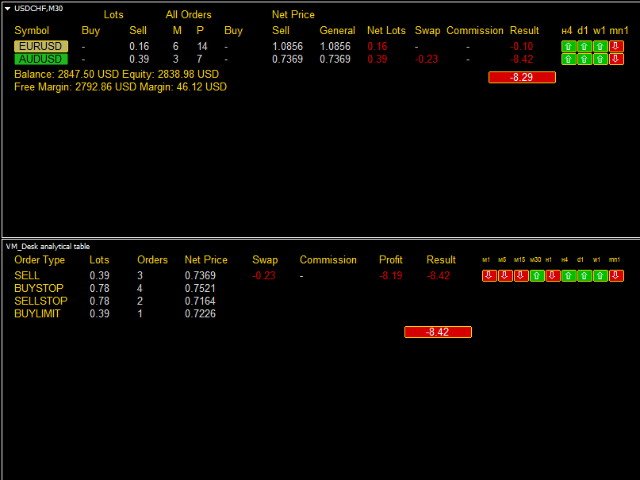
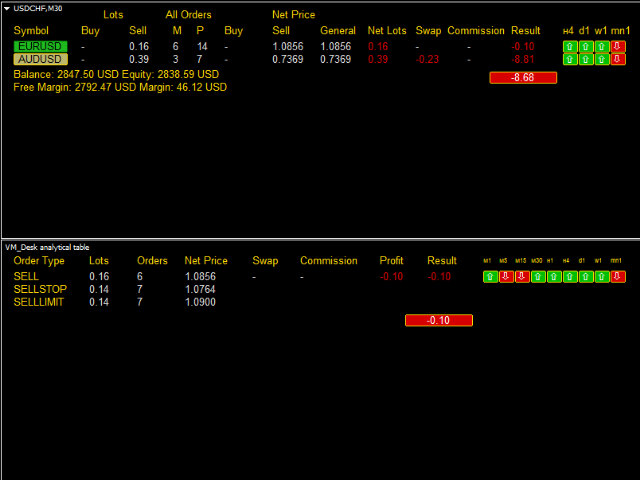
The main window contains buttons with names of financial instruments and lines where brief information about all open positions is displayed. Two columns show the total volumes in lots of positions in each trading direction: BUY and SELL. Next, columns "М" and "Р" in the section "All Orders" correspond to the terms "Number of Market Orders" and "Number of Pending Orders", respectively. Columns with the net prices for each direction and the average price provide the ability to see the net result of the current position in lots, as well as the accrued swaps and commissions, the result in the deposit currency and as a percentage of the account balance. The line ends with labels H4, D1, W1, MN1.
The arrow and color indicate the ratio between Open and Close prices. If the Close price exceeds the Open price, the label color corresponds to the color Plus. And color changes to color Minus if the Open price exceeds the Close price.
If you click a button with a name of an instrument in the main window, information concerning the selected instrument will be displayed in the lower window. The order type, number of lots, number of orders, breakeven level, swap and commission, profit (loss) and trading result of each order type are displayed in the line. Current trading results are shown at the bottom of the table. You can also find 9 labels showing available timeframes and position of the current candle close price for each of them. Click the same button again to deactivate it and switch to another instrument.
The indicator can be a useful aid for those who trade a huge number of lots and instruments. The indicator does not require any extra settings except for the font size and color of buttons and text.
To install the indicator, select a financial instrument you are not going to work with. The indicator will change the appropriate symbol properties for a comfortable operation. Constructive suggestions and feedback are highly appreciated.
Parameters
- include background indicator - enable/disable the default background mode (disabled);
- standard out background indicator - background on top by default (bottom);
- the replacement of the main background color graphics - change the main chart background, disabled by default;
- background color of the screen - default chart background color;
- Font Size min 8 max 14 - font size and its value range;
- Header color - color of text in the table;
- Header text color - color of text in lines;
- Text Color button - color of text on buttons;
- Color button in the ON position - color of the button in on-position;
- Border Color button ON position- color of the button border in on-position;
- Color button in the OFF position - color of the button in off-position;
- Border Color button OFF position - color of the button border in off-position;
- Color plus - color of profit or plus;
- Color minus - color of loss or minus;
- Text color information button - color of text in timeframe labels.























Der Benutzer hat keinen Kommentar hinterlassen