• Übersicht
  • Bewertungen
  • Diskussion

Envelope of Adaptive Moving Average

Der "Envelope of Adaptive Moving Average" Indikator ist ein Tool, das Ihnen dabei hilft, fundierte Entscheidungen auf dem Finanzmarkt zu treffen. Er wurde entwickelt, um Ihnen eine klare Vorstellung von der Trendrichtung und den möglichen Ein- und Ausstiegspunkten in Ihren Trades zu vermitteln.

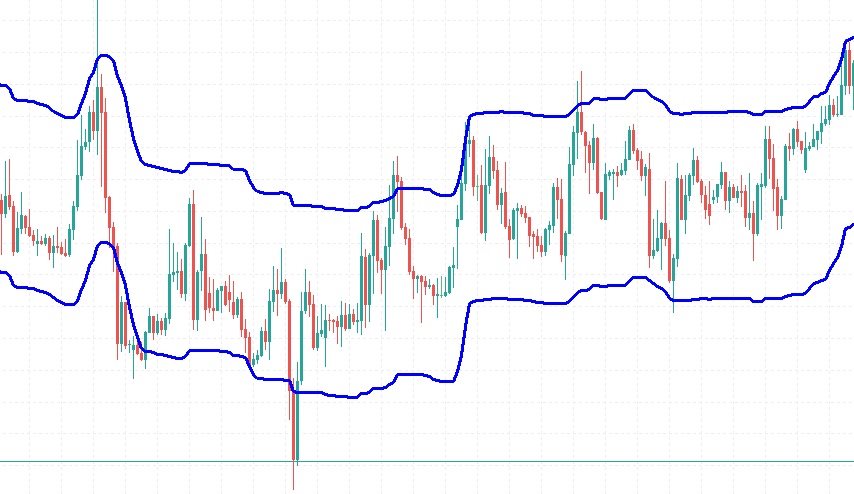
Dieser Indikator basiert auf einem adaptiven gleitenden Durchschnitt, was bedeutet, dass er sich automatisch an Veränderungen in der Marktvolatilität anpasst. Dies macht ihn besonders nützlich in Märkten, die sowohl ruhig als auch volatil sein können. Der Indikator zeigt zwei Linien an, die den adaptiven gleitenden Durchschnitt umgeben. Diese Linien helfen dabei, wichtige Unterstützungs- und Widerstandsniveaus zu identifizieren und ermöglichen es Ihnen, fundiertere Entscheidungen darüber zu treffen, wann Sie ein Asset kaufen oder verkaufen sollten.

Trotz seiner fortgeschrittenen technischen Natur ist er einfach zu verstehen und zu verwenden, was ihn sowohl für Anfänger als auch erfahrene Trader geeignet macht. Die Fähigkeit des Indikators, sich an sich ändernde Marktbedingungen anzupassen, macht ihn vielseitig und effektiv in verschiedenen Situationen. Er liefert eine klare visuelle Darstellung von Markttrends, die dazu beiträgt, impulsive Trades zu vermeiden. Dieser Indikator kann ein wertvolles Werkzeug in Ihrem Trading-Toolkit sein.
Empfohlene Produkte
Nyse Usdxy
Mitchell Dean Ede
Displays a USD DXY chart in a seperate window below the main chart. YOUR BROKER MUST HAVE THESE SYMBOLS FOR THE INDICATOR TO WORK Based on EUR/USD, USD/JPY, GBP/USD, USD/CAD, USD/CHF and USD/SEK All these pairs must be added to Market Watch for the indicator to work correctly As this is calculated using a formula based on the 6 pairs it will only work when the market is open. YOUR BROKER MUST HAVE THESE SYMBOLS FOR THE INDICATOR TO WORK Displays a USD DXY chart in a seperate window below the
FREE
Strong Move
Triet Lam Minh
This indicator combines RSI(14) and ADX(14) to find out the signal that price moves strongly. When it appears signal (represent by the yellow dot), and price is going down, let consider to open a SELL order. Otherwise, let consider to open a BUY order. In this case, the strength of moving is strong (normally after sideway period), so  we can set TP by 3 times of SL  . 
FREE
IQuantum
Evgeniy Scherbina
The indicator IQuantum shows trading signals for 10 symbols in the daily chart: AUDCAD, AUDUSD, EURUSD, GBPCAD, GBPCHF, GBPUSD, NZDUSD, USDCAD, USDCHF, and USDJPY. Signals of the indicator are produced by 2 neural models which were trained independently from one another. The inputs for the neural models are normalised prices of the symbols, as well as prices of Gold, Silver and markers of the current day. Each neural model was trained in 2 ways. The Ultimate mode is an overfitted neural mo
FREE
Range Box or Initial Balance
Cristian Mateo Duque Ocampo
5 (1)
The initial balance (IB) is a range in which the price spent its first two OPT periods after the opening. In other words, the opening balance is a range of the first hour after the market opened. The opening balance arose from room trading, as room traders observed the various ranges after the market opened. This indicator allows you to enter the starting and ending hours and minutes of a specific hourly time range so that the trader can set up different IBs according to the market. Autom
FREE
Hello, This indicator is a unique high reliability 7-in-1 multicurrency indicator comprising these sub-indicator’s: A Trend Power Crossover Indicator. A Percent Change Crossover Indicator. A Currency Overbought/Oversold Indicator. A Currency Deviation Indicator. A Currency Impulse Signal Indicator. A Trend Power Indicator. A Currency Volatility Indicator. The main advantage of this indicator is that it's reasoning by currency and not by currency pair. The values of each sub-indicator are calcula
FREE
VolumesWithMedia
Jonathan Pereira
5 (1)
Das Volumen ist ein weit verbreiteter Indikator in der technischen Analyse, es gibt jedoch eine Variation, die noch nützlicher ist als das Volumen selbst: den gleitenden Durchschnitt des Volumens. Es ist nichts anderes als ein gleitender Durchschnitt, der auf den beliebten Volumenindikator angewendet wird. Wie der Name schon sagt, dient Volume + MA dazu, das zu einem bestimmten Zeitpunkt getätigte Transaktionsvolumen (Käufe und Verkäufe) eines bestimmten finanziellen Vermögenswerts zusammen
FREE
Free version of  https://www.mql5.com/en/market/product/44815 Simple indicator to calculate profit on fibonacci retracement levels with fixed lot size, or calculate lot size on fibonacci levels with fixed profit. Add to chart and move trend line to set the fibonacci retracement levels. Works similar as default fibonacci retracement line study in Metatrader. Inputs Fixed - select what value will be fix, lot or profit  (available in full version, lot is set on free version) Fixed value - value tha
FREE
Dark Bands MT5
Marco Solito
4.88 (234)
Dark Bands   is an Indicator for intraday trading. This Indicator is based on Counter Trend  strategy but use also Volatility. We can enter in good price with this Indicator, in order to follow the inversions on the current instrument. Key benefits Easily visible take profit/stop loss lines Reliable bands lines with futuristic colors, and  Intuitive directional arrows Useful statistics , which indicate the win rate of the signals Plus Package  available, leave a feedback to receive it for
FREE
TilsonT3
Jonathan Pereira
Tillson's T3 moving average was introduced to the world of technical analysis in the article ''A Better Moving Average'', published in the American magazine Technical Analysis of Stock Commodities. Developed by Tim Tillson, analysts and traders of futures markets soon became fascinated with this technique that smoothes the price series while decreasing the lag (lag) typical of trend-following systems.
FREE
Trend Strength Analyzer
Andrey Sorokin
4.83 (6)
The technical indicator Trend Strength Analyzer measures the deviation of the price of an instrument from average values ​​over a specific period of time. A comparative analysis of the relative strength of bulls and bears underlies the indicator. If bulls prevail, an upward trend. If bears are stronger - a downward trend.      Settings: Strike Energy (2 solid lines) = 14. Influence Power (2 dotted lines) = 50. The TSA oscillator is effective in an active market. The most commonly used indica
FREE
Reversal Composite Candles
MetaQuotes Ltd.
3.5 (24)
The idea of the system is to indentify the reversal patterns using the calculation of the composite candle. The reversal patterns is similar to the "Hammer" and "Hanging Man" patterns in Japanese candlestick analysis. But it uses the composite candle instead the single candle and doesn't need the small body of the composite candle to confirm the reversal. Input parameters: Range - maximal number of bars, used in the calculation of the composite candle. Minimum - minimal size of the composite can
FREE
This indicator uses a different approach from the previous version to get it's trendlines. This method is derived from Orchard Forex, and the process of making the indicator is demonstrated in there video   https://www.youtube.com/watch?v=mEaiurw56wY&t=1425s . The basic idea behind this indicator is it draws a   tangent line   on the highest levels and lowest levels of the bars used for calculation, while ensuring that the lines don't intersect with the bars in review (alittle confusing? I kno
FREE
This utility is the demo version of the Binance Full Trader. This version is provided so the customers can test performance and options of the main version. ·        This version has these restrictions: 1.        Only BTCUSDT is available for price chart and Test Mode. 2.         The Real Mode is not accessible. 3.        The LIMIT and STOPLOSSLIMIT are not accessible. 4.       The Indicator mode is not accessible.   ·        The full version and the instruction of use can be downloadable from t
FREE
Breakout MV
Emmanouil Bampalos
Breakout MV :  This Expert Advisor offers you one of the most fundamental trading strategy,  combining Moving Average and Volums indicators!  Key Features : Consistent Performance : Breakout strategy has demonstrated a robust performance across various market conditions, by capitalizing on significant price movements. Strategic Trade Execution : We select the desired range, and once the price approaches these levels and the indicators confirm our entry, we open a trade. The trade will close ei
FREE
Middle of daily range
Raphael Gil Abreu De Oliveira
A simple and efficient indicator that plots and updates the 50% of the current day, for those who use this point as a reference in day trading. On trend days the 50% region tends to be a good resistance point, ideal for making new entries. On non-trend days (sideways) the 50% region is great for carrying out positions. In addition, for study or back-testing criteria, you can define the amount of previous days to be plotted by the indicator. For questions or suggestions, please contact u
FREE
Ichimoku Trend Alert is the Ichimoku Kinko Hyo indicator with Alerts and signal filters. Ichimoku Trend Alert features: Optional check of Ichimoku cloud, Tenkan sen(Conversion Line), Kijun sen(Base Line), Senkou span A, Senkou span B, and Chikou span relative to price, and more. Popup, email, and phone notification alerts for selected symbols and timeframes. There are 9 classic Ichimoku trend filters you can enable/disable in settings: Price/Cloud Order:   Checks the price position relative
FREE
RSI vs SMA Indicator
Asanka Priyasad Peiris Dadigamuwage
Special Offer ... It is totally free for all. New one coming soon................... About This Indicator: RSI vs SMA Indicator: A Comprehensive Technical Analysis Tool for Better for Identify the Short and Long Signals. The RSI vs SMA Indicator is a powerful technical analysis tool designed to understanding Market Price Fluctuation for Long or Short signals. This user-friendly Indicator good for both novice and experienced traders, providing valuable indication in price chart and separate wi
FREE
** This is the short version of Symbol Changer . You might want to refer to full version with further features. Symbol Chart Changer   is an indicator/utility that offers you the option to switch between symbols and timeframes. You can choose any symbol and timeframe on the same chart with just a few clicks.  In addition, this indicator also shows the profit of the symbol through the color of the buttons. For MT4:   Symbol Chart Changer Features All symbols selected in MarketWatch, that allow y
FREE
This EA is named Dinosaur Hunter(DH) because it can capture very large trend, such as 5000-10000 pips. DH trades infrequently as it patiently waits for the right market conditions. DH can load multiple currency pairs on a single chart to increase the number of trades. Live Signal This is a demo version that only for fixed lot size of 0.01. To obtain the full version, please purchase Dinosaur Hunter Pro . This EA has been tested from 2015 to the present. The test used data from Dukascopy. If
FREE
Show Pips for MT5
Roman Podpora
4.63 (19)
Dieser Informationsindikator ist nützlich für diejenigen, die immer über die aktuelle Situation auf dem Konto informiert sein möchten. -   Weitere nützliche Indikatoren Der Indikator zeigt Daten wie Gewinn in Punkten, Prozentsatz und Währung sowie den Spread für das aktuelle Paar und die Zeit bis zum Schließen des Balkens im aktuellen Zeitrahmen an. Für die Platzierung der Informationslinie im Diagramm gibt es mehrere Möglichkeiten: Rechts vom Preis (läuft hinter dem Preis); Als Kommentar (in
FREE
Das Matrix Arrow Indicator Multi Timeframe Panel MT5 ist ein kostenloses Add-On und eine großartige Bereicherung für Ihren Matrix Arrow Indicator MT5 . Es zeigt das aktuelle Matrix Arrow Indicator MT5 -Signal für 5 benutzerdefinierte Zeitrahmen und für insgesamt 16 veränderbare Symbole/Instrumente. Der Benutzer hat die Möglichkeit, jeden der 10 Standardindikatoren, aus denen der Matrix Arrow Indicator MT5 besteht, zu aktivieren/deaktivieren. Alle der 10 Standardindikatorattribute sind ebenfalls
FREE
Estratégia de negociação MACD O cálculo do MACD é executado uma vez a cada tick, e são considerados para fim de cálculo os três últimos resultados, para analisar o cruzamento da linha de zero, ou seja quando o último resultado for maior que 0 e o antepenúltimo não então há um cruzamento para cima e analogamente para baixo, quando um cruzamento é constatado o estado de uma variável de controle é alterado de "false" para "true", permitindo o abertura de uma posição caso a média de sinal também cru
FREE
SyntheticaFX Power
Hendrik Lodewyk Coetsee
The "SyntheticaFX Power Indicator" is an exceptional trading tool designed to offer valuable insights into market strength and potential changes, without revealing its proprietary methodology. This powerful indicator is ideally utilized in conjunction with our specialized tools, the " SyntheticaFX CrashSlayer and " BoomSlayer " Spike Indicators, to provide traders and investors with a comprehensive and dynamic trading experience. When employed alongside our SyntheticaFX CrashSlayer and BoomSlaye
FREE
This Expert Advisor is used to send messages from the PCT Multi indicator to Telegram. The EA has 5 settings: - Channel name: The name of the Telegram channel. - Token: Your bot's Token. - Entries: Entry messages will be sent. - Results: Entry results will be sent. - Alerts: Alerts will be sent. How to set up: In the Tools -> Options menu, in the "Expert Advisors" tab: - Check the "Allow WebRequest for listed URL:" option. - Click "add new URL" and add " https://api.telegram.org " (without t
FREE
Didi Index TSB
Sonia Tait
4.33 (3)
O indicador criado por Didi Aguiar, o mestre das Agulhadas! O padrão do indicador é o cruzamento de três médias móveis simples. Média rápida, período 3. Média normalizada, período 8. Média lenta, período 20. Quando as três médias se cruzam próximas o suficiente, acontece a agulhada! Pela posição das médias é possível identificar: Agulhada de compra, agulhada de venda, ponto falso e beijo da mulher aranha. Quer saber mais? Procure pelo site dos robôs oficiais da Dojistar: tradesystembots.co
FREE
Mirrorized Moving Averages
Mahmoud Sabry Mohamed Youssef
5 (6)
I always wondered if I can have multiple time frame Moving average on same chart , it is not possible , now with my Indicator is possible , As you know Moving average is lagging not leading indicator , but how can I predict future levels of it ? I came with this idea , I hope you will like it , I made a Mirror of Moving average , the other side of specific time will be shown in the other side of the chart where the price didnt reach yet , that will help you to know the levels you can start sel
FREE
ROMAN5 Time Breakout Indicator automatically draws the boxes for daily support and resistance breakouts. It helps the user identifying whether to buy or sell. It comes with an alert that will sound whenever a new signal appears. It also features an email facility. Your email address and SMTP Server settings should be specified in the settings window of the "Mailbox" tab in your MetaTrader 5. Blue arrow up = Buy. Red arrow down = Sell. You can use one of my Trailing Stop products that automatical
FREE
Color Trend
Bruno Goncalves Mascarenhas
Combining the best of Price Action , Directional Movement , and Divergence / Convergence analysis, the Candle Color Trend is the easy and reliable way to identify the direction of the trend. The indicator automatically paints the candles according to the premise that the upward trend is defined by prices that form a series of ascending tops and bottoms. On the other hand, the downward trend is defined by prices that form a series of descending tops and bottoms. Color Trend is certainly one
FREE
SSL Alerts
Luis Enrique Ricales
================         // Average period                      ma_Sma,                               // Simple moving average          ma_Ema,                               // Exponential moving average          ma_Smma,                              // Smoothed MA          ma_Lwma                               // Linear weighted MA ===============   // Average method       // Turn alerts on?       // Alert on current bar?      // Display messageas on alerts?        // Play sound on alerts?    
FREE
Käufer dieses Produkts erwarben auch
Atomic Analyst MT5
Issam Kassas
4.79 (19)
Zunächst einmal ist es erwähnenswert, dass dieser Handelsindikator nicht neu malt, nicht neu zeichnet und keine Verzögerung aufweist, was ihn sowohl für manuellen als auch für Roboterhandel ideal macht. Benutzerhandbuch: Einstellungen, Eingaben und Strategie. Der Atom-Analyst ist ein PA-Preisaktionsindikator, der die Stärke und das Momentum des Preises nutzt, um einen besseren Vorteil auf dem Markt zu finden. Ausgestattet mit fortschrittlichen Filtern, die helfen, Rauschen und falsche Signale z
Atbot
Zaha Feiz
4.96 (28)
AtBot: Wie es funktioniert und wie man es benutzt ### Wie es funktioniert Der "AtBot"-Indikator für die MT5-Plattform generiert Kauf- und Verkaufssignale mithilfe einer Kombination von technischen Analysetools. Er integriert den einfachen gleitenden Durchschnitt (SMA), den exponentiellen gleitenden Durchschnitt (EMA) und den Durchschnitt der wahren Reichweite (ATR)-Index, um Handelsmöglichkeiten zu identifizieren. Darüber hinaus kann er Heikin Ashi-Kerzen verwenden, um die Signalgenauigkeit zu
Zunächst einmal ist es wichtig zu betonen, dass dieses Handelssystem ein Nicht-Repainting-, Nicht-Redrawing- und Nicht-Verzögerungsindikator ist, was es sowohl für manuelles als auch für automatisches Trading ideal macht. Online-Kurs, Handbuch und Vorlagen herunterladen. Das "Smart Trend Trading System MT5" ist eine umfassende Handelslösung, die für neue und erfahrene Trader maßgeschneidert ist. Es kombiniert über 10 Premium-Indikatoren und bietet mehr als 7 robuste Handelsstrategien, was es zu
Gold Stuff mt5
Vasiliy Strukov
4.9 (185)
Gold Stuff mt5-Ein Trendindikator, der speziell für Gold entwickelt wurde, kann auch auf allen Finanzinstrumenten verwendet werden. Der Indikator wird nicht neu gezeichnet und verzögert sich nicht. Empfohlener Zeitrahmen H1. WICHTIG! Kontaktieren Sie mich sofort nach dem Kauf, um Anweisungen und Bonus zu erhalten!     Sie können eine kostenlose Kopie unseres Strong Support- und Trendscanner-Indikators erhalten, bitte senden Sie uns eine persönliche Nachricht. Mich! DATEN Draw Arrow - in
TPSproTREND PrO MT5
Roman Podpora
4.89 (9)
TPSpro TREND PRO   ist ein Trendindikator, der den Markt automatisch analysiert und Informationen über den Trend und jede seiner Änderungen liefert sowie Signale für den Einstieg in Geschäfte ohne Neuzeichnung gibt! Der Indikator verwendet jede Kerze und analysiert sie separat. bezieht sich auf verschiedene Impulse – Aufwärts- oder Abwärtsimpuls. Exakte Einstiegspunkte in Transaktionen für Währungen, Krypto, Metalle, Aktien, Indizes! Version MT5                   VOLLSTÄNDIGE BESCHREIBUNG DES I
TPSpro RFI Levels MT5
Roman Podpora
4.67 (9)
Umkehr der ersten Impulsniveaus (RFI)       ANWEISUNGEN       Russland       -        ENG    Die Empfehlung basiert auf dem Indikator -   TPSpro   TREND PRO -   Version MT5 Die wichtigsten Elemente in der Branche sind entweder in Zonen oder in der Fabrik enthalten, oder sie führen zu einer Lösung bei einem Kauf oder dem Verkauf eines anderen Instruments. Wenn viele Menschen ihre Rechte nicht auf dem Händlerkonto verschlüsseln, werden die Folgen nicht schnell genug sein. Ich habe es damit abgesch
Dies ist ein Indikator für MT5, der genaue Signale für den Einstieg in einen Handel ohne Repainting (Neuzeichnen) liefert. Er kann auf alle Finanzwerte angewendet werden: Forex, Kryptowährungen, Metalle, Aktien, Indizes. Er liefert ziemlich genaue Schätzungen und sagt Ihnen, wann es am besten ist, eine Position zu eröffnen und zu schließen. Sehen Sie sich das Video (6:22) mit einem Beispiel für die Verarbeitung nur eines Signals an, das sich für den Indikator gelohnt hat! Die meisten Händler ver
Zunächst einmal ist es wichtig zu betonen, dass dieses Handelstool ein Nicht-Repaint-, Nicht-Redraw- und Nicht-Verzögerungsindikator ist, was es ideal für professionelles Trading macht. Online-Kurs, Benutzerhandbuch und Demo. Der Smart Price Action Concepts Indikator ist ein sehr leistungsstarkes Werkzeug sowohl für neue als auch erfahrene Händler. Er vereint mehr als 20 nützliche Indikatoren in einem und kombiniert fortgeschrittene Handelsideen wie die Analyse des Inner Circle Traders und S
Quantum Trend Sniper
Bogdan Ion Puscasu
4.92 (48)
Wir stellen vor       Quantum Trend Sniper Indicator   , der bahnbrechende MQL5-Indikator, der die Art und Weise, wie Sie Trendumkehrungen erkennen und handeln, verändert! Entwickelt von einem Team erfahrener Händler mit über 13 Jahren Handelserfahrung,       Quantum Trend Sniper-Indikator       wurde entwickelt, um Ihre Trading-Reise mit seiner innovativen Methode zur Identifizierung von Trendumkehrungen mit extrem hoher Genauigkeit auf ein neues Niveau zu heben. ***Kaufe Quantum Trend Snipe
Trend Screener Pro MT5
STE S.S.COMPANY
4.88 (67)
Nutzen Sie die Macht des Trendhandels mit Trend Screener Indicator: Ihrer ultimativen Trendhandelslösung, die auf Fuzzy-Logik und einem System mit mehreren Währungen basiert! Steigern Sie Ihren Trendhandel mit Trend Screener, dem revolutionären Trendindikator mit Fuzzy-Logik. Es handelt sich um einen leistungsstarken Trendfolgeindikator, der über 13 Premium-Tools und -Funktionen sowie 3 Handelsstrategien kombiniert und ihn zu einer vielseitigen Wahl macht, um Ihren Metatrader in einen Trendanaly
FX Power MT5 NG
Daniel Stein
5 (6)
Erhalten Sie Ihr tägliches Marktupdate mit Details und Screenshots über unser Morning Briefing hier auf mql5 und auf Telegram ! FX Power MT5 NG ist die nächste Generation unseres langjährig sehr beliebten Währungsstärkemessers FX Power. Und was bietet dieser Stärkezähler der nächsten Generation? Alles, was Sie am ursprünglichen FX Power geliebt haben PLUS GOLD/XAU-Stärkeanalyse Noch präzisere Berechnungsergebnisse Individuell konfigurierbare Analysezeiträume Anpassbares Berechnungslimit für noc
FX Volume MT5
Daniel Stein
4.94 (17)
Erhalten Sie Ihr tägliches Marktupdate mit Details und Screenshots über unser Morning Briefing hier auf mql5 und auf Telegram ! FX Volume ist der ERSTE und EINZIGE Volumenindikator, der einen ECHTEN Einblick in die Marktstimmung aus Sicht eines Brokers bietet. Es bietet fantastische Einblicke in die Positionierung von institutionellen Marktteilnehmern, wie z.B. Brokern, auf dem Forex-Markt, viel schneller als COT-Berichte. Diese Informationen direkt auf Ihrem Chart zu sehen, ist der wahre Game
IX Power MT5
Daniel Stein
4.17 (6)
IX Power   bringt die unschlagbare Präzision von FX Power endlich auch zu Nicht-Forex-Symbolen. Es bestimmt präzise die Intensität von kurz-, mittel- und langfristigen Trends in Ihren Lieblingsindizes, Aktien, Rohstoffen, ETFs und sogar Kryptowährungen. Sie können   alles analysieren, was   Ihr Terminal zu bieten hat. Probieren Sie es aus und erleben Sie, wie   sich Ihr Timing   beim Handel   deutlich verbessert . IX Power Hauptmerkmale 100% präzise, nicht nachpinselnde Berechnungsergebni
XQ Indicator MetaTrader 5
Marzena Maria Szmit
3.5 (2)
Step into the realm of Forex trading with confidence and precision using XQ, a cutting-edge Forex indicator designed to elevate your trading game to unprecedented heights. Whether you're a seasoned trader or just stepping into the world of currency exchange, XQ Forex Indicator empowers you with the insights and signals needed to make informed trading decisions. The signal conditions are a combination of three indicators, and XQ Forex Indicator only display  medium and long-term trends . The ind
Easy By Sell is a market indicator for opening and closing positions. It becomes easy to track market entries with alerts. It indicates trend reversal points when a price reaches extreme values ​​and the most favorable time to enter the market. it is as effective as a Fibonacci to find a level but it uses different tools such as an algorithm based on ATR indicators and Stochastic Oscillator. You can modify these two parameters as you wish to adapt the settings to the desired period. My othe
Dieses Dashboard zeigt die   neuesten verfügbaren harmonischen   Muster für die ausgewählten Symbole, so dass Sie Zeit sparen und effizienter sein werden /   MT4-Version . Kostenloser Indikator:   Basic Harmonic Pattern Spalten des Indikators Symbol:   die ausgewählten Symbole werden angezeigt Trend:   bullish oder bearish Pattern :   Art des Musters (Gartley, Schmetterling, Fledermaus, Krabbe, Hai, Cypher oder ABCD) Entry :   Einstiegskurs SL:   Stop-Loss-Kurs TP1:   1. Take-Profit-Kurs
TrendMaestro5
Stefano Frisetti
note: this indicator is for METATRADER4, if you want the version for METATRADER5 this is the link:  https://www.mql5.com/it/market/product/108106 TRENDMAESTRO ver 2.4 TRENDMAESTRO recognizes a new TREND in the bud, he never makes mistakes. The certainty of identifying a new TREND is priceless. DESCRIPTION TRENDMAESTRO identifies a new TREND in the bud, this indicator examines the volatility, volumes and momentum to identify the moment in which there is an explosion of one or more of these data a
Golden Spikes Premium
Kwaku Bondzie Ghartey
Golden Spikes Detector Overview: The Golden Spikes Premium is a groundbreaking trading indicator meticulously crafted for the Boom and Crash indices on the Deriv market. Tailored to meet the needs of discerning traders, this powerful tool operates exclusively on the one-minute timeframe, providing timely and precise signals to maximize your trading potential. The Golden Spikes Detector stands out in its ability to deliver accurate signals, ensuring that you capitalize on market opportunities wit
Gartley Hunter Multi
Siarhei Vashchylka
5 (8)
Gartley Hunter Multi - An indicator for searching for harmonic patterns simultaneously on dozens of trading instruments and on all possible timeframes. Manual (Be sure to read before purchasing) | Version for MT4 Advantages 1. Patterns: Gartley, Butterfly, Shark, Crab. Bat, Alternate Bat, Deep Crab, Cypher 2. Simultaneous search for patterns on dozens of trading instruments and on all possible timeframes 3. Search for patterns of all possible sizes. From the smallest to the largest 4. A
Sind Sie es leid, Unterstützungs- und Widerstandslinien zu zeichnen? Der Unterstützungswiderstand ist ein Multi-Zeitrahmen-Indikator, der Unterstützungs- und Widerstandslinien mit einer sehr interessanten Wendung automatisch erkennt und zeichnet: Wenn das Preisniveau im Laufe der Zeit getestet wird und seine Bedeutung zunimmt, werden die Linien dicker und dunkler. [ Installationsanleitung | Update-Anleitung | Fehlerbehebung | FAQ | Alle Produkte ] Steigern Sie Ihre technische Analyse über Nacht
Matrix Arrow Indicator MT5
Juvenille Emperor Limited
5 (14)
Matrix Arrow Indicator MT5   ist ein einzigartiger 10-in-1-Trend, der zu   100 % nicht neu gezeichnet   werden kann. Multi-Timeframe-Indikator, der für alle Symbole/Instrumente verwendet werden kann:   Forex ,   Rohstoffe ,   Kryptowährungen ,   Indizes ,   Aktien .  Der  Matrix Arrow Indicator MT5  wird den aktuellen Trend in seinen frühen Stadien bestimmen und Informationen und Daten von bis zu 10 Standardindikatoren sammeln, die sind: Durchschnittlicher Richtungsbewegungsindex (ADX) Rohstoff
Volume by Price MT5
Brian Collard
3.6 (5)
The Volumebyprice.com Indicator for MetaTrader 5 features Volume Profile and Market Profile TPO (Time Price Opportunity). Volume and TPO histogram bar and line charts. Volume Footprint charts. TPO letter and block marker collapsed and split structure charts. Static, dynamic and flexible range segmentation and compositing methods with relative and absolute visualizations. Session hours filtering and segment concatenation with Market Watch and custom user specifications. Graphical layering, posit
ICT, SMC, SMART MONEY CONCEPTS, SMART MONEY, Smart Money Concept, Support and Resistance, Trend Analysis, Price Action, Market Structure, Order Blocks, BOS/CHoCH,   Breaker Blocks ,  Momentum Shift,   Supply&Demand Zone/Order Blocks , Strong Imbalance,   HH/LL/HL/LH,    Fair Value Gap, FVG,  Premium  &   Discount   Zones, Fibonacci Retracement, OTE, Buy Side Liquidity, Sell Side Liquidity, BSL/SSL Taken, Equal Highs & Lows, MTF Dashboard, Multiple Time Frame, BigBar, HTF OB, HTF Market Structure
Das Volatility Trend System ist ein Handelssystem, das Signale für Einstiege liefert. Das Volatilitätssystem liefert lineare und punktuelle Signale in Richtung des Trends sowie Signale zum Verlassen des Trends, ohne Neuzeichnung oder Verzögerungen. Der Trendindikator überwacht die Richtung des mittelfristigen Trends, zeigt die Richtung und deren Änderung an. Der Signalindikator basiert auf Änderungen der Volatilität und zeigt Markteintritte an. Der Indikator ist mit mehreren Arten von Warn
Blahtech Supply Demand MT5
Blahtech Limited
4.54 (13)
Was: $299  Now: $99   Supply Demand uses previous price action to identify potential imbalances between buyers and sellers. The key is to identify the better odds zones, not just the untouched ones. Blahtech Supply Demand indicator delivers functionality previously unavailable on any trading platform. This 4-in-1 indicator not only highlights the higher probability zones using a multi-criteria strength engine, but also combines it with multi-timeframe trend analysis, previously confirmed swings
Gold TMAF MTF - dies ist ein bester technischer Indikator für Aktien. Der Algorithmus des Indikators analysiert die Preisbewegung eines Vermögenswertes und spiegelt die Volatilität und potenzielle Einstiegszonen wider. Die besten Indikatorsignale: - Für VERKAUF = rote obere Begrenzung von TMA2 über der roten oberen Begrenzung von TMA1 + roter Fraktalindikator oben + gelber SR-Signalpfeil in die gleiche Richtung. - Für KAUFEN = blaue untere Grenze von TMA2 unterhalb der blauen unteren Gr
Automated Trendlines MT5
Georgios Kalomoiropoulos
Trendlinien sind das wichtigste Werkzeug der technischen Analyse im Devisenhandel. Leider zeichnen die meisten Händler sie nicht richtig. Der automatische Trendlinien-Indikator ist ein professionelles Tool für ernsthafte Trader, das Ihnen hilft, die Trendbewegung der Märkte zu visualisieren. Es gibt zwei Arten von Trendlinien Bullische Trendlinien und Bärische Trendlinien. Im Aufwärtstrend wird die Forex-Trendlinie durch die niedrigsten Swing-Punkte der Preisbewegung gezogen. Wenn man m
Der Forex TPA Indikator deckt die wahren Aktionen der Marktmacher auf, immer dann wenn sie passieren. "Kämpfe nicht gegen die Marktmacher an, sondern folge ihnen", ist wohl der beste Rat, den ein Trader bekommen kann. Der TPA Indikator zeigt jedesmal seine Signale an wenn die Bullen definitiv stärker sind als die Bären und umgekehrt. Dieser Indikator wurde VON Tradern FÜR Trader gemacht und ist 100% NICHT NACHZEICHNEND! Signale werden STRENG am Schluss einer Kerze  generiert. Das sagen unsere Ku
** All Symbols x All Timeframes scan just by pressing scanner button ** ***Contact me after purchase to send you instructions and add you in "123 scanner group" for sharing or seeing experiences with other users. After 17 years of experience in the markets and programming, Winner indicator is ready. I would like to share with you! Introduction The 123 Pattern Scanner indicator with a special enhanced algorithm is a very repetitive common pattern finder with a high success rate . Interestingly,
Auto Order Block with break of structure based on ICT and Smart Money Concepts (SMC) Futures Break of Structure ( BoS )             Order block ( OB )            Higher time frame Order block / Point of Interest ( POI )    shown on current chart           Fair value Gap ( FVG ) / Imbalance   -  MTF      ( Multi Time Frame )    HH/LL/HL/LH  -  MTF      ( Multi Time Frame )  Choch  MTF      ( Multi Time Frame )  Volume Imbalance     ,  MTF          vIMB Gap’s Power of 3 Equal High
Weitere Produkte dieses Autors
SuperTrend for MT5
Ulises Calderon Bautista
5 (3)
Der beliebte "SuperTrend" Indikator ist ein technisches Analysetool, das hilft, die Richtung eines Trends und mögliche Ein- oder Ausstiegspunkte auf den Finanzmärkten zu identifizieren. Der Indikator basiert auf der Average True Range (ATR), die die Marktvolatilität basierend auf Preisspannen misst. Er ist auf anderen Plattformen kostenlos verfügbar, und hier sollte keine Ausnahme gemacht werden! Er wird in der Regel auf drei Arten verwendet: Um den aktuellen Trend zu identifizieren: Wenn der Pr
FREE
Der Exponential Moving Averages (Double oder Triple) Envelopes Indicator ist ein technisches Analysewerkzeug, das Ihnen dabei hilft, Trends und potenzielle Umkehrpunkte auf dem Finanzmarkt zu identifizieren. Dieser Indikator bietet den Händlern die Flexibilität, zwischen zwei Arten von exponentiellen gleitenden Durchschnitten zu wählen: dem Double Exponential Moving Average (DEMA) oder dem Triple Exponential Moving Average (TEMA). Hauptmerkmale: - Doppel- oder Dreifach-Exponentiell: Wechse
FREE
Correlated MT5
Ulises Calderon Bautista
Correlation occurs when the price of two or more currency pairs move together. Being positive correlation, where prices move in the same direction or negative correlation, where they move in opposite directions. As a trader, it's important to understand that relation, as it can unconsciously affect your account's risk exposure. Correlated is an Expert Advisor that identifies and takes advantage of divergent movements in strongly correlated currency pairs. It also shows a table of yields, stan
Auswahl:
Keine Bewertungen
Antwort auf eine Rezension