• Visão global
  • Comentários
  • Discussão

Envelope of Adaptive Moving Average

O indicador "Envelope of Adaptive Moving Average" é uma ferramenta que o ajudará a tomar decisões informadas no mercado financeiro. Ele foi projetado para fornecer uma visão clara da direção da tendência e dos possíveis pontos de entrada e saída em suas negociações.

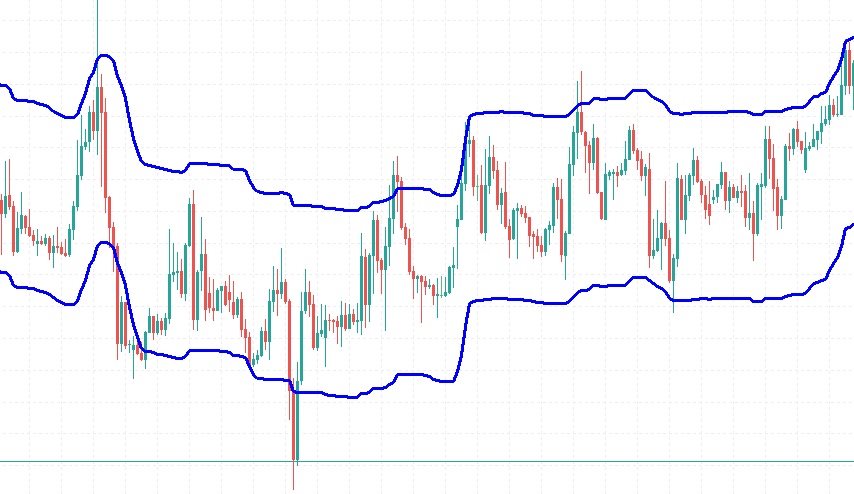
Este indicador é baseado em uma média móvel adaptativa, o que significa que ele se ajusta automaticamente às mudanças na volatilidade do mercado. Isso o torna especialmente útil em mercados que podem ser tanto calmos quanto voláteis. O indicador exibe duas linhas que envolvem a média móvel adaptativa. Essas linhas ajudam a identificar níveis-chave de suporte e resistência, permitindo que você tome decisões mais informadas sobre quando comprar ou vender um ativo.

Apesar de ser uma ferramenta técnica avançada, é fácil de entender e usar, tornando-o adequado tanto para traders iniciantes quanto experientes. A capacidade do indicador de se adaptar às condições de mercado em constante mudança o torna versátil e eficaz em diferentes situações. Ele fornece uma representação visual clara das tendências de mercado, ajudando a evitar negociações impulsivas. Este indicador pode ser uma ferramenta valiosa em sua caixa de ferramentas de negociação.
Produtos recomendados
Nyse Usdxy
Mitchell Dean Ede
Displays a USD DXY chart in a seperate window below the main chart. YOUR BROKER MUST HAVE THESE SYMBOLS FOR THE INDICATOR TO WORK Based on EUR/USD, USD/JPY, GBP/USD, USD/CAD, USD/CHF and USD/SEK All these pairs must be added to Market Watch for the indicator to work correctly As this is calculated using a formula based on the 6 pairs it will only work when the market is open. YOUR BROKER MUST HAVE THESE SYMBOLS FOR THE INDICATOR TO WORK Displays a USD DXY chart in a seperate window below the
FREE
Strong Move
Triet Lam Minh
This indicator combines RSI(14) and ADX(14) to find out the signal that price moves strongly. When it appears signal (represent by the yellow dot), and price is going down, let consider to open a SELL order. Otherwise, let consider to open a BUY order. In this case, the strength of moving is strong (normally after sideway period), so  we can set TP by 3 times of SL  . 
FREE
IQuantum
Evgeniy Scherbina
The indicator IQuantum shows trading signals for 10 symbols in the daily chart: AUDCAD, AUDUSD, EURUSD, GBPCAD, GBPCHF, GBPUSD, NZDUSD, USDCAD, USDCHF, and USDJPY. Signals of the indicator are produced by 2 neural models which were trained independently from one another. The inputs for the neural models are normalised prices of the symbols, as well as prices of Gold, Silver and markers of the current day. Each neural model was trained in 2 ways. The Ultimate mode is an overfitted neural mo
FREE
Range Box or Initial Balance
Cristian Mateo Duque Ocampo
5 (1)
The initial balance (IB) is a range in which the price spent its first two OPT periods after the opening. In other words, the opening balance is a range of the first hour after the market opened. The opening balance arose from room trading, as room traders observed the various ranges after the market opened. This indicator allows you to enter the starting and ending hours and minutes of a specific hourly time range so that the trader can set up different IBs according to the market. Autom
FREE
Hello, This indicator is a unique high reliability 7-in-1 multicurrency indicator comprising these sub-indicator’s: A Trend Power Crossover Indicator. A Percent Change Crossover Indicator. A Currency Overbought/Oversold Indicator. A Currency Deviation Indicator. A Currency Impulse Signal Indicator. A Trend Power Indicator. A Currency Volatility Indicator. The main advantage of this indicator is that it's reasoning by currency and not by currency pair. The values of each sub-indicator are calcula
FREE
VolumesWithMedia
Jonathan Pereira
5 (1)
O Volume é um indicador muito utilizado em análise técnica, no entanto existe uma variação que é ainda mais útil do que o Volume por si só: a média móvel do Volume. Ele nada mais é do que uma média móvel aplicada ao popular indicador de Volume. Como já diz o nome, o Volume + MA serve para exibir o volume transacionado (compras e vendas executadas) de certo ativo financeiro em determinado ponto do tempo juntamente com a média móvel desse mesmo volume ao longo do tempo. Para que serve? Com
FREE
Free version of  https://www.mql5.com/en/market/product/44815 Simple indicator to calculate profit on fibonacci retracement levels with fixed lot size, or calculate lot size on fibonacci levels with fixed profit. Add to chart and move trend line to set the fibonacci retracement levels. Works similar as default fibonacci retracement line study in Metatrader. Inputs Fixed - select what value will be fix, lot or profit  (available in full version, lot is set on free version) Fixed value - value tha
FREE
Dark Bands MT5
Marco Solito
4.88 (234)
Dark Bands   is an Indicator for intraday trading. This Indicator is based on Counter Trend  strategy but use also Volatility. We can enter in good price with this Indicator, in order to follow the inversions on the current instrument. Key benefits Easily visible take profit/stop loss lines Reliable bands lines with futuristic colors, and  Intuitive directional arrows Useful statistics , which indicate the win rate of the signals Plus Package  available, leave a feedback to receive it for
FREE
TilsonT3
Jonathan Pereira
A média móvel Tillson's T3 foi apresentada ao mundo da análise técnica no artigo ''A Better Moving Average'', publicado na revista americana   Technical   Analysis of Stock Commodities . Desenvolvida por Tim Tillson, logo os analistas e operadores de mercados futuros ficaram fascinados com esta técnica que suaviza a série de preços ao mesmo tempo em que   diminui o lag (atraso)   típicos dos sistemas seguidores de tendências.
FREE
Trend Strength Analyzer
Andrey Sorokin
4.83 (6)
The technical indicator Trend Strength Analyzer measures the deviation of the price of an instrument from average values ​​over a specific period of time. A comparative analysis of the relative strength of bulls and bears underlies the indicator. If bulls prevail, an upward trend. If bears are stronger - a downward trend.      Settings: Strike Energy (2 solid lines) = 14. Influence Power (2 dotted lines) = 50. The TSA oscillator is effective in an active market. The most commonly used indica
FREE
Reversal Composite Candles
MetaQuotes Ltd.
3.5 (24)
A ideia do sistema é a identificação de padrões de reversão utilizando o cálculo de candles compostos. Os padrões de reversão são semelhantes aos padrões "Martelo" e o " Homem Enforcado " da análise candlestick Japonesa, porém ele usa candles compostos em vez de uma única barra e não precisa do pequeno corpo numa composição para confirmar a reversão. Os parâmetros de entrada: Range - número máximo de barras, utilizada no cálculo de composição dos candles compostos . Minimum - tamanho mínimo d
FREE
This indicator uses a different approach from the previous version to get it's trendlines. This method is derived from Orchard Forex, and the process of making the indicator is demonstrated in there video   https://www.youtube.com/watch?v=mEaiurw56wY&t=1425s . The basic idea behind this indicator is it draws a   tangent line   on the highest levels and lowest levels of the bars used for calculation, while ensuring that the lines don't intersect with the bars in review (alittle confusing? I kno
FREE
This utility is the demo version of the Binance Full Trader. This version is provided so the customers can test performance and options of the main version. ·        This version has these restrictions: 1.        Only BTCUSDT is available for price chart and Test Mode. 2.         The Real Mode is not accessible. 3.        The LIMIT and STOPLOSSLIMIT are not accessible. 4.       The Indicator mode is not accessible.   ·        The full version and the instruction of use can be downloadable from t
FREE
Breakout MV
Emmanouil Bampalos
Breakout MV :  This Expert Advisor offers you one of the most fundamental trading strategy,  combining Moving Average and Volums indicators!  Key Features : Consistent Performance : Breakout strategy has demonstrated a robust performance across various market conditions, by capitalizing on significant price movements. Strategic Trade Execution : We select the desired range, and once the price approaches these levels and the indicators confirm our entry, we open a trade. The trade will close ei
FREE
Middle of daily range
Raphael Gil Abreu De Oliveira
Um indicador simples e eficiente que plota e atualiza o 50% do dia atual, para aqueles que usam esse ponto como referência no day trade. Em dias de tendência a região de 50% tende a ser um bom ponto de resitência, ideal para realizar novas entradas. Já nos dias sem tendência (laterais) a região do 50% é ótima para realizar as posições. Além disso, para critérios de estudo ou back-testing você pode definir a quantidades de dias anteriores a serem plotados pelo indicador. Para dúvidas ou sugestões
FREE
Ichimoku Trend Alert is the Ichimoku Kinko Hyo indicator with Alerts and signal filters. Ichimoku Trend Alert features: Optional check of Ichimoku cloud, Tenkan sen(Conversion Line), Kijun sen(Base Line), Senkou span A, Senkou span B, and Chikou span relative to price, and more. Popup, email, and phone notification alerts for selected symbols and timeframes. There are 9 classic Ichimoku trend filters you can enable/disable in settings: Price/Cloud Order:   Checks the price position relative
FREE
RSI vs SMA Indicator
Asanka Priyasad Peiris Dadigamuwage
Special Offer ... It is totally free for all. New one coming soon................... About This Indicator: RSI vs SMA Indicator: A Comprehensive Technical Analysis Tool for Better for Identify the Short and Long Signals. The RSI vs SMA Indicator is a powerful technical analysis tool designed to understanding Market Price Fluctuation for Long or Short signals. This user-friendly Indicator good for both novice and experienced traders, providing valuable indication in price chart and separate wi
FREE
** This is the short version of Symbol Changer . You might want to refer to full version with further features. Symbol Chart Changer   is an indicator/utility that offers you the option to switch between symbols and timeframes. You can choose any symbol and timeframe on the same chart with just a few clicks.  In addition, this indicator also shows the profit of the symbol through the color of the buttons. For MT4:   Symbol Chart Changer Features All symbols selected in MarketWatch, that allow y
FREE
This EA is named Dinosaur Hunter(DH) because it can capture very large trend, such as 5000-10000 pips. DH trades infrequently as it patiently waits for the right market conditions. DH can load multiple currency pairs on a single chart to increase the number of trades. Live Signal This is a demo version that only for fixed lot size of 0.01. To obtain the full version, please purchase Dinosaur Hunter Pro . This EA has been tested from 2015 to the present. The test used data from Dukascopy. If
FREE
Show Pips for MT5
Roman Podpora
4.63 (19)
Este indicador de informação será útil para quem quer estar sempre atento à situação atual da conta. -   Indicadores mais úteis O indicador exibe dados como lucro em pontos, porcentagem e moeda, bem como o spread do par atual e o tempo até o fechamento da barra no período atual. Existem várias opções para colocar a linha de informação no gráfico: À direita do preço (corre atrás do preço); Como comentário (no canto superior esquerdo do gráfico); No canto selecionado da tela. Também é possível
FREE
O Matrix Arrow Indicator Multi Timeframe Panel MT5 é um complemento gratuito e um grande trunfo para o seu Matrix Arrow Indicator MT5 . Ele mostra o sinal atual do Matrix Arrow Indicator MT5 para 5 intervalos de tempo personalizados pelo usuário e para 16 símbolos / instrumentos modificáveis ​​no total. O usuário tem a opção de habilitar / desabilitar qualquer um dos 10 indicadores padrão, que compõem o Indicador de Seta de Matriz MT5 . Todos os atributos dos 10 indicadores padrão também são aj
FREE
Estratégia de negociação MACD O cálculo do MACD é executado uma vez a cada tick, e são considerados para fim de cálculo os três últimos resultados, para analisar o cruzamento da linha de zero, ou seja quando o último resultado for maior que 0 e o antepenúltimo não então há um cruzamento para cima e analogamente para baixo, quando um cruzamento é constatado o estado de uma variável de controle é alterado de "false" para "true", permitindo o abertura de uma posição caso a média de sinal também cru
FREE
SyntheticaFX Power
Hendrik Lodewyk Coetsee
The "SyntheticaFX Power Indicator" is an exceptional trading tool designed to offer valuable insights into market strength and potential changes, without revealing its proprietary methodology. This powerful indicator is ideally utilized in conjunction with our specialized tools, the " SyntheticaFX CrashSlayer and " BoomSlayer " Spike Indicators, to provide traders and investors with a comprehensive and dynamic trading experience. When employed alongside our SyntheticaFX CrashSlayer and BoomSlaye
FREE
Este Expert Advisor serve para mandar mensagens do indicador PCT Multi para o Telegram. O EA possui 5 configurações: - Nome do canal: O nome do canal do Telegram. - Token: O Token do seu bot. - Entradas: Se enviará mensagens de entradas. - Resultados: Se enviará resultados de entradas. - Alertas: Se enviará alertas. Como utilizar: No menu Ferramentas -> Opções, na aba "Expert Advisors": - Marque a opção "Relacione no quadro abaixo as URL(...)". - Clique em "adicionar nova URL" e adicione " h
FREE
Didi Index TSB
Sonia Tait
4.33 (3)
O indicador criado por Didi Aguiar, o mestre das Agulhadas! O padrão do indicador é o cruzamento de três médias móveis simples. Média rápida, período 3. Média normalizada, período 8. Média lenta, período 20. Quando as três médias se cruzam próximas o suficiente, acontece a agulhada! Pela posição das médias é possível identificar: Agulhada de compra, agulhada de venda, ponto falso e beijo da mulher aranha. Quer saber mais? Procure pelo site dos robôs oficiais da Dojistar: tradesystembots.co
FREE
Mirrorized Moving Averages
Mahmoud Sabry Mohamed Youssef
5 (6)
I always wondered if I can have multiple time frame Moving average on same chart , it is not possible , now with my Indicator is possible , As you know Moving average is lagging not leading indicator , but how can I predict future levels of it ? I came with this idea , I hope you will like it , I made a Mirror of Moving average , the other side of specific time will be shown in the other side of the chart where the price didnt reach yet , that will help you to know the levels you can start sel
FREE
O indicador ROMAN5 Time Breakout desenha automaticamente caixas de suporte e resistência diárias para rompimentos. Ajuda o usuário a identificar o momento de comprar ou vender. Vem com um alerta sonoro sempre que um novo sinal aparece. Ele também possui a facilidade de enviar e-mail. O seu endereço de e-mail e configurações do servidor SMTP devem ser especificados na janela de configurações do guia "Email" no seu MetaTrader 5. Seta para cima azul = Comprar Seta para baixo vermelha = Vender. Você
FREE
Color Trend
Bruno Goncalves Mascarenhas
Combinando o melhor de  Price Action ,  Movimento Direcional , e análise de  Divergência/Convergência , o indicador  Candle Color Trend  is é uma forma fácil e confiável de identificar a direção da tendência. O indicador automaticamente pinta os candles de acordo com a premissa de que a tendência de alta é definida por preços que formam uma série de topos e fundos ascendentes. Por outro lado, a tendência de baixa é definido por preços que formam uma série de topos e fundos descendentes. Color
FREE
SSL Alerts
Luis Enrique Ricales
================         // Average period                      ma_Sma,                               // Simple moving average          ma_Ema,                               // Exponential moving average          ma_Smma,                              // Smoothed MA          ma_Lwma                               // Linear weighted MA ===============   // Average method       // Turn alerts on?       // Alert on current bar?      // Display messageas on alerts?        // Play sound on alerts?    
FREE
Os compradores deste produto também adquirem
Atomic Analyst MT5
Issam Kassas
4.79 (19)
Primeiramente, vale ressaltar que este Indicador de Negociação não repinta, não redesenha e não apresenta atrasos, tornando-o ideal tanto para negociação manual quanto automatizada. Manual do utilizador: configurações, entradas e estratégia. O Analista Atômico é um Indicador de Ação de Preço PA que utiliza a força e o momentum do preço para encontrar uma vantagem melhor no mercado. Equipado com filtros avançados que ajudam a remover ruídos e sinais falsos, e aumentam o potencial de negociação.
Atbot
Zaha Feiz
4.96 (28)
AtBot: Como funciona e como usá-lo ### Como funciona O indicador "AtBot" para a plataforma MT5 gera sinais de compra e venda usando uma combinação de ferramentas de análise técnica. Ele integra a Média Móvel Simples (SMA), a Média Móvel Exponencial (EMA) e o índice de Faixa Verdadeira Média (ATR) para identificar oportunidades de negociação. Além disso, pode utilizar velas Heikin Ashi para melhorar a precisão dos sinais. Deixe uma avaliação após a compra e receba um presente especial. ### Princ
Primeiramente, vale ressaltar que este Sistema de Trading é um Indicador Não Repintado, Não Redesenho e Não Atrasado, o que o torna ideal tanto para o trading manual quanto para o automatizado. Curso online, manual e download de predefinições. O "Sistema de Trading Inteligente MT5" é uma solução completa de trading projetada para traders novos e experientes. Ele combina mais de 10 indicadores premium e apresenta mais de 7 estratégias de trading robustas, tornando-o uma escolha versátil para dive
Gold Stuff mt5
Vasiliy Strukov
4.9 (185)
Gold Stuff mt5-um indicador de tendência projetado especificamente para o ouro, também pode ser usado em qualquer instrumento financeiro. O indicador não é redesenhado ou atrasado. O timeframe recomendado é H1. Importante! Entre em contato comigo imediatamente após a compra para obter instruções e bônus!  Você pode obter uma cópia gratuita do nosso indicador Strong Support e Trend Scanner, envie uma mensagem privada. a mim! PARÂMETRO Draw Arrow-incl.desligado. desenhar setas no gráfico. A
TPSproTREND PrO MT5
Roman Podpora
4.89 (9)
TPSpro TREND PRO  - is a trend indicator that automatically analyzes the market and provides information about the trend and each of its changes, as well as giving signals for entering trades without redrawing! The indicator uses each candle, analyzing them separately. referring to different impulses - up or down impulse. Exact entry points into transactions for currencies, crypto, metals, stocks, indices!  Version MT4               DETAILED DESCRIPTION               R ecommended to use with an
TPSpro RFI Levels MT5
Roman Podpora
4.67 (9)
Reversal First Impulse levels (RFI)      INSTRUCTIONS        RUS       -       ENG              R ecommended to use with an indicator   -   TPSpro  TREND PRO -  Version MT4                 A key element in trading is zones or levels from which decisions to buy or sell a trading instrument are made. Despite attempts by major players to conceal their presence in the market, they inevitably leave traces. Our task was to learn how to identify these traces and interpret them correctly. Main functi
Este é um indicador para MT5 que fornece sinais precisos para entrar em uma negociação sem redesenhar. Ele pode ser aplicado a qualquer ativo financeiro: forex, criptomoedas, metais, ações, índices. Ele fornecerá estimativas bastante precisas e informará quando é melhor abrir e fechar um negócio. Assista o vídeo (6:22) com um exemplo de processamento de apenas um sinal que compensou o indicador! A maioria dos traders melhora seus resultados de negociação durante a primeira semana de negociação c
Antes de tudo, vale ressaltar que esta Ferramenta de Negociação é um Indicador Não Repintante, Não Redesenhante e Não Atrasado, o que a torna ideal para negociação profissional. Curso online, manual do utilizador e demonstração. O Indicador de Conceitos de Ação de Preço Inteligente é uma ferramenta muito poderosa tanto para traders novos quanto experientes. Ele combina mais de 20 indicadores úteis em um único, combinando ideias avançadas de negociação como Análise do Trader do Círculo Intern
Quantum Trend Sniper
Bogdan Ion Puscasu
4.92 (48)
Apresentando       Quantum Trend Sniper Indicator   , o inovador Indicador MQL5 que está transformando a maneira como você identifica e negocia as reversões de tendência! Desenvolvido por uma equipe de traders experientes com experiência comercial de mais de 13 anos,       Indicador de Atirador de Tendência Quântica       foi projetado para impulsionar sua jornada de negociação a novos patamares com sua forma inovadora de identificar reversões de tendência com precisão extremamente alta. ***C
Trend Screener Pro MT5
STE S.S.COMPANY
4.88 (67)
Desbloqueie o poder da negociação de tendências com o indicador Trend Screener: sua solução definitiva de negociação de tendências, alimentada por lógica difusa e sistema de múltiplas moedas! Eleve sua negociação de tendências com o Trend Screener, o revolucionário indicador de tendências alimentado por lógica difusa. É um poderoso indicador de acompanhamento de tendências que combina mais de 13 ferramentas e recursos premium e 3 estratégias de negociação, tornando-o uma escolha versátil para to
FX Power MT5 NG
Daniel Stein
5 (6)
Receba a sua atualização diária do mercado com detalhes e screenshots através do nosso Morning Briefing aqui no mql5 e no Telegram ! O FX Power MT5 NG é a próxima geração do nosso medidor de força de moeda muito popular de longa data, o FX Power. E o que é que este medidor de força da próxima geração oferece? Tudo o que adorou no FX Power original MAIS Análise de força GOLD/XAU Resultados de cálculo ainda mais precisos Períodos de análise configuráveis individualmente Limite de cálculo personal
FX Volume MT5
Daniel Stein
4.94 (17)
Receba a sua atualização diária do mercado com detalhes e screenshots através do nosso Morning Briefing aqui no mql5 e no Telegram ! O Volume FX é o PRIMEIRO e ÚNICO indicador de volume que fornece uma visão REAL do sentimento do mercado do ponto de vista de um corretor. Ele fornece uma visão incrível de como os participantes do mercado institucional, como corretores, estão posicionados no mercado Forex, muito mais rápido do que os relatórios COT. Ver essas informações diretamente no seu gráfi
IX Power MT5
Daniel Stein
4.17 (6)
O   IX Power   traz finalmente a precisão imbatível do FX Power para símbolos não-Forex. Determina com exatidão a intensidade das tendências a curto, médio e longo prazo nos seus índices, acções, mercadorias, ETFs e até criptomoedas favoritos. Pode   analisar tudo o que   o seu terminal tem para oferecer. Experimente e veja como   o seu timing melhora significativamente   quando negoceia. Características principais do IX Power Resultados de cálculo 100% precisos e sem repintura - para tod
XQ Indicator MetaTrader 5
Marzena Maria Szmit
3.5 (2)
Step into the realm of Forex trading with confidence and precision using XQ, a cutting-edge Forex indicator designed to elevate your trading game to unprecedented heights. Whether you're a seasoned trader or just stepping into the world of currency exchange, XQ Forex Indicator empowers you with the insights and signals needed to make informed trading decisions. The signal conditions are a combination of three indicators, and XQ Forex Indicator only display  medium and long-term trends . The ind
Easy By Sell is a market indicator for opening and closing positions. It becomes easy to track market entries with alerts. It indicates trend reversal points when a price reaches extreme values ​​and the most favorable time to enter the market. it is as effective as a Fibonacci to find a level but it uses different tools such as an algorithm based on ATR indicators and Stochastic Oscillator. You can modify these two parameters as you wish to adapt the settings to the desired period. My othe
Este painel mostra os últimos   padrões harmónicos   disponíveis para os símbolos seleccionados, pelo que poupará tempo e será mais eficiente /   versão MT4 . Indicador gratuito:   Basic Harmonic Pattern Colunas do indicador Symbol :   aparecem os símbolos seleccionados Trend :   de alta ou de baixa Pattern :   tipo de padrão (gartley, borboleta, morcego, caranguejo, tubarão, cifra ou ABCD) Entry :   preço de entrada SL:   preço de paragem de perda TP1:   preço do 1º take profit TP2:   preç
TrendMaestro5
Stefano Frisetti
note: this indicator is for METATRADER4, if you want the version for METATRADER5 this is the link:  https://www.mql5.com/it/market/product/108106 TRENDMAESTRO ver 2.4 TRENDMAESTRO recognizes a new TREND in the bud, he never makes mistakes. The certainty of identifying a new TREND is priceless. DESCRIPTION TRENDMAESTRO identifies a new TREND in the bud, this indicator examines the volatility, volumes and momentum to identify the moment in which there is an explosion of one or more of these data a
Golden Spikes Premium
Kwaku Bondzie Ghartey
Golden Spikes Detector Overview: The Golden Spikes Premium is a groundbreaking trading indicator meticulously crafted for the Boom and Crash indices on the Deriv market. Tailored to meet the needs of discerning traders, this powerful tool operates exclusively on the one-minute timeframe, providing timely and precise signals to maximize your trading potential. The Golden Spikes Detector stands out in its ability to deliver accurate signals, ensuring that you capitalize on market opportunities wit
Gartley Hunter Multi
Siarhei Vashchylka
5 (8)
Gartley Hunter Multi - An indicator for searching for harmonic patterns simultaneously on dozens of trading instruments and on all possible timeframes. Manual (Be sure to read before purchasing) | Version for MT4 Advantages 1. Patterns: Gartley, Butterfly, Shark, Crab. Bat, Alternate Bat, Deep Crab, Cypher 2. Simultaneous search for patterns on dozens of trading instruments and on all possible timeframes 3. Search for patterns of all possible sizes. From the smallest to the largest 4. A
Cansado de traçar linhas de suporte e resistência? A Resistência de suporte é um indicador de período múltiplo que detecta e plota automaticamente linhas de suporte e resistência no gráfico com um toque muito interessante: conforme os níveis de preços são testados ao longo do tempo e sua importância aumenta, as linhas se tornam mais espessas e mais escuras. [ Guia de instalação | Guia de atualização | Solução de problemas | FAQ | Todos os produtos ] Melhore sua análise técnica da noite para o d
Matrix Arrow Indicator MT5
Juvenille Emperor Limited
5 (14)
O   Matrix Arrow Indicator MT5   é uma tendência única 10 em 1 seguindo um indicador multi-timeframe   100% sem repintura   que pode ser usado em todos os símbolos/instrumentos:   forex ,   commodities ,   criptomoedas ,   índices ,   ações .  O  Matrix Arrow Indicator MT5  determinará a tendência atual em seus estágios iniciais, reunindo informações e dados de até 10 indicadores padrão, que são: Índice de movimento direcional médio (ADX) Índice de canal de commodities (CCI) Velas clássicas de
Volume by Price MT5
Brian Collard
3.6 (5)
The Volumebyprice.com Indicator for MetaTrader 5 features Volume Profile and Market Profile TPO (Time Price Opportunity). Volume and TPO histogram bar and line charts. Volume Footprint charts. TPO letter and block marker collapsed and split structure charts. Static, dynamic and flexible range segmentation and compositing methods with relative and absolute visualizations. Session hours filtering and segment concatenation with Market Watch and custom user specifications. Graphical layering, posit
ICT, SMC, SMART MONEY CONCEPTS, SMART MONEY, Smart Money Concept, Support and Resistance, Trend Analysis, Price Action, Market Structure, Order Blocks, BOS/CHoCH,   Breaker Blocks ,  Momentum Shift,   Supply&Demand Zone/Order Blocks , Strong Imbalance,   HH/LL/HL/LH,    Fair Value Gap, FVG,  Premium  &   Discount   Zones, Fibonacci Retracement, OTE, Buy Side Liquidity, Sell Side Liquidity, BSL/SSL Taken, Equal Highs & Lows, MTF Dashboard, Multiple Time Frame, BigBar, HTF OB, HTF Market Structure
Volatility Trend System - é um sistema de negociação que fornece sinais para entradas. O sistema de volatilidade fornece sinais lineares e pontuais na direção da tendência, bem como sinais para sair dela, sem redesenhar ou atrasos. O indicador de tendência monitora a direção da tendência de médio prazo, mostra a direção e sua mudança. O indicador de sinal é baseado em mudanças na volatilidade e mostra as entradas no mercado. O indicador está equipado com diversos tipos de alertas. Pode se
Blahtech Supply Demand MT5
Blahtech Limited
4.54 (13)
Was: $299  Now: $99   Supply Demand uses previous price action to identify potential imbalances between buyers and sellers. The key is to identify the better odds zones, not just the untouched ones. Blahtech Supply Demand indicator delivers functionality previously unavailable on any trading platform. This 4-in-1 indicator not only highlights the higher probability zones using a multi-criteria strength engine, but also combines it with multi-timeframe trend analysis, previously confirmed swings
Gold TMAF MTF - este é o melhor indicador técnico de acções. O algoritmo do indicador analisa o movimento do preço de um ativo e reflecte a volatilidade e as potenciais zonas de entrada. Os melhores sinais do indicador: - Para VENDER = limite superior vermelho da TMA2 acima do limite superior vermelho da TMA1 + indicador fractal vermelho acima + seta de sinal SR amarela na mesma direção. - Para COMPRAR = limite inferior azul da TMA2 abaixo do limite inferior azul da TMA1 + indicador fra
Automated Trendlines MT5
Georgios Kalomoiropoulos
As linhas de tendência são a ferramenta mais essencial de análise técnica na negociação forex. Infelizmente, a maioria dos traders não os desenha corretamente. O indicador Automated Trendlines é uma ferramenta profissional para traders sérios que o ajudam a visualizar o movimento de tendências dos mercados. Existem dois tipos de Trendlines Bullish Trendlines e Bearish Trendlines. Na tendência de alta, a linha de tendência Forex é desenhada através dos pontos de oscilação mais baixos do m
TPA True Price Action indicator reveals the true price action of the market makers through 100% non-repainting signals strictly at the close of a candle! TPA shows entries and re-entries, every time the bulls are definitely stronger than the bears and vice versa. Not to confuse with red/green candles. The shift of power gets confirmed at the earliest stage and is ONE exit strategy of several. There are available now two free parts of the TPA User Guide for our customers. The first "The Basics"
** All Symbols x All Timeframes scan just by pressing scanner button ** ***Contact me after purchase to send you instructions and add you in "123 scanner group" for sharing or seeing experiences with other users. After 17 years of experience in the markets and programming, Winner indicator is ready. I would like to share with you! Introduction The 123 Pattern Scanner indicator with a special enhanced algorithm is a very repetitive common pattern finder with a high success rate . Interestingly,
Auto Order Block with break of structure based on ICT and Smart Money Concepts (SMC) Futures Break of Structure ( BoS )             Order block ( OB )            Higher time frame Order block / Point of Interest ( POI )    shown on current chart           Fair value Gap ( FVG ) / Imbalance   -  MTF      ( Multi Time Frame )    HH/LL/HL/LH  -  MTF      ( Multi Time Frame )  Choch  MTF      ( Multi Time Frame )  Volume Imbalance     ,  MTF          vIMB Gap’s Power of 3 Equal High
Mais do autor
SuperTrend for MT5
Ulises Calderon Bautista
5 (3)
O popular indicador "SuperTrend" é uma ferramenta de análise técnica que ajuda a identificar a direção de uma tendência e possíveis pontos de entrada ou saída nos mercados financeiros. O indicador é baseado na Média do Intervalo Verdadeiro (ATR), que mede a volatilidade do mercado com base nos intervalos de preços. Ele é gratuito em outras plataformas e aqui não deve ser diferente! Ele é comumente usado de três maneiras: Para identificar a Tendência Atual: Quando o preço está acima dessa linha,
FREE
O Indicador de Médias Móveis Exponenciais (Duplas ou Triplas) Envelopes é uma ferramenta de análise técnica projetada para ajudá-lo a identificar tendências e possíveis pontos de reversão no mercado financeiro. Este indicador oferece aos traders a flexibilidade de escolher entre dois tipos de médias móveis exponenciais: a Média Móvel Exponencial Dupla (DEMA) ou a Média Móvel Exponencial Tripla (TEMA). Recursos Principais: Duplas ou Triplas Exponenciais: Alterne entre DEMA e TEMA com base em
FREE
Correlated MT5
Ulises Calderon Bautista
Correlation occurs when the price of two or more currency pairs move together. Being positive correlation, where prices move in the same direction or negative correlation, where they move in opposite directions. As a trader, it's important to understand that relation, as it can unconsciously affect your account's risk exposure. Correlated is an Expert Advisor that identifies and takes advantage of divergent movements in strongly correlated currency pairs. It also shows a table of yields, stan
Filtro:
Sem comentários
Responder ao comentário