Kostenpflichtige Handelsroboter und Indikatoren für den MetaTrader 5 - 80
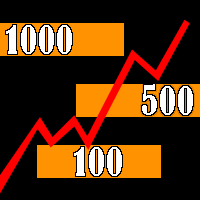
The indicator builds "psychological levels": levels of round numbers and intermediate levels of round numbers.
Round numbers play an important role in forming support and resistance levels. There is a pattern in which the decline or growth of the price can stop at round numbers.
The level whose price ends at 0 is the level of a round number of the first order. Intermediate level, this is the level between two round levels, for example, between 10 and 20 this is level 15.
In the " Num_Zero

MCDX is an indicator based on specific formula to detect Buy and Sell momentum Red Bar means Price go up and Buy momentum. Green Bar means Price go down and Sell momentum" Height of RED bar > 50% means Bull is in control. i.e. RED more than GREEN to go buy. Lower of Green bar < 50% means Bear is in control. i.e. GREEN more than RED to go sell. DARKER RED COLOR - STRONG Up Trend or Strong Bullish Power
LIGHTER RED COLOR - WEAK Up Trend or Weak Bullish Power
LIGHTER GREEN COLOR - STRONG Down

Quick Info - ein Informationsdienstprogramm zum Sammeln und Bereitstellen verschiedener nützlicher Informationen, die für den täglichen Handel an den Finanzmärkten benötigt werden, in bequemer Form für einen Händler. Alle nützlichen Informationen, die Sie benötigen, werden in einem separaten Fenster gesammelt und gruppiert. Auf der ersten Registerkarte finden Sie Handelsstatistiken für den ausgewählten Zeitraum. Um Handelsstatistiken zu sammeln, müssen Sie nur einen Zeitraum aus der Liste ausw
Fractal Plus is a trading tool in the form of an expert advisor. I n it there are 1 indicators that are position execution and 4 indicators that function as filters. You can choose whether each indicator is active or not, it can even be combined according to your trading needs. All filter indicators have multi timeframes options.
Indicators as execution position: 1. Fractal
4 Indicators as Filter: 1. Moving Averages 2. Stochastic Oscillator 3. RSI 4. Alligator
Parameter Information: - Lot

Description. This EA base on Accelerator oscillator indicator and Parabolic sar indicator. Accelerator oscillator details. set = iAC(_Symbol,_Period); Parabolic sar details. set = iSAR(_Symbol,_Period,0.02,0.2); This is only Buy EA. This EA fixed details in side. Only input is volume. Because i need to keep it simple. Buy order when Accelerator oscillator indicator and Parabolic sar indicator had a signal for buy. Close order when Accelerator oscillator indicator and Parabolic sar indicator had

https://www.mql4.com The price trend indicator
The price trend indicator accurately shows the changes in market prices , At the same time, this index also shows the future trend of the market price . The indicator does not redraw and does not lag. The recommended time frame is not less than H1 . When the market price is in the light green range, the market is in the rising range, and when the market price is in the light purple range, the market is in the falling range
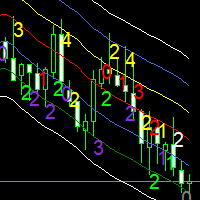
Gleitende Durchschnitte sind ein einfacher und seriöser Indikator für die Bewertung der Preisentwicklung. Aber welche Konfiguration soll man wählen? 12 Perioden? 20 Perioden? Es gibt nicht für alle Instrumente zu jeder Zeit und für alle Zeiträume einen einzigen gleitenden Durchschnitt, einfach weil nicht alle Instrumente die gleiche Volatilität aufweisen, sind sie alle sehr unterschiedlich. Sie haben eine Unterschrift. Die Signature App ist ein leistungsstarkes Tool zur Entscheidungsunterstützun
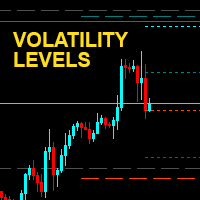
Transfer volatility levels to the chart to understand the nature of the ongoing movements. The levels are calculated based on the volatility recorded in the last few sessions. Easily identify possible targets or swing points for intraday , daily and weekly trading. In addition, the round price levels considered most important are also visible, here the highest trading volumes are usually concentrated. NO REPAINT
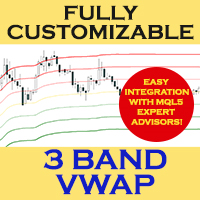
3-BAND VWAP (Volume Weighted Average Price)
Fully customized and EA-friendly VWAP Bands Indicator
MAIN FEATURES:
Choose the period of the VWAP calculation reset (Daily, Weekly or Monthly): For day trading use the Daily VWAP, and for longer term analysis use the Weekly or Monthly calculations.
Fine adjustment of the deviation of the bands: Find the best band’s deviation for the instruments you trade and adjust accordingly.
Customize line colors, style and width according to you

Capital protector MT5 is an Expert Advisor who works based on the profit and loss of your account. Its functions include: Closing of all orders when a certain profit or loss is reached. Remove any other Expert Advisor installed on a secondary chart when a certain profit or loss is reached. Send a notification to the mobile when a certain loss or profit is reached. To configure the Expert Advisor you will only have to program the loss limit that you are willing to lose or the profit limit that

This MT5 indicator, Bull Bear Visual MTF V2, summarize the strength color graphic and percentages of power for both Bull and Bear in current market emotion stage which will show you in multi timeframes (21) and sum of the total Bull and Bear power strength which is an important information for traders especially you can see all Bull and Bear power in visualized graphic easily, Hope it will be helpful tool for you for making a good decision in trading.

ADX is one of the most versatile indicators, understanding it can help you understand the true nature of movements. It is often used within automatic experts to filter input signals. Unfortunately in its original form it is not immediately understandable. This version aims to simplify its reading by transferring the burden of interpreting its values to the code. The result is a clear graph where it is easy to identify the accumulation and distribution phases, trend phases and excesses. The color
Сообщения в Telegram из MT5 о торговых событиях: Открытие/закрытие сделок; Выставление/удаление отложенных ордеров. Версия утилиты для MT4 здесь: https://mql5.com/8bjjy Настройки Telegram:
Создайте своего бота. Для этого напишите для пользователя @BotFather команду /newbot , и следуйте инструкциям. В результате вы получите Token бота, примерно такой: 1245680170:BBGuDFVkTYIPtjSaXMgQEhdfg7BOQ6rl8xI. Узнайте свой ID в Telegram, для этого напишите пользователю @userinfobot любое сообщение.

This MT5 indicator, Bull Bear Visual MTF (21 Time Frames), summarize the strength color graphic and percentages of power for both Bull and Bear in current market emotion stage which will show you in multi time frames and sum of the total Bull and Bear power strength which is an important information for traders especially you can see all Bull and Bear power in visualized graphic easily, Hope it will be helpful tool for you for making a good decision in trading.

TRADE CLOSER is an Expert Advisor which manage your manual trades. One click and all your manual trades are handled, the Expert Advisor doesn't trade. The Expert Adviser can : CLOSE ALL TRADES CLOSE PROFITABLE TRADES ONLY CLOSE LOSABLE TRADES ONLY CLOSE MOST PROFITABLE LOSABLE TRADES CLOSE PAIR ON PROFIT, you specify the amount and the target pair will close profit CLOSE ACCOUNT ON PROFIT, you specify the amount of all pairs on profit and account will close profit. Close all your trade

Описание индикатора будет крайне коротким. Индикатор Коридор тренда показывает трейдерам зону в которой находится валюта и даёт понимание по какому тренду движется рынок. Визуально очень хорошо воспринимается. Уровни взяты и просчитаны не просто. Полезный индикатор для арсенала индикаторов трейдера. The description of the indicator will be extremely short. The Trend Corridor indicator shows traders the zone in which the currency is located and gives an understanding of which trend the market is

Индикатор RSI MT5 - это индикатор Metatrader 5, и суть этого технического индикатора заключается в преобразовании накопленных исторических данных на основе индикатора RSI. Сигналы показаны разными цветами свечей. Смотрите настройки, тестируёте. Это очень полезный индикатор и он точно должен быть у вас . The RSI in candlelight MT5 indicator is a Metatrader 5 indicator, and the essence of this technical indicator is to transform the accumulated historical data based on the RSI indicator. Signals a

Deflection MT5 (MT4 version https://www.mql5.com/ru/market/product/63276 ) - a trend following expert advisor. It is based on strategy of searching entry points in the beginning of a trend. 2 EMA are used for a signal determination. Deflection has an adaptive system of profit and losses targets calculation which is based on current volatility. The control of risks is managed by TP/SL ratio and via setting risk per trade of a balance amount. Stop Loss and Take Profit targets in points are calc

Индикатор Trading Strategy призван помочь трейдерам в поиске оптимальных входов в сделку и выходов из неё. В его основе лежат показания технических индикаторов (MA, RSI, ATR и др.), а также авторский алгоритм, связывающий их сигналы в единое целое. Индикатор даёт сигналы на покупку и продажу в виде стрелочек: стрелочка вверх — сигнал на покупку, вниз — на продажу. В правом верхнем углу показаны сигналы индикатора на 6 таймфреймах (M1, M5, M15, M30, H1, H4) данной валютной пары. Индикатор свои з

The MA Bounce Strategy is a strategy that seeks to long FX pairs on a strong uptrend as they bounce off their MA support and shorting FX pairs on a strong downtrend as they bounce off MA resistance. The best suitable periods of moving averages for that strategy are 18, 30, 50. This indicator helps to identify and find place for potential market entry by MA bounce strategy. More information about MA Bounce Strategy can be read by this link https://www.mql5.com/en/blogs/post/743037 . By defau
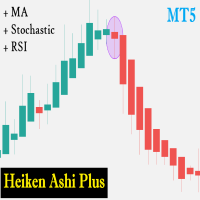
Heiken Ashi Plus is a trading tool in the form of an expert advisor. This EA works based on the change in the color of the Heiken Ashi candle. called a plus because there are additional indicators such as Moving Averages, Stochastic and RSI which you can combine its use with Heiken Ashi candles.
Update V2. = Add Multi TimeFrames Features
Explanation of EA parameters LotMethod : 1 = Fixed Lot, 2 = RiskLot (Freeze of Balance), 3 = Martingale System TrailingStart : Trailing will activated aft

The Better Volume indictator improves the comprehension on volume by coloring the classical histogram bars . The colors point out differents nature of volume .
The Better Volume OnOff allows to open/close the subwindow through a botton or using the keyboard only. There is the possibility to customize 3 symbols and assign them different parameters for each time frame .
The indicator improves the comprehension on volume by coloring the classical histogram bars : CLIMAX UP -
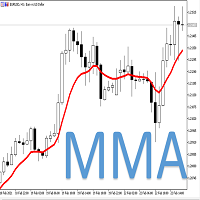
This system use M M A (Multipair Moving Average ) It is a multipair system, which uses the value of the averages in the majors to detect the entry points in the EURUSD.
!!!!!IMPORTANT!!!!! THIS EA IS FOR USED IN EURUSD ONLY. !!!!!IMPORTANT!!!!!
Only one operation at a time. It does not use hedging or marging systems, all operations have Stoplost, Take Profit and trailing stop, configurable. The system also allows you to configure the parameters of the averages that give us the entry and
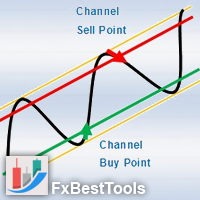
Channels Indicator is an All-In-One Indicator with a powerful calculation engine. The Indicator contains 4 different and usual methods for finding channels on the market. Indicator is powered by a visual interface and with various selections of alerts and notifications.
Testing Indicator : Strategy Tester does not respond to your clicks on panels (This is metatrader tester limitation). Thus input your desired settings on the indicator pre-settings and test.
Using Indicator :
Display

The Relative Strenght Index presented to the world in 1978 by J. Welles Wilder Jr. in his book " New Concepts in Technical Trading Systems " is widely used around the world in several ways, not only with the traditional approach of Overbought and Oversold states, which in several cases and depending on the assets and timeframes it just simply doesn't work anymore . BUT, this indicator has its value when used, for instance, looking for divergences between its measuring system and the Prices appea

This easy to setup indicator shows you the market volumes in a different way, with support and resistance as showed. You can setup: - Backdays volume to show - Heiken Ashi candle view It works for every kind of graph and every kind of period. The program shows the volumes based on the number of candles displayed in the chart: the more candles the more volumes. Enjoy this very useful indicator.
Please feel free to message me to report any kind of improvements! :D

Secret Average Trade : this is a revolutionary system unlike any other, the strategy uses algorithms such as grids, averaging, hedging and partially uses martingale algorithms. Trading is carried out on 17 currency pairs simultaneously and uses timeframes: 9. Fully automatic trading with the calculation of entries based on a system of various Trends and also supports reverse trading. Benefits
Partial closure to reduce the load on the deposit. Averaging orders, which are required to close past

Binance ist ein weltbekannter Kryptowährungsaustausch! Um eine genauere Analyse des Marktes für verschlüsselte digitale Währungen zu ermöglichen, kann das Programm die K-Line-Daten von Binance zur Analyse automatisch in MT5 importieren. Die Hauptfunktionen sind:
1. Unterstützen Sie die automatische Erstellung von Spot-Handelspaaren in der Abteilung für Währungssicherheit. Sie können auch die Gewinnwährung und die Basiswährung separat festlegen. Wenn beispielsweise ProfitCurrency leer ist, bed

Coiote Book Balance é um indicador que monitora o livro de ofertas e indica de maneira simplificada o níveis de renovação de ordens agrupados no timeframe gáfico, mostrando quanto o maior lado renovou e a diferença dessas renovações. Além disso, é possível visualizar em quais preços estão as maiores ordens da cada lado, o preço teórico dessa liquidez e a quantidade de lotes em tempo real. Para correto funcionamento do indicador é preciso que o livro de ofertas seja aberto antes da inclusão do in

The indicator plots dynamic POC, VAH and VAL levels for a specified period from tick data. POC - Point Of Control, the price at which the maximum volume has accumulated over a certain period of time (POC in the volume profile). VA - Volume Area, the zone of the fair value of the asset. VAH - Volume Area High. VAL - Volume Area Low. The DBS_DynamicLevels indicator plots dynamic levels where the calculation point is the maximum volume level (POC) and zone VAH / VAL. The indicator shows the history
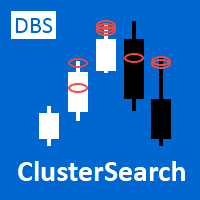
Professional traders know that volume is the fuel for price movement. Large players try to hide their true intentions, but they can be recognized by volume bursts. The standard vertical volume does not show us specific price levels, but the cluster volume and especially its surges provide a very clear picture and specific price levels (areas).
The DBS Cluster Search indicator searches for clusters of the specified size in tick data and highlights them with colored figures on the chart. These

"Support or Resistance Alert Broken" is a simple and very intuitive tool that allows you to create or eliminate horizontal and trend supports and / or resistances with a simple click.
When the support or resistance line is broken by the closing price at the end of the current candle, the "Support or Resistance Alert Broken" tool will send an alert with sound, as well as a notification to the MT4 or MT5 mobile application. This tool can send alerts from multiple pairs at the same time.
Utili

After purchasing, you can request and receive any two of my products for free!
После покупки вы можете запросить и получить два любых моих продукта бесплатно! Expert Advisor for manual and automatic trading on the trend lines of the indicator Bollinger Bands. The Expert Advisor draws trend lines from the middle band for a specified number of candles. Important!!! - you need to test the adviser in visual mode.
You may be interested in my other products: https://www.mql5.com/ru/users/vy
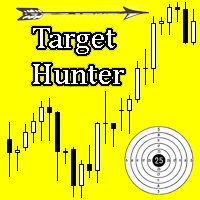
The indicator determines the most important component of any trading system - the possible exit point from the transaction.
As the price moves, depending on the market situation, the indicator builds goals. The target becomes relevant when the price starts moving towards the target. If the movement is strong, then it may take a certain number of targets to stop or reverse price. The accumulation of targets is most likely able to stop the price. Some goals are executed several times.
But the

Dieser Volatilitätsindikator ist nützlich, um tote Märkte zu erkennen. Er basiert auf dem EVZ-Index, der die Volatilität des Euro misst (kann aber auch auf den Devisenmarkt insgesamt angewendet werden). Hohe Werte stehen für ein hohes Volumen/Volatilität auf dem Markt. Liegt er unter 7, ist das Volumen gering und das Risiko beim Handel größer. Für Händler, die die No Nonsense Forex-Methode (NNFX) anwenden, kann dieser Indikator nützlich sein, um Algorithmen zu testen und die Auswirkungen der EVZ

Pyramids ist ein Expert Advisor, der mein neues Pyramidensystem der teilweisen Schließung verwendet. Einstiege erfolgen in überkauften und überverkauften Zonen. Wertpapiere sind verfügbar, um das Kapital zu schützen. Recommended for default settings: EURUSD-H1-1000$ .
Can work on any pair but need optimizations .
Discord: https://myx.gg/discord
Live trading: https://myx.gg/mql5 Recommended Broker : ICMarkets (4.8/5 on Trustpilot for 10k+ reviews) Recommended autolot & balance per

This dashboard displays current news from three sources: from the ForexFactory.com website (FFC calendar), from the Investing.com website and the Economic Calendar from mql5.com. You can sort news by impact and by country, and display them on the chart with one click. By holding down the 'Ctrl' key, you can select several different 'currencies' or 'impacts' to sort. Also, this utility shows not only the forecast, but also the actual values after they appear on the site. You can set a separate

Expert advisor based on Bollinger Bands Indicator Since it is not easy to predict when the trend reversal will occur, this Expert can place additional orders at different distances from the first order, and with different lots, so that positions can be averaged and profit taking is more easily achieved. Since the over-buy or over-sell conditions apply to any currency pair in the Forex market, this expert can be used with any pair by adjusting the step and the size of the Lot. The default parame

Vikings ist ein Expert Advisor, der hausgemachte Indikatoren verwendet, um auf Basis der Volatilität zu handeln. Zum Schutz des Kapitals sind Sicherheiten verfügbar. Recommended for default settings: EURUSD-H1-1000$ .
Can work on any pair but need optimizations . Discord: https://myx.gg/discord
Live trading: https://myx.gg/mql5 Recommended Broker : ICMarkets (4.8/5 on Trustpilot for 10k+ reviews) Recommended balance per pair : low risk: +3000$, medium risk: +1,000$, high risk: ±5

The EURUSD looking at the Majors is a Multipair System for operate the EURUSD
!!!!!IMPORTANT!!!!! THIS EA IS FOR USED IN EURUSD ONLY. !!!!!IMPORTANT!!!!!
This system detects a multi-pair entry point based on the value of the majors and operates that entry in the EURUSD with its own and efficient algorithm. All tickets have an SL and TP and use optimized trailing. You have to use the name of the value in your broker, in the corresponding inputs.
Very stable growth curve as result

Expert advisor based on a widely tested price action strategy The EA already incorporates all the variables in its programming, it is enough to let it run on the graph with the values it incorporates by default.
ACCOUNT: - This AE has been optimized to work on a STANDARD account - This AE is suitable for accounts of 3,000 USD - Default settings suitable for EUR/USD (any Timeframe)
DESCRIPTION OF THE STRATEGY Price action trading analyzes the performance of a currency to predict what it
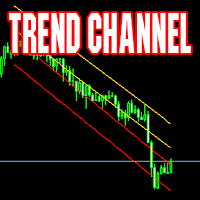
Channel indicator. Calculated dynamically. Suitable for both working in the direction of the trend and inside the channel. Excellent results when working on timeframes from 4H towards the center of the channel.
Example of use: when the price touches one of the extreme lines - opening a deal in the center of the channel with a take profit on the nearest middle line of the indicator. MT4 version The indicator can be used in expert advisors (4 buffers), receiving data in a standard way. Support:

Guten Tag. UturnAnalysis - um die Qualität des Indikators zu überprüfen
STARTETE die TESTVERSION der kostenlosen Versand von Umkehrsignalen auf der Grundlage dieses Indikators für den Termin - und Aktienmarkt der MICEX
schreiben Sie an den technischen Support, mir 777basil@mail.ru , oder in den Kommentaren Ihre E-Mail-Adresse und wir senden Ihnen die Kontodaten, wo Benachrichtigungen kommen, kostenlos.
https://youtu.be/q228LvLec-Y
wir setzen auf mehrere Instrumente https://youtu.be/Wr7N

Guten Tag. Heute präsentieren wir den neuen Indikator PointIntoChannelTOMSON https://youtu.be/dmgtVwX3nvg
https://youtu.be/Wr7N2WEY8lA -dieser Indikator wird vom Kanal auf das Niveau der Preisabweichung in Richtung Kauf und Verkauf berechnet, das grüne und das rote Fenster der Indikatoren sind. Je größer die Abweichungsrate, desto wahrscheinlicher ist die Umkehrung. Die Anzeige wird mit jedem neuen Balken neu berechnet und es wird empfohlen, ihn nur als Hilfslicht zu verwenden
Kontakte fü
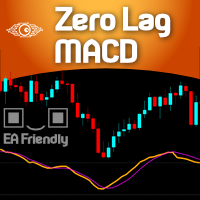
For those who are fans of the traditional MACD ( Moving Average Convergece/Divergence ) indicator, here it is a way faster indicator that could be very useful for intraday trading. Of course it could be used in higher timeframes, with the proper settings. Here at Minions Labs we always encourage traders to calibrate every single indicator you have to extract and distill every drop of good information it has for you. And this is the case with this speedy friend... This Zero Lag MACD could be used

Please rate it.
Approximate approximate buy / approximate approximate trend EA.
Trends are trends.
Buy a squeeze and choose a candle.
You can wear it in black and white when going backwards.
Currency Currency: BTCUSD
Trading Style: Scalping
Trading time: 5 minutes
Parameters
Magic: Magic number
Lots: I use MM
ExitRatio: Closed with N% account balance
MaxPosition: Number of updates
MM: Setting to use the lodging function
MaxRisk: Large risk when using MM
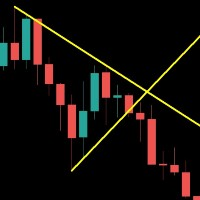
Save your time . Select area and the trend line will draw automatically . Draw a support and resistance line for the selected range with two mouse clicks . If you need to, you can also draw a line for support and resistance based on separate areas.
The resistance trend line is drawn based on the first and last highs inside the selected area; The support trend line is drawn based on first and last lows inside the selected area;
The Moving Average Convergence Divergence Indicator (MACD) is both a trend–seeking and momentum indicator which uses several exponential moving averages set to closing prices to generate trading signals. This Version brought to you the Stochastic confluence filtering the signals, this set ups amazing entries on índices and stock futures trading.
We added many types of alerts plus the Delay Cross Filter to aid in your search for better opportunities in the market.
Product Features Sound aler
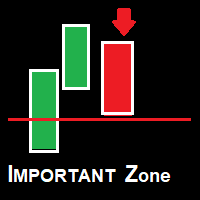
Zona Importante. O indicador Zona Importante é um indicador desenvolvido com todo meu conhecimento no mercado. o que voce podera esperar dele? o Indicador gerara alerta em toda e qualquer Reversao, seja uma reversao de fato ou um simples pullback ou seja a cada mudanca de direcao ocorrera um alerta. - Beneficios: - Nao deixara voce perder oportunidade.
O sell signal significa que uma nova onda de queda ocorrera. O buy signal significa que uma nova onda de alta ocorre

Perseverance. It is an Ea that seeks the best window of opportunity to enter the market.
If the entry is wrong, the system exits by stop lost.
If the entry is correct, once the point of no return is exceeded, an aggressive follow-up system begins.
Can used this EA whit 500$ in your account Perseverance IS IDEAL FOR SMALL ACCOUNTS Perseverance IS ONLY AN OPEN OPERATION. Perseverance IS VERY LOW RISK OF MARGIN CALL
You can download the demo and test it yourself.
Very stabl

Overview The Expert Advisor sends notifications to a mobile phone, via e-mail or plays a sound in case any changes are detected on the trading account: opening/closing positions, changing order or position parameters, balance or leverage. Also, the Expert Advisor can inform that Equity on the trading account has dropped below a specified value or Free Margin is small compared to Margin. The Expert Advisor does not trade, it only monitors your account.
Launching the Expert Advisor You should al
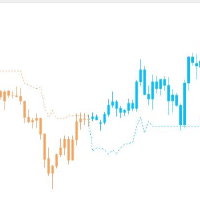
Stable trend index without clutter The index optimizes the moving average and removes the unstable clutter It can also be used in any other commodity It is best used in mainstream currencies such as EURUSD, USDJPY, GBPUSD and AUDUSD
The time period is 1 hour
I only know a little English, please forgive me if you don't understand I will always improve this indicator
Daily Percentage Change (MetaTrader indicator) — calculates the change of currency rate related to the previous daily close and displays it in percentage points in the main chart window of the platform. Additionally, it can display the weekly and monthly percentage changes. Different colors can be set for positive or negative price increases. Also, a small customizable arrow helps to visualize the price change direction. If your broker uses an unconventional time zone, the indicator can use

Hello This EA is depending on Guaranty strategy , it open same position by wide pips every time then will close in profit. it can make a continues profit (maybe little but continues) you can change all settings but don't be impetuous. note; (if you want make back test) make Work_in_Backtest_TF true
you can download it and make Back Test before buy it
good luck
السلام عليكم ورحمة الله وبركاته يعتمد هذا الاكسبيرت على إستراتيجية مضمونة ، فهو يفتح نفس المركز في كل مرة لكن على فترات متباعدة

Die Cauchy-Verteilung ist ein klassisches Beispiel für eine Fettschwanzverteilung. Dicke Schwänze weisen darauf hin, dass die Wahrscheinlichkeit, dass eine Zufallsvariable vom zentralen Trend abweicht, sehr hoch ist. Für eine Normalverteilung ist die Abweichung einer Zufallsvariablen von ihrer mathematischen Erwartung um 3 oder mehr Standardabweichungen äußerst selten (die 3-Sigma-Regel), und für die Cauchy-Verteilung können Abweichungen vom Zentrum beliebig groß sein. Diese Eigenschaft kann ve

Tarcius EA is designed with “High-Low Breakout” strategy to find entries with the trend when price breaks from a key point of previous high-low candle. Features: Great “High-Low Breakout” strategy with promising win rate ( ≈ 60%) and low drawdown Risk Reward Ratio = 1 : 1 (SL = TP). Hidden SL and TP. EA monitors the price at all times and closes the position when the price level is reached.
No martingale, no grid, scalp or hedge Two options for Lot size management: Fixed Lot size Lot size bas

This indicator watch the Fibonacci retracement for levels and timeframes selected by the trader. In the workload of day trading, having your eyes on all the timeframes to validate some information, for Fibonacci traders, is really time consuming and requires constant focus. With this in mind, this tool allows you to have your attention on other trading details while this one monitors the retracements of each timeframe in real time. In the charts, this indicator data (retracement %, age of the r
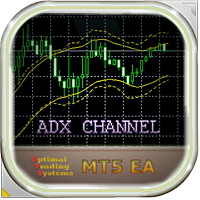
Dieser EA bildet einen Kanal, der auf den Messwerten des ADX-Indikators (Average Directional Movement Index) basiert, und handelt von den Grenzen dieses Kanals aus, wenn sich der Preis umkehrt. Dieser Kanal wird im Diagramm des Währungspaars angezeigt. Ein Verkaufsgeschäft wird ausgeführt, wenn der Preis die obere Kanallinie berührt und von dieser abprallt, ein Kauf - von der unteren. Gleichzeitig kann es Einträge zu Trades filtern, abhängig von den Messwerten anderer Indikatoren: Stochastic, A

An effective indicator that highlights candles with increasing volumes, overshadowing those with shrinking volumes. Also suitable for Forex because it uses tick_volume.
You can set the colors to your liking. It will be easier to spot trends and possible reversals. The increasing volumes indicate the presence of large investors and therefore determine the reliability of the candle under observation

RENKO PRICE ACTION ATR ist ein "Expert Advisor", der durch die Konstruktion des Renko-Charts entwickelt wurde, wobei jeder BRICK die Größe hat, die durch die ATR des vom Benutzer ausgewählten Zeitraums berechnet wird. Renko-Charts wurden entwickelt, um kleinere Preisbewegungen herauszufiltern und es Händlern so zu erleichtern, sich auf wichtige Trends zu konzentrieren. Aufgrund seiner Effizienz bei der Erkennung von Kurstrends ist es auch möglich, Unterstützungen und Widerstände sowie Top- und
Chart State Saver for MT5 is utility which helps to save states of all your charts even if they will be closed. And then all saved charts' states can be easily loaded back to charts.
It stores templates for each particular currency pair and automatically applies them to charts once they will be opened at next time. Also they can be applied to the charts by your own needs. Thus you can close any chart at your MT5 without scaring to lose chart's data like drawls, messages, chart styling and so o

The delta indicator is used to display the difference between the volume that passed on the exchange at the Ask price and above (market buys) and the volume that passed at the Bid price and below (market sales). This indicator shows the delta of each candle on the timeframe of your choice. The data is displayed as a colored histogram in a separate indicator window. The indicator is calculated from the tick history, therefore, to speed up the calculations and reduce the load on the system, the n
Concept of Market Profile was created at Chicago Board of Trade (CBOT) by trader Peter Steidlmayer and first published during the 1980s as CBOT product. Market profile by itself is not a stand-alone strategy, but a different way how you can view the market and make better trading decisions.
They have seen a market as an auction process which is affected by supply and demand the same way as every other auction, for example, development of prices of food, gas etc.
The price goes up as long th

Simple Stochastic Hedge Welcome to the Simple Stochastic Hedge Robot
The Robot works on all Pairs and all Time Frames.
With Stats on Screen + Timer +Spread Filter ===== -Balance -Equity -Spread -P7L -Buy Orders -Buy Lots -Buy Profit -Sell Orders - Sell Lots - Sell Profit This Robot is very easy to use . You can basically just download it and start trading. There is a easy Hedge Strategy built in to keep the risk as low as possible.
I wish everyone the most possible success with the

The EA is based on a scalping breakout strategy , uses advanced exit algorithms and has built-in filters to filter out bad signals. Fully automatic trading with entry calculation based on the high / low breakout system. For trading, the advisor uses 4 currency pairs and the M30 timeframe. To create a strategy, we used historical data with a history quality of 99.9%, over the past 20 years. The EA has the following features: Uses a smart false signal filtering system. Uses a system for recognizi

TrendMeasurer indicator / TMi The indicator is designed to help the user to find the end point of a strong trending price movement. Important - END. Not start. How the indicator works The first price impulse and its subsequent pullback form a certain "critical mass" which acts as "fuel" for further price movement. The production of this fuel indicates the potential end of the trend. Both volume and indicator calculated in a certain way from price data can be the fuel. The amount of "fuel" can be

TrendMeasurer indicator manual / TMi manual The indicator is designed to help the user to find the end point of a strong trending price movement. Important - END. Not start. How the indicator works The first price impulse and its subsequent pullback form a certain "critical mass" which acts as "fuel" for further price movement. The production of this fuel indicates the potential end of the trend. Both volume and indicator calculated in a certain way from price data can be the fuel. The amount of

This indicator provides an original mix of WPR, VSA, and volume delta. It shows ratio of buy/sell volumes scaled on 100% range based on total volume change for a selected period. The convetional VSA (Volume Spread Analysis) studies interconnections of price action and volume change in absolute values, whereas WPR (Williams Percent Range) offers a convenient approach of price moves normalization into the fixed percentage metric: 0 - 100%. Hence overbough and oversold states are easily spotted. N

GIVE A LOOK TO MY OTHER PRODUCTS !
100 % PER MONTH PROFIT---- MY NEW SIGNAL HERE -------> https://www.mql5.com/en/signals/2162238?source=Site+Signals+My# Morning and evening star are 2 famous and reliable candlestick patterns, very helpful to understand an imminent change of trend. This indicator finds for you this patterns on your chart and send you an alert just when a pattern is 100 % formed. To make this indicator more reliable,y
For those who are fans of Bill William's strategy, here it is the Trade Zone indicator filled with alerts and a better coloring system and EA ready (BUY & SELL buffers). And for those who don't know Bill Williams work, search Amazon for the title " Trading Chaos: Maximize Profits with Proven Technical Techniques ". This indicator internally uses the widely known Awesome Oscillator along with the Accelerator indicator, and when both are aligned it lights up the candles signaling a probable strong
Erfahren Sie, wie man einen Handelsroboter im MetaTrader AppStore, dem Shop für Applikationen für die MetaTrader Handelsplattform, kaufen kann.
Das Zahlungssystem der MQL5.community ermöglicht Zahlungen mit PayPal, Kreditkarten und den gängigen Zahlungssystemen. Wir empfehlen Ihnen eindringlich, Handelsroboter vor dem Kauf zu testen, um eine bessere Vorstellung von dem Produkt zu bekommen.
Sie verpassen Handelsmöglichkeiten:
- Freie Handelsapplikationen
- Über 8.000 Signale zum Kopieren
- Wirtschaftsnachrichten für die Lage an den Finanzmärkte
Registrierung
Einloggen
Wenn Sie kein Benutzerkonto haben, registrieren Sie sich
Erlauben Sie die Verwendung von Cookies, um sich auf der Website MQL5.com anzumelden.
Bitte aktivieren Sie die notwendige Einstellung in Ihrem Browser, da Sie sich sonst nicht einloggen können.