Kostenpflichtige Handelsroboter und Indikatoren für den MetaTrader 5 - 78

The indicator monitors the Dinapoli MACD trend in multiple timeframes for the all markets filtered and shows the results on Dashboard.
Key Features Indicator can be used for all markets Monitors every timeframe, from 1 Min to Monthly
Parameters
UseMarketWatch: Set true to copy all symbols available in market watch MarketWatchCount : Set the number of symbols that you want to copy from the market watch list. CustomSymbols: Enter the custom symbols that you want to be available in dashboard.

The indicator scans for Dinapoli thrust pattern in multiple timeframes for a specific market. Key Features Indicator can be used for all markets It can scan for thrust pattern on W1, D1, H4, H1, M30, M15 and M5 timeframes Ability to choose number of bars required above/below displaced moving average to define thrust Able to move display label on chart by single click Parameters Minimum Bars: Least amount of bars to account for Thrust DMA Period: Moving average period DMA Shift: Number or bars re

Six Stars it is a Secure Automated Software for trade 6 values simultaneously. Six Stars It is optimized for the majors Do not use this robot at the same time as others, it is a multi-value robot, therefore it manages 6 pairs simultaneously. The architecture is a Fully Automatic Autonomous Robot Expert capable of independently analyzing the market and making trading decisions
Six Stars Have 6 neurals nets to used the correct algoritm in the correct market situation Six Stars It

What you can do with CandleStick CandleStick is a useful indicator for doing MTF analysis. This indicator displays the CandleStick of another time frame on the chart . By understanding the information in multiple time charts at the same time, it is easier to understand the overall market view. It is also a useful tool for validating and studying past quotes and trades. There are similar products made by others, but I designed and developed it so that it is easy for me to use.
Features of Candl

This utility sends you Telegram messages about: open a new position (can be disabled) change the current position (Stop Loss / Take Profit) (can be disabled) close current position (can be disabled)
Symbol: all Symbols current Symbol
Directions of deals: buy and sell only buy (long) only sell (short)
Magic number: all magic numbers only for a specific magic
Type deals/orders: market deals (buy / sell) limit orders (buy limit / sell limit) stop orders (buy stop / sell stop) stop limit or

[BESCHREIBUNG]
Die Einstiegspunktanzeige zeigt Aufwärts- / Abwärtspfeile als Einstiegspunkt für Kauf / Verkauf an. Das Signal basiert auf EMA, MACD und Price Action.
Ein roter Pfeil bedeutet, dass es eine gute Gelegenheit ist, zu verkaufen. Ein grüner Pfeil bedeutet, dass es eine gute Gelegenheit zum Kaufen ist. [WARNUNG UND EMPFEHLUNGEN]
Der Handel mit Forex und gehebelten Finanzinstrumenten ist mit einem erheblichen Risiko verbunden und kann zum Verlust Ihres investierten Kapitals führen.

The White's Candle Color indicator (by volume) will color the candles based on the current candle's volume compared to the moving average of the volume. This will allow you to see clearly if the volume (real or tick) is within the normal range, whether it is high or low and bring very important information about the market. I hope that this indicator can help in your operational. Success and good trades!

It is a utility (Expert Advisors) that you can easily tweet from MetaTrader Support for "Twitter API v2 OAuth 2.0 with PKCE".
Just add a few lines of code to the Indicator , EA or Script you create TweetHelper will tweet a message for you.
Preparation: Please apply for a developer account to access the Twitter API. Please refer to the following for setting details and procedures.
Example of code (script) for using TweetHelper https://www.mql5.com/ja/code/31044
MetaTrader settin

Indicator focusing on the market's ZigZag, also adding 2 other already established indicators: Book of Offers and Balance Aggressor (Time & Trades), this indicator allows to detect the best price trigger (buy or sell) in the aggressions to the Book of Offers including filters important as Aggression in Candle.
Recommended use on the Brazilian iBovespa B3, but it also serves in Forex as long as the assets have information from the Book, in the case of Forex it is not possible to use the Aggres

The indicator shows when there are overpricing and divergences over a normalized MACD Plus, it displays signals with configurable alerts, self-regulating dynamic overprice levels, and a simple setup and interface. The indicator that automatically calculates overprices ranges! MACDmaxmin is an indicator based on the MACD oscillator that effectively identifies trend changes in price, as it is a momentum indicator that captures the trend and shows the relationship between two moving averages of th

IntradayMagic predicts the nature of ATR and tick volumes for 1 day ahead. The indicator does not redraw and does not lag behind. Using Intraday Magic, you can significantly improve the quality of trading and avoid unnecessary risks. According to its indications, you can detect the crisis state of the market and the moments of trend reversal, specify the moments and directions of entries. How the indicator works Periodic events, exchange schedules, Bank schedules, expirations, and other similar

For those who appreciate Richard Wyckoff approach for reading the markets, we at Minions Labs designed a tool derived - yes, derived, we put our own vision and sauce into this indicator - which we called Waves PRO . This indicator provides a ZigZag controlled by the market volatility (ATR) to build its legs, AND on each ZigZag leg, we present the vital data statistics about it. Simple and objective. This indicator is also derived from the great book called " The Secret Science of Price and Volum

Vostok MT5 it is a Secure Automated Software for trade Forex market and indices.
The architecture is a Fully Automatic Autonomous Robot Expert capable of
independently analyzing the market and making trading decisions Vostok MT5 Have a neural net to used the correct algoritm in the correct market situation
Vostok MT5 It is an advanced trading system. This is a fully automatic Expert Advisor.
Vostok MT5 is a plug and play system Vostok MT5 It is a 100% automatic syste
The EA uses a strategy based on strong price deviations, trading is carried out on major currency pairs. For this strategy, the author's indicator "Indicator Maximum Price Deviation" was developed - the algorithm detects deviations in timeframes: M5 and H1 , and if deviations are found, then the advisor opens the first order and then if the price moves in a positive direction, then the adviser opens additional orders on each bar (a total of 9 additional orders are supported). The EA does not inc

Lassen Sie den Roboter den gesamten Markt nach Ihnen durchsuchen und die besten Handelsmöglichkeiten erkennen, während Sie Ihr normales Leben führen.
Der Market Deviation Scanner misst die Abweichung der Preise von einem bestimmten Durchschnitt in Prozent.
Die empfohlene Einstellung für alle Durchschnittswerte ist ein 200 DAILY SIMPLE MOVING AVERAGE. Jeder Parameter kann jedoch nach Belieben geändert werden. Der Scanner ist vollständig anpassbar.
Es besteht die Möglichkeit, eine E-Mai
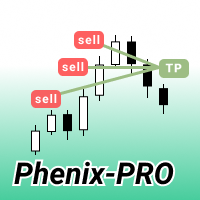
Phenix - PRO MT 5 – это полностью автоматизированный торговый робот. Данный робот торгует на хорошо известной валютной паре EUR JPY . По умолчанию параметры подобраны для валютной пары EUR JPY с Т аймФреймом 1М. Стратегия основана на системе мартингейла. В качестве точки входа в рынок советник использует математическую модель, основанную на значениях индикатора скользящей средней. Дополнительно можно настроить робота, чтобы он торговал с учетом баланса, для этого необходимо вкл AutoLot и Auto

No Demand No Supply This indicator identifies No Demand –No Supply candles to your chart and plots volume bars colored according to the signal. It can be applied to all timeframes or to a specific one only. It can also be used as regular volume indicator with exceptional future of WEIGHTED VOLUME. Furthermore is has an alert notification, sound and email when a signals occurs. The indicator does not repaint but the alert will come on two candles back due to the definition of No Demand No Su

Excellent dashboard for analytics. The panel helps to analyze the values of the Parabolic SAR indicator and its signals.
With this panel you can: watch the current signal from Parabolic SAR on all timeframes; watch the current signal from Parabolic SAR for different symbols; watch the current Parabolic SAR value; several types of signals for analytics.
Values in a table cell: value of Parabolic SAR
Signal type: Parabolic SAR crosses Price Parabolic SAR upper/lower Price
Work

Der analytische Indikator BodySizeHistogram wurde entwickelt, um die tatsächliche Bewegung des Wechselkurses entlang des Körpers der Kerze zu beobachten. Der Körper der Kerze ist ein universelles Werkzeug für die Analyse des kursdiagramms ohne die Verwendung von Indikatoren, die mathematische Formeln verwenden. In meiner Vorstellung ist der Körper der Kerze fast alles, was Sie brauchen, um das Ereignis mit dem Preis zu verstehen. In diesem Indikator werden Histogramme von kerzenkörpern in Punkte

Indicator of the colour display of the zones of buyers and sellers in the bar with a change of colour as the volume increases.
From bar maximum to bar closing - this is the sellers' zone.
From bar closing to bar minimum - this is the buyers area.
As the bar volume increases in comparison to the previous bar, the respective zones are coloured in a different colour.
Input parameters volumes (tick or real)

PROMO: ONLY 10 LEFT AT $90!
Next price: $199 Price will be kept high to limit number of users for this strategy.
This EA starts trading at the open of London (UK) Session . It is based on analysis of advanced statistical distributions combined with short to medium term reversal patterns which have mean-reversion attributes. The EA includes several smart features and allows you to trade with a fixed or automatic lot size. The EA is not sensitive to spreads but can be backtested on bo
Trading Expert CatchPositionByStopOrder wurde entwickelt, um auf dem trendmarkt zu arbeiten wenn Sie die Richtung des Handels kennen, können Sie handeln UND SELLSTOP und BUYSTOP Orders, können Sie die Wahl der Richtung des Experten selbst anvertrauen. Stellt ausstehende STOP-Orders aus und bewegt Sie hinter dem Preis, um den effektivsten Einstiegspunkt zu bestimmen. Empfohlener Zeitrahmen für den Handel M5 / M15 / N1. Der Berater kann mit festen S/l und T/p arbeiten, und mit Hilfe von Trall, we

Общие сведения Советник определяет наиболее вероятные места движения графика и открывает ордера на Buy или Sell. Не использует высокорискованные стратегии, такие как Мартингейл. Ордера закрываются по наиболее возможному профиту или небольшой потерей. Что имитирует Take Profit и Stop Loss. Мультивалютный.
Важно перед запуском прочитать! Для запуска советника достаточно запустить его на одном единственном графике например EURUSD. Во вкладке "Обзор рынка" в идеале отобразить все символы для

https://youtu.be/Ze9zPpYtIrI
GridCatchCandleLimitOrderOneSymbol - Grid flat Advisor, um Aufträge von den Grenzen des Kanals in die Mitte zu öffnen, arbeitet auf Pullbacks von der Unterstützung und Widerstandsebene, von der benutzerdefinierten Anzeige der Breite des Kanals TMA, mit festen S / L und T / P. Der Advisor ist für den Handel von den Niveaus entwickelt wenn eine bestimmte Trendbewegung fehlt und Sie Zweifel an der Fortsetzung des Trends haben, werden die Niveaus automatisch für den P

Max ScalperSpeed MT5 is a fully automated expert advisor. This system has been developed to improve the efficiency of generating more returns. Rely on scalping trading strategies and recovery strategies with appropriate trading frequencies, and also able to work well in all market conditions, whether trend or sideways, able to trade full time in all conditions. Enable or disable news filtering according to user needs. Added a proportional lot size adjustment function, where users can choose t
Indicator summary Индикатор информационная панель отображает значения и торговые действия, а так же выводит сводную информацию о торговых действиях, основанных на 11 встроенных индикаторах. Встроенные индикаторы:
RSI (Relative Strength Index )- пересечение зоны перекупленности сверху вниз - сигнал на продажу. Пересечение зоны перепроданности снизу вверх - сигнал на покупку. При колебаниях в зоне между перекупленостью и перепроданостью сигнал формируется в зависимости от нахождения значения о

Buy and sell signals based on the Wave Setup strategy for entering a trade on the pullback after a reversal.
How does the indicator work? The indicator activates the buy and sell signal when their respective conditions are met. For an uptrend, we need a reversal up on the EMA9 followed by prices above the ascending SMA21 making a pullback and a touch on it. For a downtrend, we need a reversal down on the EMA9 followed by prices below the descending SMA21 making a pullback and a touch on it.

Victory Price Direction I'm glad to present you my new indicator.
This indicator includes all the best strategies that I have researched. When developing and optimizing, I used ML algorithms. The indicator is very easy to use.
Now the indicator has 3 basic strategies and the ability to customize your own strategy. I am constantly looking for better strategies.
You get: A simple and effective indicator of reversals. The indicator will help you place Take Profit correctly. It w

Excellent dashboard for analytics. The panel helps to analyze the values of the Alligator indicator and its signals.
With this panel you can: watch the current signal from Alligator on all timeframes; watch the current signal from Alligator for different symbols; watch the current Alligator value; several types of signals for analytics.
Values in a table cell: Jaw Teeths Lips Jaw - Teeth Jaw - Lips Teeth - Lips
Signal type: Lips - Teeth - green line (lips) crosses red line (

The previous day's vwap is used by some traders as a support and resistance point, after all it is one of the ways to consider the fair price of that asset or that pair the day before. Possible defenses can occur in this region indicating a reversal, or triggering stops starting a new, more directional movement. It is a matter of analyzing how it will add to your operational.
To avoid manually drawing the previous day's vwaps and saving time for your analysis, use the Vwap Freeze indicator,

WT Vwap 5 Bands
The WT Vwap Bands indicator is an indicator that combines price and volume, helping to show whether the price is within the "fair price", overbought or oversold.
The indicator code was designed for performance and has already been tested in a real trading account.
In addition to the visual inputs (color, thickness and line style), the user can define a% value that depends on the price.
The default values work with the most distant band at 1% of the price and then di

Sputnik it is a Secure Automated Software for trade Forex market and indices.
The architecture is a Fully Automatic Autonomous Robot Expert capable of
Independently analyzing the market and making trading decisions
Sputnik It is an advanced trading system. This is a fully automatic Expert Advisor. Sputnik is a plug and play system Sputnik It is a 100% automatic system, The system is self-sufficient, performing all the work. You can download the demo and test it yours

新機能:Ver3.5 28通貨ペアの強弱も表示するようにしました。 監視ペアで最強、最弱の通貨ペアとなった場合、四つ葉のマークが出るように変更しました。 15分足、1時間足、4時間足単位での通貨ペアの強弱を表示するようにしました。
詳細な情報はこちらにサイトがあります。 https://toushika.top/tc-cs-plus-cfd/
注:こちらはTitanのデモ口座で動作します。 XMで使用したい場合は こちらのでセットファイル を使用してください。
機能: 一目で現在の通貨の方向性と強弱が確認できます。 15M,1H,4Hでの方向性を表示します。 15M,1H,4Hでの方向が揃った場合にドットが表示されます。 通貨の相関が揃った場合にドットが表示されます。 ※相関はピアソン相関係数を使用しています。 より詳しい情報につきましてはこちらを参照してください。 https://www.mql5.com/ja/articles/5481 通貨の強弱を表示します。 現時点でのボラリティーの状況を表示します。 過去20日/過去5日/今日のボラリティーを

The indicator is based on a proven successful strategy. It shows buys and sello signals with suggested stop and target. In the same way, it calculates the essential trading analysis statistics as successful and profit ratio. KEY LINKS: Indicator Manual – How to Install - Frequent Questions - All Products Indicator features Effective and understandable signals. It can be used as a complete trading strategy. Complete trading statistics to evaluate the indicator performance. It shows exact

SR Breakup Indicator it is an indicator based on support and resistance . It makes price breakout levels visible by opening the trader's mind to spot market opportunities.
Attention!!! This Indicator can be used in any time frame.
Suggestion of use Wait until the support and resistance lines are horizontal and closer. Do Trade (BUY): if price breakout resistance level (outside line). Do Trade (SELL): if price breakout support level (outside line). Use internal lines as Sto

Anzeige VolumeTick https://youtu.be/tmHZKdMCMGo
hergestellt für präventive Ermittlung der möglichen Pivot-Punkte, bei den Bedingungen der Konsolidierung und multidirektionale Handel Händler, Anzahl der Bände die sich im Markt stark erhöht, was zeigt das Interesse der Teilnehmer ändern Sie die Richtung der werkzeugbewegung auf dem Markt und zählt die Anzahl der Zecken auf jede Bar, ist in der Form eines Oszillators. Auf diese Weise erhalten wir die Möglichkeit, den Handel zu stoppen oder in d
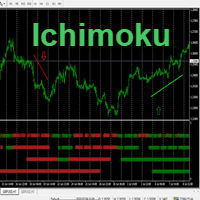
Hello This Indicator will draw Green (Up) and Red (Down) small arrows from Multi TimeFrames based in ( Ichimoku ) to help you to take decision to buy or sell or waiting If there 4 green arrows in same vertical line that's mean (Up) and If there 4 Red arrows in same vertical line that's mean (Down) and the options contain (Alert and Mobile , Mail Notifications). Please watch our video for more details https://youtu.be/MVzDbFYPw1M and these is EA for it https://www.mql5.com/en/market/product/590

Excellent dashboard for market analytics. The panel helps to analyze the values of the Stochastic indicator and its signals.
With this panel you can: watch the current signal from Stochastic on all timeframes; watch the current signal from Stochastic for different symbols; watch the current Stochastic value; several types of signals for analytics.
Values in a table cell: Stochastic - Main line Stochastic - SIgnal line Stochastic - Main line minus signal line
Signal type: Sto
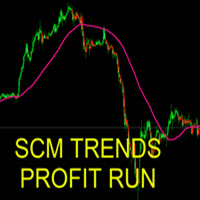
The indicator can be used in several ways. The simplest is to buy when the SCM Trends Profit Run line is painted green and sell when it is red. This indicator that allows you to detect several changes and dynamics in price that many traders can’t estimate or see without an indicator, which highlights its essence and usage.
Accordingly, traders can draw conclusions and make estimates about how the prices will change based on the information they have and then they can modify their strategy fo
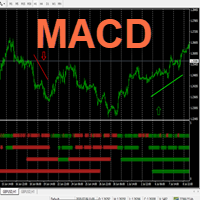
Hello This Indicator will draw Green (Up) and Red (Down) small arrows from Multi TimeFrames based in ( MACD ) to help you to take decision to buy or sell or waiting If there 4 green arrows in same vertical line that's mean (Up) and If there 4 Red arrows in same vertical line that's mean (Down) and the options contain (Alert , Mobile and Mail Notifications). Please watch our video for more details https://youtu.be/MVzDbFYPw1M and these is EA for it https://www.mql5.com/en/market/product/59092 G

It is a Graphical and Trend indicator that brings several advantages. Eliminates noise.
Facilitates the identification of the trends. Can be used as directional force indicator. Identify lateralization: candles with close and open price closer. Identifies high volatility: candles with shadows larger than the body. Attention!!! Works on any asset and any time frame.
Easy setup Symbol: anyone Time frame: anyone Parameters: Indicator Period Recommended Period : betw

Der neue Indikator ist ein Trendvorhersager für das aktuelle Diagramm sowie andere Symbole und Zeitrahmen. Jeder Knopf auf dem Board ist interaktiv. Standardmäßig haben Sie 20 Währungspaare in der Merkliste und drei Zeitrahmen (M5, H1, D1), aber Sie können die Punkte und Symbole auswählen, die Sie im Menü anzeigen möchten. Wenn der Indikator blau ist, zeigt er den Beginn eines Aufwärtstrends an. Wenn es rot ist, zeigt es den Beginn eines Abwärtstrends an. In der Erfassung Nr. 3 (Tageslichtmodus)

Do you already know Display N Bars?
Do you already know the Start tool (from Midas indicators)?
In this indicator, we unified the two tools, allowing you to define which candle will start counting, or use the automatic numbering that was already available in the previous version.
Description of the utility follows:
Display N Bars
The Display N Bars utility is a simple tool that aims to help identify candles.
If a trader tries to share the knowledge with a colleague but it i

O Indicador CoioteChart foi construído pra facilitar desde a leitura de contexto de mercado até a micro estrutura do candle, facilitando ajustes operacionais e tomadas e decisão com alta eficácia.
Possui um controle para habilitar e desabilitar a visualização das pocs, vwap, zonas de máxima e mínima negociação, pode ser utilizado data sources de tempos gráficos para cálculos ou utilizado os ticks de agressão do time and trades, funciona com volume real e volume de ticks.
As colorações são at

This Indicator is based on the high's moving average and the low's moving average for trend following and/or trailing stops.
How does the indicator work? The indicator plots the uptrend dots until there is a close below the moving average of the lows. When this happens, a downtrend begins and is plotted until there is a close above the moving average of the highs. When this happens, another uptrend begins. And so it goes.
How to use it? - Trend following: You can use it as buy signals when

The indicator identifies two most important patterns of technical analysis - Pin Bar and Engulfing. MT4-version: https://www.mql5.com/en/market/product/53591 Settings: Mincandle size for PinBar - The minimum size of the Pin-Bar candlestick; Percentage of candle body on size - The percentage of the candle body in relation to its length; PinBar Alert - Alert when a Pin-Bar is detected; PinBar Mail - Sends an email when a Pin Bar is found; PinBar Notification - Sends a push notificati

This cost averaging Expert advisor (EA) places additional trades in the same direction as the original (manually opened) order when the price goes against you. It can be used as a grid system or as pure martingale system (exponential increasing of lot size) or smoothed martingale (for instance linear increasing of the lot size). Due to the risk involved, this EA is more suitable for intermediate to advanced traders who are well aware of how to handle risk management and trading an already profit

VolumeDeltaScanner is a volume delta monitor for multiple (up to 10) time scopes. It works by online ticks or history ticks. Indicator monitors tick volumes for buys and sells separately, and find their delta on every bar and larger scopes, then displays the volume deltas for all the scopes. Every scope is presented by its own buffer/line. The smallest scope is the current timeframe. It's required. All other scopes should be multiples of it. For example, if placed on a M5 chart, it can calculat

Trade with your MT5 Account on a custom API-Endpoint.
1. Activate API on your Signal Site.
2. Enter your Username.
3. Enter your Account-Password.
4. Enter the API-Endpoint URL to your MT5 Account (Extras -> Options -> Experts -> Allow WebRequest).
Lot Size Settings
Auto Lot = 0 and Fixed Lot = 0 : Copy Lot Size.
Auto Lot : Option to send normalized Lot-Size depends from Free Margin on Trading-Account. Because other Traders will start with different Account Size.
For Example:
MT4: https://www.mql5.com/en/market/product/52715
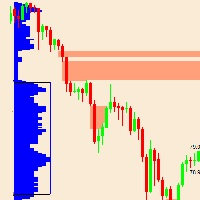
Dieser Indikator basiert auf der Marktprofiltheorie.
Was genau ist ein Singles-Bereich?
Theorie: Marktprofil Singles:
Einzelne oder einzelne Drucke oder Lücken des Profils werden im Inneren einer Profilstruktur platziert, nicht am oberen oder unteren Rand.
Sie werden mit einzelnen TPOs dargestellt, die auf dem Marktprofil abgedruckt sind.
Singles lenken unsere Aufmerksamkeit auf Orte, an denen sich der Preis sehr schnell bewegte (Imp

Description
Range Detector is an indicator that identifies ranges in the market and displays their presence on the price chart.
Recommendations
You can use this indicator to determine the flet and, accordingly, to determine the direction of opening a position or closing an opposite position.
Parameters
Maximum History Bars - maximum number of history bars for calculating the indicator. Average True Range Period - ATR indicator period (used to calculate the difference between mov
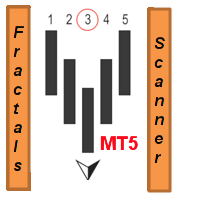
This multi time frame and multi symbol indicator identifies fractals patterns. As a bonus it can also scan for Parabolic SAR (pSAR) trend changes. Combined with your own rules and techniques, this indicator will allow you to create (or enhance) your own powerful system. Features
Can monitor all symbols visible in your Market Watch window at the same time. Apply the indicator to just one chart and instantly monitor the entire market. Can monitor every time frame, from M1 to MN, and sends you a r

Este Berater especialista é avançado com indicador de força que detekta a mudança de Momentum e corta a posição usando sua inteligência Onde gera Receita a longo prazo. O usuário pode alterar o tamanho do lote com base no cálculo de risco fornecido por nossa equipe. É diferente de outros EA onde für angemessene Para usabilidade de longo prazo com retornos anständige, isso deve ser execado em um período de Tempo de EURUSD 1 hora e os Kunden podem aumentar o tamanho do lote com base nos retornos.

Mercury MT5 it is a Secure Automated Software for trade Forex market and indices.The architecture is a Fully Automatic Autonomous Robot Expert. Mercury MT5 It is an advanced trading system. The system is ideal for consolidated market. You can download the demo and test it yourself.
Very stable growth curve as result of smart averaging techniques.
"Safety first" approach in development. Stress-tests on historical data for multiple pairs. Broker type: Low spread, f
Guten Tag.
CatchCandleLimitOrderOneSymbol - флэтовый Berater, um Bestellungen von den Grenzen des Kanals in der Mitte, läuft auf Pullbacks von der Unterstützung und des Widerstands, von der benutzerdefinierten Anzeige der Bandbreite der TMA, mit einer festen S/L und T/P. Berater für den Handel entwickelt von Ebenen wenn eine bestimmte Trendbewegung fehlen, und Sie im Zweifel über die Fortsetzung der Trends, die Ebenen verschieben sich automatisch den Preis nach den Grenzen des Kanals und warte

Excellent dashboard for market analytics. The panel helps to analyze the values of the RSI indicator and its signals.
With this panel you can: watch the current signal from RSI on all timeframes; watch the current signal from RSI by different symbols; watch the current RSI value; several types of signals for analytics.
Values in a table cell: RIS value.
Signal type: RSI crosses level buy out/level sell out (outside); RSI crosses level buy out/level sell out (inside);
RSI is u
This EA trades with the trend using several methods to identify and enter a trade. For example, it uses trendlines, Gator and Stochastic indicators to analyze the market. In addition to trading, it can also display trend lines that it trades based on. It has filters for ADX and MA indicators, as well as a sufficient number of settings to be able to optimize on various currency pairs and timeframes.
The EA sets stop loss and take profit for each trade, does not have risky trading methods. It i

FXC iCorrelatioN MT5 Indicator (Specialized for DAX - DowJones)
The indicator shows the correlation soefficient between two assets. Correlations are useful because they can indicate a predictive relationship that can be exploited in practice. The correlation coefficient shows the relationship between the two symbols. When the correlation is near 1.0, the symbols are moving togerhet in the same direction. When the correlation is near -1.0, the symbols are moving in opposite direction. Main featu

MultiPairs MT5 is a fully automated Expert Advisor. This expert advisor is based on Multi-currency strategy . This system analyzes the market volatility to find trading signals based on trend reversal strategies and is used to evaluate oversold and overbought market conditions. Swing trading is a short-medium speculation based on the buying-selling force in the trading market with an advantage and low risk with a trend reversal pattern. The Expert Advisor does not use martingale, grids, hedg

Horizontal Level indicator - reflects, using a histogram, the horizontal volumes of transactions at a certain price without reference to time. At the same time, the histogram appears directly in the terminal window, and each column of the volume is easily correlated with the quote value of the currency pair. The volume of transactions is of great importance in exchange trading, usually an increase in the number of concluded contracts confirms the trend, and their reduction indicates an imminent

Strategy is based on moving average analysis with the Timeframe H1.
It is a combination of powerful trading techniques.
The trading system is suitable for experienced traders and beginner.
The EA allows you to trade with a fixed lot size.
Recommended :
Recommended timeframe is H1.
Minimum account balance: $200.
Default parameters are for EURUSD.
Features :
The EA is not sensitive to spread or broker, you may chose any broker you trust to; The EA is very easy to setup and use.

EA made using combination of Pending Order and Martingale Strategy. Designed only to work best on Gold Spot M5. EA will put pending orders and on certain condition will create positions with bigger lot. This EA do not use Stop Loss due to the applied strategy. Stop Loss will be replaced using modified Take Profit.
Input Parameters 1. MaxOpenPositions : Define allowed positions can be open by EA, 0 will use default EA Value 2. TotalPendingOrders : Define allowed generated Pending order set, 0

ARSINIUM ist ein brandneuer Multi Strategy EA, mit dem Sie Ihre Einstiegspunkte wie ein PRO definieren können!
Ursprünglich wurde der EA als Scalper für M1-M15 entwickelt, aber wir haben gesehen, dass die Einstiegspunkte in Kombination mit einigen Filtern und anderen nützlichen Optionen mehr als "Einstiegspunkte" sind.
Es funktioniert unter vielen verschiedenen Bedingungen und hat viele verschiedene Strategien, die Sie selbst aufbauen können.
Testen Sie es selbst und finden Sie die beste

EA designed to generate pending orders based on the trend and designated take profit value. This EA designed exclusively to work best on GOLD SPOT M5 especially during up trend. User can freely decide to close the open position from this EA or wait until take profit hit. No parameters need to be set as it already set from the EA itself. This EA do not use Stop Loss due to the applied strategy. Please do fully backtest the EA on the worst condition before use on the real account. Recommended ini

It is very easy to use the Fibrillar indicator, since the simplest is to look at the chart and act according to the indications of the colored arrows. The algorithm takes into account the measurement of prices, and this method also focuses on measuring each of the price drops (H / C, H / O, LC, LO) - which gives more detailed information, but also more averaged.
When calculating this indicator, logarithmic gains are first calculated at the closing price, which allows you to filter out the tre

The fundamental technical indicator Ripple, allows you to assess the current market situation in order to enter the market of the selected currency pair in the trend and with minimal risk. It uses in its basis the process of identifying the rate of change in price growth and allows you to find points of entry and exit from the market.
This indicator was created on the basis of the original indicators of the search for extremes, the indicator is well suited for detecting a reversal or a large

Buy and sell signals based on Joe DiNapoli's shifted 3 period exponential moving average strategy for trend reversals.
Who is he? Joe DiNapoli is a professional trader and author that has been involved in the markets for more than 38 years. He is also a registered Commodity Trading Advisor (C.T.A.) for over 15 years and has taught his techniques in the major financial capitals of Europe, Asia, South Africa, the Middle East, Russia and in the United States.
How does the indicator work? The i
A trending strategy using a combination of two popular indicators Bollinger Bands and RSI provides reliable signals.
The logic of the advisor
Entering a short position is carried out when the price touches the upper Bollinger band, while the RSI indicator should be in the overbought zone, i.e. above level 70. Entering a long position is carried out when the price touches the lower Bollinger band, while the RSI indicator should be in the oversold zone, ie below level 30. It is possible to tr

Buy and sell signals based on the Continuous Point Setup for trend continuation, popularized in Brazil by Stormer and Palex.
How does it work? The indicator activates the buy signal when we have prices above the ascending 21-period Simple Moving Average (SMA21) followed by a pullback and a touch on it.
For a sell signal we need the prices below the descending SMA21 followed by a pullback and a touch on it.
How to use it? One way of using it, as suggested by Stormer, is to enter the

HUBBLE it is a Secure Automated Software for trade Forex market and indices.
The architecture is a Fully Automatic Autonomous Robot Expert capable of
Independently analyzing the market and making trading decisions
HUBBLE It is an advanced trading system. This is a fully automatic Expert Advisor.
HUBBLE It is a 100% automatic system, The system is self-sufficient, performing all the work. Is a revolution in the customization of the trading. You can download the demo and te
Der MetaTrader Market ist die beste Plattform für den Verkauf von Handelsroboter und technischen Indikatoren.
Sie brauchen nur ein gefragtes Programm für die MetaTrader Plattform schreiben und schön gestalten sowie eine Beschreibung hinzufügen. Wir helfen Ihnen, das Produkt im Market Service zu veröffentlichen, wo Millionen von MetaTrader Benutzern es kaufen können. Konzentrieren Sie sich auf dem Wesentlichen - schreiben Sie Programme für Autotrading.
Sie verpassen Handelsmöglichkeiten:
- Freie Handelsapplikationen
- Über 8.000 Signale zum Kopieren
- Wirtschaftsnachrichten für die Lage an den Finanzmärkte
Registrierung
Einloggen
Wenn Sie kein Benutzerkonto haben, registrieren Sie sich
Erlauben Sie die Verwendung von Cookies, um sich auf der Website MQL5.com anzumelden.
Bitte aktivieren Sie die notwendige Einstellung in Ihrem Browser, da Sie sich sonst nicht einloggen können.