Kostenpflichtige Handelsroboter und Indikatoren für den MetaTrader 5 - 75
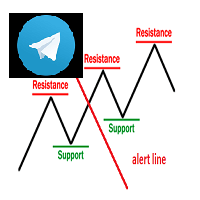
Keylevel and trendline Telegram reminder Having this EA, you do not need to standby on the screen to wait for price touch key level, trend line, or at 50 – 61.8 of Fibonacci retracement. All is automatic and it will notify you when need to take a look at the chart. EA will send you a screenshot through Telegram of the chart at the time of notification. This product can be used for every market, every instrument. The system auto draws and alerts when the price at a key level and at a Fibonacci r

One of the most famous phrases in the trading world is "The Trend Is Your Friend".
Trading following the current trend is one of the most successful ways in terms of probability. The hard part of it is to recognize when the market is trending or not.
that's the role of our indicator we called The Trend Is Your Friend Until It Is Not. Apart from its big name it is really easy to use and see when the market is trending or ranging. Through a little window of 3 colors you will identify if the ma

For anyone studying forex charts, the aim is to identify trends, and spot reversals. If you have years of experience it may be easy, but most of us need something to make the trend apparent. If you're familiar with the popular renko charting method, you know that it was developed for this purpose. But renko charting has a flaw; the trend is often broken by false reversals. So I developed my own version - the Kenko Trend Indicator. The kenko trend indicator draws renko style trend following block

Put to work now The Last Pharaon this incredible EA was carefully made and tested for the EUR / USD market exclusively in the 5m time frame, the purpose of this EA is to keep your capital safely behind this incredible EA and your account never reaches to $ 0.
This EA can be used with little capital $ 100, I have tested it with $ 50 and it works perfectly but it is advisable to start with a minimum of $ 100, I recommend using a VPS. You can also work a higher capital, you just have to raise the

Stable Signals is a simple indicator with simple and reliable signals. The first advantage a trader gets when using forex arrow indicators is convenience. There is no need to look for the intersection of moving averages or oscillator lines by straining your eyes and peering at the chart. It is enough to see 1-2 arrows - and this is already a signal. The good thing is that the arrow is colored. The trader is always looking for good indicators. It is very convenient to use arrow Forex indicators,

HLBand is an indicator which can show trend, volatility channels, and it has 3 line levels: upper, middle and lower.
HLBand MT5 version is a perfect translation of HLBand MT4, it works absolutely identical to MT4 version.
Indicators Inputs
BandPeriod - the period used for calculating values of bands. PriceField - the price used for calculations, it can have two values: 0:High/Low, 1:Close/Close.

Trailing Step, Trailing Stop and Stop Loss as we used see how Pro traders used to make consistent profit. Traders who prefer the Stop Loss and Trailing Step trading style can use this EA to power their trading strategy and leverage from the movement of the price towards the Take Profit line with the continuous movement of the SL line. What is special about this EA is that it will immediately open the next trade in the opposite direction once the price hits SL. The EA has a built-in News Filter,

RSI Arrow1 is an arrow indicator based on the RSI, is easy to use; no internal adjustments to be made. the user can change the indicator period as desired in the settings. It can be used on all markets but it will all depend on your Trade strategy. There is no better Time Frame for its use; the use will depend on the Trader himself.
Settings:
RSI Period Push Notification Email Notification Audible Alert Down levels Up levels

Finding the right trend is always one of the most important points of trading
If you agree with me then let's move on
How do we recognize the trend?
As you well know, one of the best and most widely used standard indicators is the ATR. There is no special magic
We try to identify the trend by calculating the amount of ATR and the amount of Multiplier.
You can use this indicator in all currencies and all time frames. Of course, note that the purpose of this indicator is to show the t

Automatically plots the 'Golden Fibonacci Ratio’ between the High and Low of the previous day... ...Highs and Lows are great Support and Resistance zones.
Breakouts of Fibonacci levels are key points for entry and exit of trades.
Pink lines indicate that the previous day's Candle closed lower. Blue colored lines indicate that the previous day's Candle closed higher.

TL/DR: Scalping with trend to ensure maximum profit and minimal drawdown. Try it, love it, own it.
Scalp Surgeon works with short time frame (5M) while having trend marker at higher time frame (30M~4H).
Users are allowed to play with MA to find the best parameter for their pairs: >> If you closed a trade too early while it is in trend? Reopen the trade at a better position than your closed position. >> Choose your take profit and stop loss level. >> Want less constraint? Change the % condit

Sends alert when price moves from the previous alarm price by predefined points (or bps). Four alarm modes: push notifications, pop-up, e-mail and / or FTP. Highly customizable alert text and user-configurable indicator color / width / style.
Input parameters: Alert offset, in points : Alert is triggered when price moves from the previous alert by predefined points (if the last alert has not been registered, the current price is used as the last alert). The alert price is updated automaticall
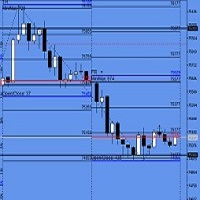
Open close levels.
Open close levels - is an indicator for MetaTrader 5, which displays High/Low, Open/Close, ATR levels (set manually) of the day, week, month on the chart. Marks round levels, signs the days of the week, numbers every week. All levels are marked with price tags with a price symbol. Also, the indicator automatically calculates and displays on the chart the distance that the price has passed from High to Low and from Open to Close by day, week and month.
The indicator di
This Expert Advisor Makes efficient use of market fluctuation using multiple criteria. Initial deposit value is criteria for final return of the EA. we recommend using at least $500. Along with increasing initial deposit value, it s recommended to increase trading lot size relatively. Other input parameters are optimized for GBPUSD. To be used for other pairs it must be optimized separately.

Version 1.0 The Trend Snatcher is Multi timeframe indicator that can be used to catch swings on the price market chart The indicator uses two lines that targets the highest buying and lowest selling levels , the signal indicated by the two lines crossing The indicator is suitable for scalping and Swing trading, It can also be used as additional Confluence to enter a trade when Price is at a significant level of supply and demand or Trendline touch
HOW IT WORKS? Buying : Place your Buy

HOL DIR ANDERE EAs KOSTENLOS!!! HOL DIR ANDERE EAs KOSTENLOS!!! HOL DIR ANDERE EAs KOSTENLOS!!! HOL DIR ANDERE EAs KOSTENLOS!!! HOL DIR ANDERE EAs KOSTENLOS!!!
RSI Grid basiert auf den überkauften und überverkauften Bedingungen des RSI und öffnet ein Grid, wenn der Trade auf der Verliererseite des Marktes steht. Der RSI liefert technischen Händlern Signale über bullisches und rückläufiges Preismomentum und wird oft unter dem Diagramm des Preises eines Vermögenswerts dargestellt. Ein Vermögens

An indicator of patterns #35 and #36 ("Pipe bottoms" and "Pipe tops") from Encyclopedia of Chart Patterns by Thomas N. Bulkowski. Parameters: Alerts - show alert when an arrow appears Push - send a push notification when an arrow appears (requires configuration in the terminal) PeriodBars - An indicator period (number of bars that form a top/a bottom) K1 - an additional parameter that influences the accuracy of pattern shape recognition K2 - an additional parameter that influences the accuracy

Taka Taka Scalper Pro is a simple expert advisor that can be configured according to moving averages signals, such as triple, double or exponential moving average . Trigger signals are configured when these averages crosses. Besides, there is a important ATR filter to trade only on such volatility. A trend filter can also be configured according to averages. Takeprofit and stoploss are calculated according to ATR multiplier , even for long or short trades. You can also configure a non scalper mo

Half Trend TPSL Buy Sell Indicator calculates the open and close of the price bars over the selected period of time and applies its own calculation method to find an average line of the price movement. ATR based Take Profit and Stop Loss ATR is a measure of volatility over a specified period of time. The most common length is 14, which is also a common length for oscillators, such as the relative strength index (RSI) and stochastics. A higher ATR indicates a more volatile market, while a lowe

EA Gold River was created specifically for trading on gold (XAUUSD) time frame M5-H1.
EA Gold River uses signals from a unique Gold River indicator (you do not need to buy separately, the indicator is built into the Expert Advisor).
I will not show beautiful drawn screenshots and super edited videos. If you are using my EA TradeBooster , then you will like EA Gold River .
The standard set is good for trading, but you can always come up with your own set for higher profits.
Happy Trades

Der Indikator bewertet den Grad der Preisvolatilität und identifiziert die Komponenten, die zu Wachstum und Rückgang führen. Mit Variativity können Sie bestimmen, wo sich die Bewegung ändert, gute Zeiten, um mit dem Trend oder gegen den Trend zu handeln. Begleiten Sie offene Transaktionen. Anzeige
Der Indikator zeigt 3 Zeilen an: VARIATIVITY - dünne graue Linie. Gesamtpreisvolatilität. Das Wachstum der Linie zeigt eine Zunahme der Marktaktivität an. Der Rückgang deutet auf die Möglichkeit eines

What do you expect from a robot? Check out the live accounts and see for yourself! Live - EURUSD - Agressive Live - EURUSD - Moderate Live - EURUSD - Light Live - Multiple currencies SIMPLE AND PROFITABLE!
Kraken FX uses scalper and martingale techniques in addition to RSI and Volume indicators to trade.
Recommended currencies: AUDCAD, EURAUD, EURGBP, EURUSD, GBPCAD, GBPUSD e USDCHF Recommended timeframe: H1
Click here for the latest sets

Multi Time Frame Sub Panel for MT5. Monitor multiple time frames from a single chart window.
Here are some of the options available with the MTF Moving Average: Select the timeframes to be displayed (can manually type in other TF's) Customize the amount of timeframes to be displayed Define the width (number of bars) for each timeframe box Modify all the colors Display two moving averages
MTF, MA, Multi-TF, Multiple TF, Moving Average, SubPanel, Sub-panel,

One Period EA is the expert advisor that uses only ONE PERIOD to be configured on Diretional Movement Index DMI . Besides this, ATR indicator must be configured to filter some trades and to calculate Takeprofit and Stoploss , either for long or short trades. A partial execution system can be optimized to save profits. Autolot function and number of opened orders and spread can also be optimized. Optimized EA is on EURUSD , H1 . Please download it and don´t let to try and test other EA on my prof

There is a very simple rule
It is Always difficult to cross high pressure areas and easy to cross low pressure areas
MT4 version is available here
This is definitely true for price
It was so simple, it was not!
So let's get started
This indicator shows you the amount of pressure in that area according to the bars that it shows. The longer the bar, the higher the pressure in that area It also marks the most pressed area with a rectangle
From now on you can simply decide on the

No! These are not the 'Bollinger Band'.
Identifies the CONTINUITY of the movement between High, Low and Closing. The 'two bands' in one color signal the CONTINUITY of bull or bear movement. With this tool, following the price direction, it was easy even for those who are Café com Leite in the Market!
Remember if: All our tools work together, exclusive indicators and risk management robot.
They automatically identify the different patterns in the Mini-Index dynamics as well as manage our o

Quando você abrir uma operação, mover o Stop Loss para o ponto de entrada (Break-Even) sempre que a operação andar favoravelmente 75 pontos, é uma obrigação! Isto significa que, quando sua operação atingir 75pts você moverá o Stop Loss para 10pts do ponto de entrada, desta forma, basicamente você vai colocar o Stop Loss em um preço 'melhor' que o preço de entrada (Break Even), ou seja, no lucro. Na pior das hipóteses, você sairá no “zero a zero”. A ideia é não deixar que uma operação parcialment

Counts the lifetime of Candle Extra until its closing.
It is used to assist in the entry of operations... ...We operate at the close of one-minute Candles, that is, when the timer is at 00:xx:01. We open an order, and the value of that operation is also displayed by the tool.
Extra: To 'unlock' the price scale. Double click on the scale and the graph will be 'horizontally centered'. In addition to allowing the expansion and contraction of the price scale, we can navigate the chart by dra
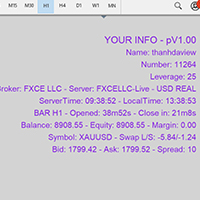
Show Account Information Custom showing your MT5 account information Indicators add account information to chart. Profit, Balance, Equity, Free Margin, Margin and Margin Level % Profit.... Hide account information: Click anywhere on account information text.
The hide/show response is dependent on incoming ticks or chart refresh. In tick scarce or closed markets the indicator hide/show click will appear not to function while waiting for a tick or chart refresh. It is only necessary to att

Kroko Trader EA is a trading system that uses William´s Alligator indicator as trend and trigger signals. Also, as a filter, ATR can be configured to trade only in certain volatility. Takeprofit and Stoploss are calculated according to multiplier of ATR values, resulting in a dynamic stop function. Optimized EA was on EURUSD , H1 . But, it´s possible to optimize on other timeframes and currencies, such as EURUSD , M15 Scalper . Please download it and don´t let to test other expert advisors of my

Einführung Dies ist ein Indikator für die tägliche Rentabilität
Charakteristisch Statistiken können auf Währung, magischer Zahl und Notizen basieren Statistiken können auf Zeit basieren Verfügbar für alle Währungen, alle Zeiträume Es gibt weiße und schwarze Themen Sortierung umkehren Die Bildwiederholrate kann angepasst werden Sie können die Aktualisierungszeit auf den neuesten Stand setzen Parameter nD = 30; // Anzahl der Tage Startzeit

A lot of professional traders use high quality divergence signals as a part of their strategy to enter a position. Spotting correct divergences quickly can often be hard, especially if your eye isn’t trained for it yet. For this reason we’ve created a series of easy to use professional oscillator divergence indicators that are very customisable so you get only the signals you want to trade. We have this divergence indicator for RSI, MACD, Stochastics, CCI and OBV. RSI: https://www.mql5.com/en/

Description
This is a utility tool for MT5, and it exerts a strong power for entry operations and fund management in discretionary trading. Although the standard trading panel provided by MT5 is very simple, it lacks some features that are considered particularly important for discretionary trading.
This tool compensates for the lack of functions, but we have paid close attention not to implement excessive functions.
Benefits of the Flexible Trading And Money Management MT5 Simple and Intu

Description
This is a Utility tool for MT5 which will keep us away from a chart in a nice manner, letting us know only a good trading opportunity. It is said that from novice to experts, one of the common and obviously the most important things to do is to “WAIT” for good trading opportunities to come. On the other hand, it is not always that case that we are sitting in front of the chart when the trading opportunity comes. Thinking about chart analysis, at the same time, major tools used t

Description This is a Utility tool for MT5 which will make our chart analysis task quite more efficient and save large amount of time. As for chart analysis, some are watching out several symbol simultaneously with single timeframe and others are trading only one single pair with multi timeframe analysis. For both, a common troublesome issue is “scroll chart to look back” or “draw chart objects” in multi charts at the same time. Especially for those who are trading with multi timeframe soluti

Plumbum This is a grid Expert Advisor. It detects the most probable points of stop/pullback/reverse of a trend and places a grid of limit orders. Uses the Martingale system. Uses stop losses. That is why long waiting out for unprofitable positions is out of the question. Optimize the EA on open prices (it works with open prices)
Settings: CommentToOrder - comment to orders; start_lot - initial lot; distance - distance between limit orders in points; level - number of pending orders; multiplier

Madx Cobra Madx Cobra Indicator. Create to traders both experienced and inexperienced to use it because it is a basic indicator
How to use : Setting Indicator 1. MA Fast : Moving Average fast (10) 2. MA Slow : Moving Average Slow control trend markets.(200) 3. ADX : Control trend(5) 4. For alert you can set to alert Next bar or instant bars.
When arrow sky blue show or arrow up, you can entry order "Buy" or "Long" and arrow red show or arrow down, you can entry order "Sell" or "Short"

The indicator automatically calculates the level and real volume Point of control, and also displays the market profile for an array of candles, within the boundaries of a rectangle. If your strategy is based on taking profit on a rebound from price accumulations, the Range profile indicator will become the main tool in scalping trading. Point of control is calculated based on the total volume for each tick or minute candles, depending on the settings and trading timeframe. In the abse

A lot of professional traders use high quality divergence signals as a part of their strategy to enter a position. Spotting correct divergences quickly can often be hard, especially if your eye isn’t trained for it yet. For this reason we’ve created a series of easy to use professional oscillator divergence indicators that are very customisable so you get only the signals you want to trade. We have this divergence indicator for RSI, MACD, Stochastics, CCI and OBV. RSI: https://www.mql5.com/en/

A lot of professional traders use high quality divergence signals as a part of their strategy to enter a position. Spotting correct divergences quickly can often be hard, especially if your eye isn’t trained for it yet. For this reason we’ve created a series of easy to use professional oscillator divergence indicators that are very customisable so you get only the signals you want to trade. We have this divergence indicator for RSI, MACD, Stochastics, CCI and OBV. RSI: https://www.mql5.com/en/

A lot of professional traders use high quality divergence signals as a part of their strategy to enter a position. Spotting correct divergences quickly can often be hard, especially if your eye isn’t trained for it yet. For this reason we’ve created a series of easy to use professional oscillator divergence indicators that are very customisable so you get only the signals you want to trade. We have this divergence indicator for RSI, MACD, Stochastics, CCI and OBV. RSI: https://www.mql5.com/en/
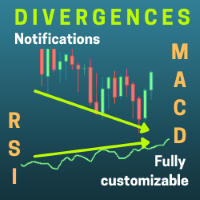
This expert advisor finds divergences and opens a buy or sell position taking into account the input parameters set by the user. Positions are opened once the divergence is detected and the pullback signal is triggered. The condition for a divergence to occur, is that the price moves in a different direction to the MACD and RSI. The type of divergences and the frequency at which they are detected depends entirely on the inputs entered by the user.
Features Functional for any symbol or period

A lot of professional traders use high quality divergence signals as a part of their strategy to enter a position. Spotting correct divergences quickly can often be hard, especially if your eye isn’t trained for it yet. For this reason we’ve created a series of easy to use professional oscillator divergence indicators that are very customisable so you get only the signals you want to trade. We have this divergence indicator for RSI, MACD, Stochastics, CCI and OBV. RSI: https://www.mql5.com/en/ma

Simple and fast MACD oscillator with MACD and signal lines and two-color histogram.
I wasn't happy with the Meta Trader MACD oscillator as it's not immediate to read and the other ones I tried felt a bit laggy or added unneeded features on top, so I decide to make one that feels familiar to me. I hope you will find it useful!
Contact me for any issues or bugs and I will try to help the best I can.

Midnight Scalper is based on a sound trading principle. It is made to trade during times when the market is at low volatility. From 23:00 to 00:00 is best. It uses multiple indicators for precise entry and exits with a basic fixed stop loss and take profit as part of its money management strategy.It does not put your funds at high risk with such methods as martingale, grid, averaging positions or no stop loss trading. ECN broker is required with a tight spread and low commission. NOTE : After a

Master MA EA MT5 is an advisor with an adaptive system for "Resolving" a basket of orders can also be used to restore unprofitable positions on the account. The signal uses the direction of the exponential moving averages, average daily volatility, then builds an order grid if the price deviates. The grid step is configurable, and if the price goes against us, then after a certain number of orders, the account recovery function (Drawdown Reduction) is activated, the most distant unprofitab
Signal AO is a simple informational utility. It gives a signal about crossing the zero mark by the Awesome Oscillator (AO) indicator.
Signals will be received depending on the chart on which the utility is located.
The settings are pretty simple:
SYGNAL TYPE: ALERT - The signal gives alert. SOUND - Voice notification. ALERT_AND_SOUND - Alert together with voice notification.
LANGUAGE: Select the language in which the Signal AO will communicate.

Average True Range (ATR) ist ein häufig verwendeter Indikator, der das Ausmaß der Preisbewegung über eine festgelegte Dauer misst. Der Wert, den es gibt, ist jedoch nicht innerhalb irgendeiner Grenze definiert, was es fast unmöglich macht, es für etwas anderes als Stop-Loss- oder Take-Profit-Berechnungen zu verwenden. Dieser Indikator ist Ihr Standard-ATR-Indikator, aber wir haben Perzentil-Abgrenzungen eingeführt, damit Sie die Extreme sehen können. Sie können zwischen Perzentilen und etwas wäh
3 standard indicators are used within this expert advisor and all their parameters are configurable and optimizable . The default settings are set for the GbpUsd pair on M15 timeframe , more settings can be found in #Post 1 in the Comments section of the product . Results are obtained using the combined power of the 3 standard indicators ( MACD , Moving Average and Stochastic ) by using diferrent decision power of the indicators and optimized values of each indicator setting . Only one order at

Violet Panther Scalper MT5 is specially designed to work as scalper and a trend trade system. Panther strategy is based on two moving average crosses and candlestick reader relative to theses averages. A trade in filter based on ATR values can be configured to make EA works only on true trends. So, if trigger condition is true, Panther strat to trade on each new condition achieved. An aditional trend filter can be configured based on TRIX indicator , making possible to confirm such trend behavio

////////////////////////////////////////////////// / ////////////////////////////////// Dieser Indikator zeigt einen nichtlinearen Polynom-Regressionskanal an. Es funktioniert sehr schnell wie der Blitz. Insbesondere bei Verwendung der OpenCL-Beschleunigungstechnologie. Eine spezielle Version dieses Indikators wird in Kürze verfügbar sein, die auch den Preis für einige Zeit im Voraus vorhersagt. Dies sind adaptive und glatte farbige Linien. Für diesen Indikator gibt es vier Optionen: 1) 1 Sekun

Spannenerschöpfung tritt auf, wenn der Preis die erwartete Spanne für den aktuellen Zeitraum erreicht oder überschreitet. Auf diesen Niveaus beginnt der Preis im Vergleich zu früher im Berichtszeitraum an Dynamik zu verlieren, daher ist es ein guter Zeitpunkt, um sicherzustellen, dass Sie keine neuen Positionen eingehen. Dieser Indikator zeigt Ihnen, wo dies in Ihrem Diagramm wahrscheinlich passieren wird, und zeigt die Niveaus für tägliche, wöchentliche und monatliche Zeiträume an. Wenn Sie seh

One of the best tools for analyzing volume, Weis Wave was devised by David Weis to facilitate reading the directional flow.
For the disciples of the Wyckoff method, this means an evolution, facilitating a predictive reading of the market, always looking for Accumulation and Distribution zones for traded assets.
For better understanding, in this indicator we try to cover every reading of EFFORT (traded volume) versus RESULT (price change). Thus, you can apply the indicator on the chart twice

1 Tag Aktionspreis: $49 Aktivierung: 30
10 Tage Aktionspreis: $59 Aktivierung: 20 Einführung Schnellansicht
Überprüfen Sie schnell die Rentabilität für einen bestimmten Zeitraum und zeigen Sie die Statistiken an
Filtern Sie schnell historische Transaktionen und erstellen Sie Statistiken basierend auf Zeit, magischer Zahl, Währung und Kommentaren
Die Statistiken umfassen Nettogewinn, LotTotal, Gewinnfaktor, Short Trades (Gewinn %), Long Trades (Gewinn %), Average Profit Trade usw.
Aktu

Why choose GBot? Very fruitful EA that trades gold, it can be tested in this site and contact me if you need the source code and the application file. The strategy used is used internally with minimum data to be as input from the user. In the past 10 years the EA has been able to maintain the minimum of 30% return per month. Well in the past 3 - 5 years it obtained very impressive results. The maximum balance drawdown in the past 10 years has been around 5 %. Advantages Controlled risk. Good ret

/////////////////////////////////////////////// // /////////////////////////////////
Dieser Indikator zeigt die Bandbreite der Preisänderungen in 1 Minute an. Großartig für das Risikomanagement. Dies ist eine verbesserte Version des standardmäßigen Average True Range Indikators für Tick Chart.
Dies ist nun die doppelte Genauigkeit und eine farbige Mittelungslinie.
Die Einstellung ist recht einfach - Sie müssen nur die Farben bei Bedarf ändern.
Es ist sehr einfach, die Messwerte dieses I

/////////////////////////////////////////////// // /////////////////////////////////
Eine verbesserte Version des standardmäßigen Average True Range Indikators.
Dies ist nun die doppelte Genauigkeit und eine farbige Mittelungslinie.
Die Einrichtung ist recht einfach - Sie müssen den Hauptzeitraum und den Mittelungszeitraum angeben.
Es ist sehr einfach, die Messwerte dieses Indikators zu verstehen, die Bedeutung ist die gleiche wie die des standardmäßigen Average True Range.
//////////

(Krypto-Währungsdiagramme)
Es bringt die Historie so viel wie die Anzahl der von Ihnen angegebenen Balken und beginnt, die sofortigen Daten direkt anzuzeigen.
Bietet die Möglichkeit, in allen Zeitrahmen zu arbeiten.
Ermöglicht das Arbeiten mit mehreren Symbolen.
Diese App ist ein Hintergrunddienst.
Es lädt den Verlauf aller Symbole herunter, die mit "S" auf dem Marktbeobachtungsbildschirm beginnen, und zeigt die Ticks-Daten an.
Überträgt automatisch Echtzeit-Handelsdaten von

You can't stop the market, but now you can get out of it with a button! The market doesn't stop for anyone, it doesn't take a break and doesn't have pity on those who sleep. Closing your open trades manually can be time-consuming and take a precious part of your capital, that's why we've launched the Emergency Stop Button, a high-tech emergency button that closes all open trades with just one tap.
Smart shutdown technology Built with advanced coding, only with native MQL5 commands, avoiding i

Binance ist eine weltbekannte Kryptowährungsbörse! Um die Verfolgung von Tiefeninformationen und Tick-Änderungen zu erleichtern, bietet das Programm die folgenden Funktionen:
1. Importieren Sie automatisch alle Handelsvarianten in die Binance USD-M-Futures-Handelszone mit anpassbaren Produktpräfixen (um Konflikte mit bestehenden Produktnamen zu vermeiden) oder benutzerdefinierten Import bestimmter Varianten;
2. Verwenden Sie Websocket, um den Handel mit Binance-Futures zu verknüpfen, und de

Binary MA Cross MA Cross indicator by 4Umbella
Create for traders both experienced and inexperienced to use it because it is a basic indicator
How to use : 1. MA Fast : Moving Average fast (Period 4 upto 50) 2. MA Middle : Moving Average Middle (Period 10 upto 100) 3. MA Slow : Moving Average Slow (Period 50 upto 200) to control trend markets.
and trader can be set for Apply to price (Close, Open,Low,High,Median,Typical,weightd)
For alert you can set to alert Next bar or instant bar

Description
Trend Influencer is an indicator that determines the potential dynamics of the influence of trend wave movements on the market. The indicator is based on the value of moving averages corrected by the standard deviation. The indicator is displayed as a main dash-dotted moving average and a signal solid moving average. The signal moving average is colored blue or red depending on what type of trend is currently observed in the market. The indicator also draws inhibition levels - blue

Dies ist ein Tick-Chart im zweiten Format. Es gibt Unterstützung für OpenCL. Die Einstellungen sind sehr einfach - Sie können die Wochentage auswählen, für die der Indikator berechnet wird: Beispielsweise müssen Sie für solche Finanzinstrumente, deren Kurse am Wochenende nicht aktualisiert werden, jeden anderen Wochentag für den 6. und 7. Tag auswählen, aber beispielsweise für Bitcoin, wenn der Broker die Kurse aktualisiert, können Sie dies tun Geben Sie für den 6. Tag - Samstag und für den 7.
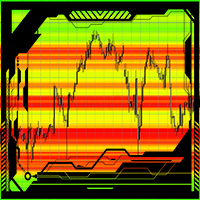
J.M.T.I
This indicator automatically shows a level or support and resistance in the currant market. Can be used on any time frame Can be used on any currency pair Works on the active bars in the window To add more bars one can simply zoom out. Red zones can be strong liquidity pools. Green zones usually is where an possible break out might occur. The higher the contrast of the colors the stronger the support or resistance levels will be. The indicator has an option to refresh on each tick
OCTOBER SALE!!! OCTOBER SALE!!! OCTOBER SALE!!!
Heiken Ashi Short Grid is an EA that is using the Heiken Ashi Indicator for the initial trade and uses grid trades when the the trade is on the losing side.
OPTIMIZED SETTINGS ARE AVAILABLE IN THE COMMENT SECTION!!! Optimized Currency Pairs: - AUDCAD - USDCAD - AUDUSD
Parameters: - Initial Volume 1 = 0.01 Lot will not open a martingale system 3 = 0.03 Lot for every $10,000 - Grid Size - Multiplier - Take Profit HEIKEN ASHI SETT

Das arithmetische Mittel oder Median kann verwendet werden, um das Maß für den zentralen Trend einer Zeitreihe zu bestimmen. Beide Methoden haben einige Nachteile. Das arithmetische Mittel wird durch den Indikator Simple Moving Average berechnet. Es ist empfindlich gegenüber Emissionen und Geräuschen. Der Median verhält sich stabiler, aber an den Grenzen des Intervalls kommt es zu einem Informationsverlust. Um diese Nachteile zu verringern, kann eine Pseudo-Median-Signalfilterung verwendet werd
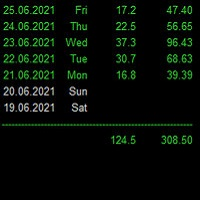
Statistics for each day
Индикатор показывает статистику - итоговую конечную прибыль/убыток по каждому отдельному торговому дню с учетом свопов и комиссий. Параметры : Dey - количество анализируемых дней; Weekday color - цвет будних дней; Weekend color - цвет выходных дней; Loss color - цвет убытка; font_size - размер шрифта; font_face - название шрифта; Для удобства просмотра статистики за большие временные периоды, при инициализации индикатор выгружает данные в Statistics.csv
Созданный файл и

O Indicador BOPCoiote é uma releitura do indicador Balance of Power proposto por Igor Livshin em Agosto de 2001, publicado na Stocks and Commodities Magazine. Uma média móvel de 14 períodos é recomendada para gráficos diários. Embora o número de períodos possa variar dependendo da natureza do mercado e dos prazos.
O nível em que ele agrupa seus fundos e topos é considerado uma das propriedades mais importantes do indicador BOP.
Durante as tendências de alta, suas máximas frequentemente tocam

Super Bollinger EA is an exclusive expert advisor that uses Bollinger Bands as indicator. It´s possible to configure the EA to trade as a low frequency or high frequency one - Scalping expert advisor. A Stochastic Oscillator filter is implemented to have some specific trades on Bollinger Bands. Takeprofit and Stoploss are calculated according to Bollinger Bands width or even with fixed TP and SL ( in points ). A trail and trade out system can also be configured and optimized. A number of orders

EMA Crossover Pro MT5 this EA uses two exponential moving average crossover, a slow ema, and a fast ema on which it takes buy/sell decision.
A default ema configuration is 12 and 35 where 12 is the value of slow ema, and 35 is the value of fast ema.
Expert advisor parameters:
stop loss (greater than 40, but some brokers accept stop loss under 40)
take profit (greater than 40, but some brokers accept stop loss under 40)
trailing_stop (set it as 0 for disabling trailing stop)
slow ema (21 by
Erfahren Sie, wie man einen Handelsroboter im MetaTrader AppStore, dem Shop für Applikationen für die MetaTrader Handelsplattform, kaufen kann.
Das Zahlungssystem der MQL5.community ermöglicht Zahlungen mit PayPal, Kreditkarten und den gängigen Zahlungssystemen. Wir empfehlen Ihnen eindringlich, Handelsroboter vor dem Kauf zu testen, um eine bessere Vorstellung von dem Produkt zu bekommen.
Sie verpassen Handelsmöglichkeiten:
- Freie Handelsapplikationen
- Über 8.000 Signale zum Kopieren
- Wirtschaftsnachrichten für die Lage an den Finanzmärkte
Registrierung
Einloggen
Wenn Sie kein Benutzerkonto haben, registrieren Sie sich
Erlauben Sie die Verwendung von Cookies, um sich auf der Website MQL5.com anzumelden.
Bitte aktivieren Sie die notwendige Einstellung in Ihrem Browser, da Sie sich sonst nicht einloggen können.