Kostenpflichtige Handelsroboter und Indikatoren für den MetaTrader 5 - 163
KT Round Numbers plots the round number levels which are also commonly known as psychological levels in the Forex world. In the context of Forex trading, round number levels are those levels in which there are two or more zeroes at the end. They are named as 00 levels on the chart.
Some traders also consider the halfway points as a valid round number level. They are named as 50 levels on the chart.
Use of round number levels in trading Round number levels work as strong support and resistance

Create your own trading expert without programming skills! It is easy and simple. This panel is a designer of Expert Advisors (like Wizard).
This Wizard contains: 57 signals (regularly add new) several Trailing Stop systems (including Trailing by Bollinger Bands)
How create EA easy: Choose 1 signal Choose no more than 3 filters Choose the Trailing system Save the ".set" file - by one button Ready. Run this expert with the desired set.
Interesting: "invisible" (virtual) levels StopLoss and T

Statistic Candles. Утилита для получения статистики с графика "Японские свечи".
Статистика собирается нижеописанными методами.
Выполняет следующие функции: Подсчёт свечей на 19-ти таймфреймах (внутридневные свечи): Количества бычьих и медвежьих свечей в указанном промежутке дат. Количества бычьих и медвежьих свечей в указанном промежутке дат в обозначенное время. Подсчёт количества нестандартных свечей (прим.: Custom _ time = 14:56, Period _ time = 1 H ). Данные средних значений open - close

Вертикальная гистограмма объема - отображает распределение объема по уровням. Гистограмма рассчитывается от объема ( реального или тикового), при этом объем соответствующий бару переносится на уровень H-L бара.
Таким образом, при распределении объема за сутки по вертикали - формируются максимумы гистограммы показывающие области проторговки. Настройки индикатора: Timeframe Set - период в пределах которого производится расчет. (рекомендуется D1) Step's - количество отображаемых периодов. Amplitu

Bober Lannister MT5 - is fully automated trading robot. This robot exists more than 3 years and proved its work on a long term distance.
The thing is many of night scalpers on mql5 market place has been made by newbies without proper researches . Don't be fooled by beautiful tester pictures or short term results.
Why Bober Lannister MT5 better then other night scalpers on mql5 market?
-It trades in a wide range of night time 3-6 hours per day. (not just 1 hour catching swaps/high spread

KT Heiken Ashi Smoothed is a smoothed version of the standard Heiken Ashi. Moreover, it also plots buy/sell arrows on a trend change. A buy arrow is plotted when it change to a bullish state from bearish state. A sell arrow is plotted when it change to a bearish state from bullish state. Mobile notifications, Email, Sound and Pop-up alerts included.
What exactly is Heiken Ashi Smoothed? It filters out the false signals and noise in the standard Heiken Ashi. It applies the set of two moving ave

We present you a very reliable expert system. The expert system is based on the AC indicator. This indicator generates very reliable signals!
The AC indicator measures the speed of the market’s driving force by subtracting the slow moving average from the fast and then subtracting the fast moving average from this difference. This indicator, despite the present averaging model, can be classified as leading, since it measures precisely the driving force, which first slows down and then changes
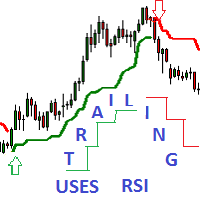
Adaptive Trailing uses RSI Indicator - an indicator of directional movement that allows you to determine the trend at the time of its inception and set the levels of a protective stop.
Trailing can be carried out both from below, when the stop level is below the current price and is pulled up behind the price if it increases, and above, when stop levels are above the current price.
There are two modes for calculating the stop level. Simple trailing is done with a constant distance of Npoints

Using this indicator, you can anticipate the future price behavior of a certain number of bars. The indicator draws a line showing simulated future price values. You can use this information both for entering / exiting the market. So for the installation / correction of stops accompanying the position.
The indicator has several parameters. HistoricBars - The number of historical bars to analyze. FutureBars - The number of bars to predict the price. Prediction - prediction depth coefficient.

Появилось желание торговать движение, пробой на самой высокой волатильности, или запустить советника-усреднителя торговать боковик в тихой низковолатильной гавани тогда этот продукт для Вас! Индикатор анализирует 28 валютных пар (основные и кроссы) и в зависимости от выбранных настроек покажет самые высоковолатильные (max) или наоборот (min). Как измерить волатильность? Существует 2 способа. Первый это измерить рендж заданного количества последних баров (bar). Второй замерить о

Navigators is a great tool for detecting peaks and valleys on a chart. This indicator uses a modified peak and trough detection algorithm. This algorithm includes the Fractals indicator and the ZigZag indicator.
This tool should be used to analyze peaks and valleys, as well as to detect patterns, or for other purposes. You can use this powerful tool for your own purposes at your own risk.

KT CCI Divergence shows the regular and hidden divergence created between the price and CCI oscillator. Divergence is one of the vital signals that depicts the upcoming price reversal in the market. Manually spotting the divergence between price and CCI can be a hectic and ambiguous task.
Limitations of KT CCI Divergence
Using the CCI divergence as a standalone entry signal can be risky. Every divergence can't be interpreted as a strong reversal signal. For better results, try to combine it w

Indicator designed to give investors the advantage of identifying strong candlestick patterns in real time by staining candlesticks representing these patterns, using possible buy or sell performance. The color for each pattern identified by the parameter indicator according to your taste. The candlestick patterns identified by this indicator are: Inside Bar Closing Price Reverse Top (PFRA)
Closing Price Reverse Bottom (PFRB) Dave Landry Bullish Engulf Bearish Engulf Advantages: Real Time At eac
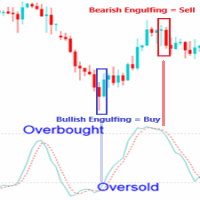
EXPERT ADVISOR DESCRIPTION
- Expert Advisor Engulfing in OBOS (Overbought Oversold) is an expert advisor consisting of a combined candle engulfing pattern and Stochastic Oscillator indicators. A Buy position occurs when engulfing are formed when the signal stochastic indicator is in the oversold area, A sell position occurs when engulfing are formed when the signal stochastic indicator is in the overbought area. - You can combine engulfing that form in certain timeframes with a signal stochast

Trailing Uses Standard Deviation.
A daptive_Trailing_uses_StdDev_Indicator is an indicator of directional movement that allows you to identify a trend at the time of its inception and set the levels of a protective stop.
Unlike trailing with a constant distance, the indicator uses the distance to the price proportional to the current standard deviation of StdDev. The distance is equal to the product of the standard deviation and the constant coefficient set by the user.
Thus, the trailing

This is a multicurrency and multitimeframe indicator that calculates the angle between two points. Points for measuring the angle can be taken from the ZigZag (the last two points), or from the Moving Average (between two given bars), or it can be the closing prices of bars.
Angle measurement is possible in degrees or in radians. You can select the scale for the calculation. For a better understanding of the indicator, you can study the free Angle High Low indicator. In the parameters you can
This bot can classify ticks into classes from 0 to 64, after which after analyzing the tick micro-signals it determines which way to open a position. You can work with an expert only on real ticks how to optimize and test!
When working, an expert uses position accounting in any mode, both netting (there can be only one position for one symbol) and with independent position accounting or hedging (there can be many positions for one symbol).
Configurable bot parameters TypeFilling - Type of exe
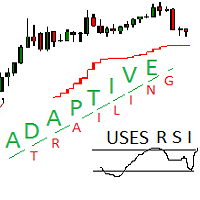
Adaptive trailing uses rsi
Adaptive trailing uses rsi - это скрипт, который реализует трейлинг, а именно: вычисляет уровень защитного стопа, отображает уровни на графике, исполняет заданные пользователем торговые операции при достижении ценой стоп уровня. Режимы работы. Трейлинг может осуществляться как снизу, когда уровень стопа ниже текущей цены и подтягивается за ценой, если она возрастает, так и сверху, когда уровни стопа выше текущей цены. Предусмотрено два режима расчета стоп уровня .

MTF qristalium Arrows Indikator ist ein halbautomatisches fertiges Handelssystem. Funktioniert auf allen Währungspaaren.
Der Indikator umfasst drei Regeln: 1)wir handeln nur nach dem Trend, 2)"kaufen, wenn alle verkaufen und verkaufen, wenn alle kaufen", 3) der Preis geht immer gegen die Menge.
Der MTF Qristalium Arrows-Indikator filtert Regeldaten über mehrere Zeitrahmen mit integrierten Indikatoren. Wenn der Trend in den ausgewählten Zeitabschnitten übereinstimmt, wird der Indikator ei

This bot is based on the analysis of adaptive moving averages. The expert is characterized by stable signals, which can be used as accurate short-term signals. This is a semi-scalping system that analyzes the market using reliable indicators. Scalper is a system or not, depends on the parameters TakeProfit and StopLoss . Using this adviser, you need to understand that this bot requires optimization. The bot works both on netting accounts and on hedging accounts. But the settings must be optimiz

Bei Handelsentscheidungen ist es sinnvoll, sich nicht nur auf historische Daten, sondern auch auf die aktuelle Marktsituation zu verlassen. Um die Überwachung der aktuellen Trends in der Marktbewegung zu vereinfachen, können Sie den AIS Current Price Filter -Indikator verwenden. Dieser Indikator berücksichtigt nur die wichtigsten Preisänderungen in die eine oder andere Richtung. Dank dessen ist es möglich, kurzfristige Trends in naher Zukunft vorherzusagen - egal wie sich die aktuelle Marktsi

DER GRUNDGEDANKE. Erstens ist dies die zweite einer EA-Familie, die auf derselben Strategie basiert, die auf verschiedene Indikatoren angewendet wird. Dies bedeutet, dass dieselbe Strategie und dasselbe Geldmanagement auf verschiedene Indikatoren mit Spread-Main-Filterung angewendet wird. Letztendlich ist es das Ziel, einen EA mit einer möglichen höheren Erfolgsrate und insgesamt geringsten Verlusten zu entwerfen. Diese Besonderheit wird das Vertrauen in die EA-Nutzung für eine langfristige Zuf

Indicator SR levels true in small time frames is very useful for scalping while in bigger ones it is good for day or position trading.
SR levels true can draw 4 support/resistance levels based on defined maximum rebouds from price level. Indicator scans defined number of bars in time axis and defined number of pips in price axis (both sides - up and down) and calculates how much times price was rejected from scanned price levels. At the price levels where maximum rebounds are counted, support

Nachhaltige Ausschüttungen können zur Glättung von Finanzserien eingesetzt werden. Da zur Berechnung der Verteilungsparameter eine relativ tiefe Historie verwendet werden kann, kann eine solche Glättung in einigen Fällen im Vergleich zu anderen Methoden sogar noch effektiver sein.
Die Abbildung zeigt beispielhaft die Verteilung der Eröffnungskurse des Währungspaares EUR-USD im ersten Halbjahr über zehn Jahre (Abbildung 1). Es sieht faszinierend aus, nicht wahr?
Die Hauptidee, die diesem Ind

Expert Advisor Raikow FX EA operates using the Vegas Tunel strategy, which consists of fibonacci levels above and below the 169 period moving average. It can operate on trend and counter trend.
It has margin control, open order limit, positive swap control and filter indicators like RSI and ADX. It also has dynamic and fixed take profit in the fibonacci levels and trailling stop levels. For more information visit our Telegram group https://t.me/RaikowFXEAEN

MTF qristalium Average Advisor wurde zusammen mit dem Programmierer Alexander Gavrilin erstellt. Dieses System ist vollautomatisch. Das ist nicht Martingale. Hier funktioniert die Mittelung.
Funktioniert auf allen Währungspaaren.
Der Berater beteiligt drei Regeln: 1)Handel nur nach dem Trend, 2)"kaufen, wenn alle verkaufen und verkaufen, wenn alle kaufen", 3) der Preis geht immer gegen die Menge.
MTF Qristalium Average filtert Regeldaten über mehrere Zeitrahmen mit integrierten Indikato

Basket trading /Basket SL TP Automatic SL TP Calculation
This utility will calculate SL and TP based on 2 input parameters
PerUnitTP -This means what is per .01 TP like 1 $ per .01 Lot. SLToTP_Ratio-This what is ration SL to TP if this parameter is 3 that means if TP is 1 $ then SL will be 2$ (per .01 Lot)
so if total portfolio summing to .05 lot that that means TP will be automatically become 5 $ and SL become 10 $.
This is very good utility when you want set SL TP for many open trade

Basket trading /Basket SL TP/Portfolio SL TP/ Group Trade SL TP
This is very good utility when you want set SL TP for many open trades or portfolio
As soon your account equity reach SL or TP , This EA will close all trades . you are allowed to change SL and TP any time.
Also you need not to monitor group trades all the time you just set SL and TP in utility and relax once SL / TP situation will come all trades will be closed automatically.
SL and TP are in $Amount like 100$ SL and 500$ TP

Moon 3 is a Trend indicator. I s a powerful indicator of TREND for any par and any timeframe. It doesn't requires any additional indicators for the trading setup.The indicator gives clear signals about opening and closing trades.This Indicator is a unique, high quality and affordable trading tool.
Perfect For New Traders And Expert Traders Low risk entries. Never repaints signal. Never backpaints signal. Never recalculates signal. For MT5 Only Great For Scalping Great For Swing Trading Arrow

Trailing Stop Fast Trailing Stop Fast EA locks trade profit once trade moves in profit by certain points(eg 100 points) by moving the Stop Loss in direction of trade.
There are three inputs in EA to be provided by user to EA TrailingStart this input used as activator when trade moved 100 points towards profit, this EA will start shifting your stop loss towards profit.
TrailingStop input defines what should be the distance of stop loss from current market price once TrailingStart activated

This indicator will show a vertical representation of the volume distribution within a selected user range. For a free demo version go to https://www.mql5.com/en/market/product/42482 . Main features: This Indicator will create an image that will allow viewing the tick volume per price level in a graphical form. The indicator will work on any range size in any time-frame, limited only by your computer memory and performance. Recommended time-frames are: M1 to H1.
Inputs:
Price Calculated - s

KT Bollinger Bands Trader is a 100% automated expert advisor that's incorporated a mean reversion trading strategy using the Bollinger bands during the period of low volatility. Price often reacts at the upper or lower line of Bollinger bands, but a reversal not always occurs. However, there is more chance of price reversal during the time of low volatility.
Entries A buy trade is activated when price correctly aligns below the bottom line of Bollinger bands. A sell trade is activated when pric

The Willing horse Expert Advisor EURUSD trades on the signals of the Moving Average, Stochastic Oscillator, Average True Range indicators; uses a variety of intelligent strategies, without martingale, hedging or grid; applies stop loss to protect your capital; there is a capital management system, it has restrictions on the volume of trading positions (in% of the deposit). This advisor does not require adjustment, just attach it to the M1-chart of EURUSD. You can test any period from 01/01/2018.
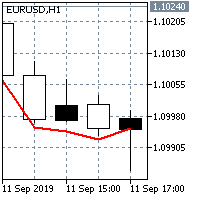
SEMA is the Sextuple Exponential Moving Average:
SEMA = PEMA + QEMA(y - PEMA)
The principle of its calculation is similar to Double Exponential Moving Average (DEMA). The name "Sextuple Exponential Moving Average" does not very correctly reflect its algorithm. This is a unique blend of the single, double, triple, quadruple and pentuple exponential smoothing average providing the smaller lag than each of them separately. SEMA can be used instead of traditional moving averages. It can be used

DER GRUNDGEDANKE. Erstens ist dies die zweite einer EA-Familie, die auf derselben Strategie basiert, die auf verschiedene Indikatoren angewendet wird. Dies bedeutet, dass dieselbe Strategie und dasselbe Geldmanagement auf verschiedene Indikatoren mit Spread-Main-Filterung angewendet wird. Letztendlich ist es das Ziel, einen EA mit einer möglichen höheren Erfolgsrate und insgesamt geringsten Verlusten zu entwerfen. Diese Besonderheit wird das Vertrauen in die EA-Nutzung für eine langfristige Zuf
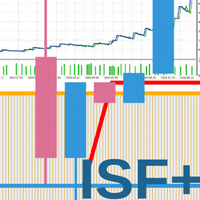
Das System basiert auf Signalen von drei Indikatoren: Ichimoku Kinko Hyo indicator Stochastic Williams Fractals Jeder Indikator arbeitet in einem eigenen Zeitrahmen. Hinweis: Eingabestandards werden nicht optimiert. Testen Sie den Experten auf einer Demo und konfigurieren Sie die Eingabeparameter entsprechend dem akzeptablen Risiko und den akzeptierten Zielen. EINGABEPARAMETER Magic Number
Every Tick (false - Every Bar)
Inputs for main signal: The threshold value of the signal to open [0...100]

Signal: https://www.mql5.com/en/signals/2021117 Set file JJ_NZDJPY_H1_E01V01 for 1k account (adjust risk setting and backtest for other accounts) Legacy Update (7.0) Simplified Use : Set to default settings. Change trading mode to "use JJ_NZDJPY_H1_E01V01 strategies". Retired Features : "Use barcode files" and "create barcode files" options are retired. Single barcode scanning is still available and can be manually added in "compatibility mode". Multi Strategist (MS) Overview ( Manual ) Functio
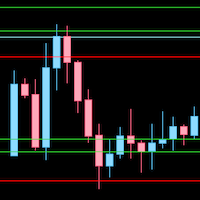
Draw levels of support and resistance based on highs/lows or closes from daily, weekly or monthly. This indicator uses the highs, lows or closes to draw horizontal lines on the graph. By observing those lines you can identify trend (gaining or losing levels of resistence/support) and find good levels where price can bounce. For those who trade price action, this is a very useful indicator.

Mit diesem Indikator können Sie die Wahrscheinlichkeit bestimmen, mit der der Preis das eine oder andere Niveau erreicht. Der Algorithmus ist recht einfach und basiert auf der Verwendung statistischer Daten zum Preisniveau eines bestimmten Währungspaares. Dank der gesammelten historischen Daten ist es möglich, das Ausmaß zu bestimmen, in dem sich der Preis während des aktuellen Balkens ändert. Trotz seiner Einfachheit kann dieser Indikator beim Handel von unschätzbarem Wert sein. Mit seiner Hil

Apollo 2 The wall It is an advanced trading system. This is a fully automatic Expert Advisor, which allows you to presize the trade according to the preferences of the trader. Apollo 2 have more customization options for your trade. Different options for different styles of trade. Apollo 2 the wall is a break system of trade with different algorithm of trade mode. This EA using signals to place orders. Is a revolution in the customization of the trading. The algorithms developed for the id

This EA uses a variety of strategies and functions such as neural network grid scalping, mobile stop loss, automatic lot number setting, etc. Use revolutionary price model algorithms, price behavioral trading, and signature collaborative work with artificial intelligence adaptive processing units. The system adopts some kind of reverse sampling development method, which makes the system show a very substantial benefit in the 13-year historical backtesting. Profit drivers to keep profits maximiz
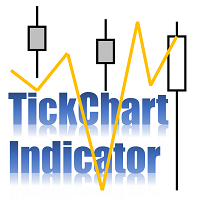
TickChart Indicator plots tick line on the main window of MetaTrader. ( Free version of this is "TickChart Indicator Lite" )
The tick-line shows the most detailed, fastest and real-time activities of the market, which are usually hidden in bars or candles longer than 1 minute. Usually, several new tick-line segments appear while a bar of M1 time frame is completed. After the release of an important economic indicator, the number of ticks per bar may exceeds 100. This indicator overlays the tick

KT MACD Divergence shows the regular and hidden divergences build between the price and oscillator. If your trading strategy anticipates the trend reversal, you can include the MACD regular divergence to speculate the potential turning points. And if your trading strategy based on the trend continuation, MACD hidden divergence would be a good fit.
Limitations of KT MACD Divergence
Using the macd divergence as a standalone entry signal can be a risky affair. Every divergence can't be interprete

DYJ ArtOfMakingMoney attempts to gauge bullish and bearish forces in the market by using two separate measures, one for each type of directional pressure. The EA's BearsIndex attempts to measure the market's appetite for lower prices
The EA's BullsIndex attempts to measure the market's appetite for higher prices Input: m_magic = 54289721 -- magic number InpTF = PERIOD_H1 -- TimeFrame InpLots = 0.01 - - Lots InpLotsExponent = 1 --

Pivot levels indicator shows 7(9 for Camarilla) pivot levels. It is adjusted for major use, including: all standard time frames
choice of periods to show four popular calculation formulas (typical, median, weighted and Camarilla)
pivot day shift choice of properties for lines and labels choice of showing alerts when crossing pivot lines Parameters: ----------Main parameters----------- Timeframe - time frame for pivot levels
Number of periods to show - displays pivot levels for number of periods

MOON 2 THE WALL is a Oscilator indicator. I s a powerful indicator of TREND for any par and any timeframe. It doesn't requires any additional indicators for the trading setup.The indicator gives clear signals about opening and closing trades.This Indicator is a unique, high quality and affordable trading tool.
Perfect For New Traders And Expert Traders Low risk entries. Never repaints signal. Never backpaints signal. Never recalculates signal. For MT5 Only Great For Scalping Great For Swin

Описание Данный индикатор строит (альтернативные, математически рассчитанные) уровни поддержки и сопротивления, а так же уровни, к которым с большой вероятностью придет цена в ближайшее время. Следует обратить внимание на то, что расчет уровней производится на исторических данных, и качество котировок играет важную роль при построении индикатором линий. Замечу, что отрисованные Magneto и Magneto Weekly линии не изменяют свои значения на всем расчетном периоде. Важное изменение! Добавлена функция

Compare Symbols Specifications is a utility indicator that is a summary interactive table of the analyzed parameters. Trading conditions in the market are constantly changing and tracking these changes is a time-consuming task. This tool allows you to compare the trading conditions of all symbols in a matter of seconds, and choose for trading those symbols that meet the requirements of the trading system. This tool will be useful to all traders and will help them to have up-to-date information

Robô Pepito. Pepito é um robô para day trade em mini índice Bovespa. Desenvolvido com uma estratégia que funciona exclusivamente com o ativo WIN, melhorando assim a sua performance e visando mais Ganhos e menos Perdas. - Negociação no ativo Mini Índice (WIN) na BM&F BOVESPA; - Operações 100% day trade; - O robô vai configurado para realizar apenas uma operação ao dia, mas isso pode ser alterado nos "Parâmetros de entrada".
ATENÇÃO: Tipo de conta: [x] Netting, [ ] Hedge. Ativar o horário de fun

Der KT Asian Breakout Indikator analysiert einen wichtigen Teil der asiatischen Handelssitzung, um in beide Richtungen Kauf- und Verkaufssignale basierend auf dem Preis-Ausbruch zu generieren. Ein Kaufsignal wird ausgelöst, wenn der Preis das Sitzungs-Hoch durchbricht, und ein Verkaufssignal tritt auf, wenn der Preis das Sitzungs-Tief durchbricht.
Wichtige Hinweise
Wenn die Sitzungsbox vertikal zu breit ist, sollte ein neuer Trade vermieden werden, da die meisten Kursbewegungen bereits innerhal
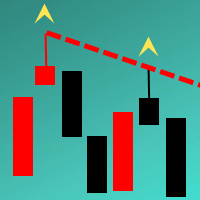
The Indicator automatically draws trend lines on the specified timeframe ( Trend lines period parameter). The lines are drawn based on the last two known fractals of the specified period. If you want the lines to be drawn only on the confirmed fractal, then set the Confirmed or unconfirmed fractal parameter to True . Indicator feature - lines are drawn with the accuracy of any timeframe. It allows analyzing the chart on smaller timeframes without loosing the precision of drawing the lines in re

This EA is to create one or more polling trading strategies in a transaction. In the polling mode, the strategies filter a trend-free range market environment and trades are placed in the opposite direction at the edges of the range. With an additional main trend filter in the trend-following mode, the DYJ's ArtOfForexWar can also trade pull-backs during trends in the trend of loss. The winning rate is more than 95% within three orders or three closes.
List of indicators: SunTzuArtOfWar(ADX) St

Expert advisor based on your own personal MACD. Whatever your strategy is, it's him. You can use it on all parities. No restrictions.
Buy Settings : Buy Fast EMA Period Buy Slow EMA Period Buy Signal Period Buy Lot Size Buy Stop Loss Level Buy Take Profit Level
Sell Settings : Sell Fast EMA Period Sell Slow EMA Period Sell Signal Period Sell Lot Size Sell Stop Loss Level Sell Take Profit Level

Buy and sell settings fixed M15 (M1-M5-M15). expert advisor does not work in the upper time frames. Important Main Trend Buy and Sell : You can set TP and SL to zero (0). In this case, transactions are automatically closed at maximum level during trend conversion times and continue to trade according to the trend. If you choose to use each TP and SL, each trend opens a process for change. However, the trend continues to trade in the direction of trend in the transformation. Pullback Buy and Sel

Buy and sell settings fixed M15 (M1-M5-M15). expert advisor does not work in the upper time frames. Important: You can set TP and SL to zero (0). In this case, transactions are automatically closed at maximum level during trend conversion times and continue to trade according to the trend. If you choose to use each TP and SL, each trend opens a process for change. However, the trend continues to trade in the direction of trend in the transformation. You can use it on all parities. No restriction

The current Rise and Fall is judged from the Commodity Channel Index (CCI) of the three cycles and displayed in a panel by color coding.
The second and third of the three cycles are changed according to the correction factor multiplied by the first cycle (minimum cycle).
In addition, each CCI is displayed with ATR (Average True Range) corrected for variation.
When two of the three CCI are complete, Trend_1 is displayed.
When all three are complete, Trend_2 is displayed.
// ---
Squeeze is

The trading system utilizes a real breakout strategy with an intelligent calculation engine to eliminate bad signals. The EA has only been developed and optimized for EURUSD H15. We recommend choosing a broker with a fixed spread of 5 to 20 points, with a zero STOPLEVEL and five-digit quotes. You can change the settings and try other pairs for better results. Trades are always protected with STOPLOSS, Smart Trailing and Breakeven. This EA is very easy to use. No grid No martingale МetaТrader 4 v
This EA trades using Moving Averages Crossovers. It offers fully customizable settings, flexible position management settings. Easy to use and supervise Fully customizable moving average settings Customizable TP Works for ECN/Non-ECN brokers Works for 2-3-4-5 digit symbols Trading can be NFA/FIFO Compliant Trades will be closed on opposite signals Built-in money management The EA implements the following behaviors: Regular: Buy on bullish crossovers and sell on bearish crossovers Reverse: closes

Apollo 1 box break It is an advanced trading system. This is a fully automatic Expert Advisor, which allows you to presize the trade according to the preferences of the trader. Apollo 1 have more customization options for your trade. Different options for different styles of trade. Apollo 1 box break is a break system of trade with different algorithm of trade mode. This EA using signals to place orders. Is a revolution in the customization of the trading. The algorithms developed for the
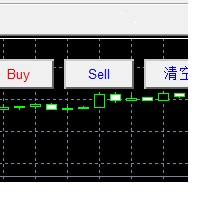
Quick operation, quick purchase, sale, empty operation.
Provide three buttons: Buy, Sell, empty.
Buy: Quickly place more orders after clicking, default 1 hand, profit point and stop-loss point are 110 points, after successful order can be manually modified.
Sell: Quickly place an empty order after clicking, default 1 hand, profit point and stop-loss point are 110 points, can be manually modified after the order is successful.
Empty: Quickly clear all orders, including purchase and s

FZR indicator determines fractal zigzag reversal pattern of all the time frames of the chosen symbol and shows the information in the Info label. Indicator draws the detected pattern in the chosen time frame and also you can select in the menu to draw the trend line according to FZR peaks. What it is FZR? See the first picture in the screenshots. As you can see for every peak of FZR the AO indicator must cross zero line. FZR indicator determines the trend direction.
How to use FZR for trading?

Moon 1 is a Box Break is a powerful indicator of Break Zone for any par and any timeframe. It doesn't requires any additional indicators for the trading setup.The indicator gives clear signals about opening and closing trades.This Indicator is a unique, high quality and affordable trading tool.
Perfect For New Traders And Expert Traders Low risk entries. Never repaints signal. Never backpaints signal. Never recalculates signal. For MT5 Only Great For Scalping Great For Swing Trading Arro
Ultimatum Breakout - this trading system uses the strategy of valid breakouts, using multiple custom indicators for eliminating bad signals. The EA uses a very small SL so the account is always protected from equity drawdown with a very low risk-per-trade. The EA is fully adapted: calculates the spread — for pending orders, stop loss, trailing stop, breakeven. It was backtested and optimized using real ticks with 99,9% quality. It has successfully completed stress testing. No Martingale. No arb
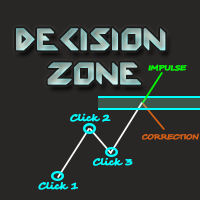
Decision Zone is an indicator that defines decision zones for previously selected pivots. In decision zones the user can more safely decide whether the wave that has reached this zone is correction or impulse.
Zone levels were based on Fibonacci expansion along Elliot waves and case analysis.
Trading Strategy:
Basically, when the market wave reaches the decision zone at * Level 1.0 *, there is great potential for this wave to be an impulse or correction wave. If it is impulse, the wave will

LRY SL Robot is a fully automated multi-currency trading robot, trading according to the "rise-fall ratio". EA operating environment EA can run in any currency, at any time. The minimum capital is $300. Parameters Lot - lot size for pending orders. Open Percentage - Start trading "percentage signals" Close Percentage - Turn off trading "percentage signals" Compound Interest - As the balance increased, so did the number of orders Move Stop Loss - Change distance of stop loss line after earnings A

Investo is a fully automatic, professional trading robot. Designed specifically for the foreign exchange market. A unique index calculated on the quotes of eight currencies pairs is used to make a decision. The analysis is carried out taking into account the global situation in the market - it provides unique opportunities for price forecasting. Multi-currency analysis allows you to trade on a variety of instruments without changing the parameters and opens the possibility of hedging.This robot

Индикатор Magneto Weekly Pro отображает: Недельные важные линии поддержки и сопротивления (выделены желтым, красным и синим цветами). Основные недельные цели (выделены белым цветом). Недельные паттерны возврата цены (обозначаются красными флажками). Применение индикатора Magneto Pro можно использовать и как дополнение к существующей стратегии, и как самодостаточную торговую стратегию. Данный продукт состоит из двух индикаторов, работающих на разных временных промежутках, и предназначен для скал

CPA - "Candle Pattern Analyze" - Индикатор поиска и анализа свечных моделей. Индикатор осуществляет поиск наиболее ликвидных свечных моделей, а так же производит анализ истории, как развивалась цена в прошлом. Внимание! В тестере стратегий индикатор показывает только свечные модели. Линии возможного движения, формируются на истории, и показываются только в терминале (естественно при условии наличия истории выбранного интервала). Настройки индикатора по умолчанию - минимальны, то есть, перед испо
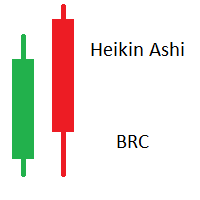
Heikin Ashi (HA) is a type of candlestick chart originated in Japan. The difference from traditional candlesticks is that HA bars are averaged, creating a smoother appearence. HA doesn't show the exact open and close price, they should be used as Technical Indicator and not as exact market prices. Calculation: HA Open = (Open of previous bar + Close of previous bar) / 2 HA Close = (Open + High + Low + Close) / 4 HA High = Highest of High, HA Open, or HA Close HA Low = Lowest of Low, HA Open, or

The Penta-O is a 6-point retracement harmonacci pattern which usually precedes big market movements. Penta-O patterns can expand and repaint quite a bit. To make things easier this indicator implements a twist: it waits for a donchian breakout in the right direction before signaling the trade. The end result is an otherwise repainting indicator with a very reliable trading signal. The donchian breakout period is entered as an input. [ Installation Guide | Update Guide | Troubleshooting | FAQ | A
Der MetaTrader Market ist eine einzigartige Plattform für den Verkauf von Robotern und technischen Indikatoren.
Das Merkblatt für Nutzer der MQL5.community informiert Sie über weitere Möglichkeiten: nur bei uns können Trader Handelssignale kopieren, Programme bei Freiberuflern bestellen, Zahlungen über das Handelssystem automatisch tätigen sowie das MQL5 Cloud Network nutzen.
Sie verpassen Handelsmöglichkeiten:
- Freie Handelsapplikationen
- Über 8.000 Signale zum Kopieren
- Wirtschaftsnachrichten für die Lage an den Finanzmärkte
Registrierung
Einloggen
Wenn Sie kein Benutzerkonto haben, registrieren Sie sich
Erlauben Sie die Verwendung von Cookies, um sich auf der Website MQL5.com anzumelden.
Bitte aktivieren Sie die notwendige Einstellung in Ihrem Browser, da Sie sich sonst nicht einloggen können.