Handelsroboter und Indikatoren für den MetaTrader 5 - 70
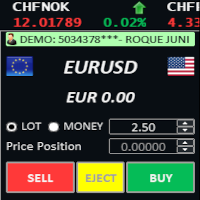
Welcome to TradeX Chart Trading Netting and Hedge accounts. Functionalities SHIFT to buy; CTRL to sell; Breakeven; Visual flag of pending orders on the chart; Blocking the BUY/EJECT/SELL buttons to prevent accidental sending of orders; Spread visualization when clicking on the asset being traded; Candlestick countdown; List of open positions; Percentage balance of all transactions for the current day. Warning It does not work in Strategy Tester. Updates and improvements coming soon!
UPDATE NOV 2024!!!
This Product is a Market Scanner based on Didi Index Indicator. It's can scan all time frames of Symbols in Market Watch, client can customize according the demand, its can scan a single symbol or more than 100.
Manual: Link Driver Link do Manual Video: LINK The Scanner informs 4 kind of signals, all alerts are providing from Didi Index Indicator:
1 - Didi Index - Alert of Buy : Cross up of "Curta" short moving average 3" with moving average 8; (3x8 = UP)
3 - Didi Inde

Having more expert advisors running on the same account , eventually leads us to the question , which one of them are winners , or which are dragging down the account ? With this in mind I created this simple utility for displaying profits or losses taken by each expert advisor over time . This utility can be run as an expert advisor and can display up to 9 magic number results . If the inputs are left to zero , the results displayed are from the manually placed orders . It also displays deposi
FREE
This free script exports chart data to a csv file. Just attach it to the chart, set the desired inputs and click OK. To find the file follow the next path : File -> Open Data Folder -> MQL5 -> Files. The csv file will include the next data: date hour open high low close volume spread. To open the file you can use Notepad, Microsoft Excel, OpenOffice Calc, etc.
Visit my profile soon for more products.
FREE

这是一个组合指标分析趋势、支撑阻力、买卖点。运用了均线MA、布林带、KDJ、CCI、RSI。 主图上下线是布林带上下线,采用的是20周期和2.3标准差可以用来支撑阻力。 中间的是分析趋势的均线,趋势分析是用均线多周期: 为涨趋势,反之为下跌趋势。在同一种颜色,基本说明趋势没有发生变化。 子图是由 KDJ、CCI、RSI三个指标组成,大于70超买,小于30超卖, 智能提示是运用了算法,主要计算布林带, KDJ、CCI、RSI指标
有三个或四个指标超出市场常态就会发出提示行情可能反转。 子图指标运用了很多数据,刚刚开始加载会有点慢,耐心等待就可以 这个指标是主图指标,还要再下我发布的RCD分析,这样就刚刚好组成一套分析 电脑分辨率的文本大小请设置100%,不然字体会不一样
FREE
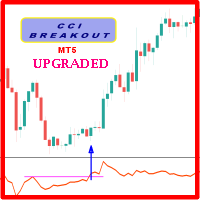
Probability emerges to record higher prices when CCi oscillator breaks out oscillator historical resistance level when exhibit overbought values. Since, oscillator breakout of support and resistance have similar effect as price breaks support and resistance levels, therefore, its highly advised to confirm price breakout with oscillator breakout; certainly, will have the same output in short trades. Concept is based on find swing levels which based on number of bars by each side of peak or troug
FREE

Volume Cross Over is an indicator that measure positive and negative volume flow in a financial instrument, such as a stock, commodity, or index. It is base on the idea of On-Balance Volume developed by Joseph Granville. However instead of trending lines, this indicator shows volume cross over. When the closing price of an asset is higher than the previous closing price, then the Bull volume is greater than zero and Bear volume is negative. It suggests that buying volume is dominating, and
FREE

Walking Steps EA is a scalping Expert Advisor designed to work in a volatile market. It is suitable for working with any brokers, including American brokers, requiring FIFO to close primarily previously opened transactions. All orders are accompanied by a virtual stop loss and take profit in pips, and there are also breakeven and trailing stop functions. The chart displays information on the speed of order execution and slippage. Advisor does not use martingale or grid. The EA does not depend on

Informações Importantes sobre o Brazil Index Bot (BACKTEST VISUAL desativado para proteger parte da Estratégia.)
Se você está procurando um robô que cumpre aquilo que promete, você acabou de encontrar! O Brazil Index Bot irá superar todas as suas expectativas com certeza! E o melhor de tudo, é só colocar na sua conta, ligar e já começar a lucrar! Deseja conhecer mais sobre o Brazil Index Bot e seus resultados? Baixe agora os relatórios detalhados em: https://bit.ly/INFOSBRAZILINDEXBOT (Utilize e
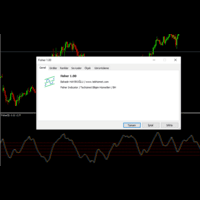
With Fisher level indicator. Many settings can be changed by the user, indicator created with original calculation. You can adjust the levels you create according to yourself and provide more stable displays. What is Fisher indicator: It transforms data that does not normally show a normal distribution, such as market prices. In essence, the transformation helps to better identify price reversals on a chart by making peak swings relatively rare events.
FREE
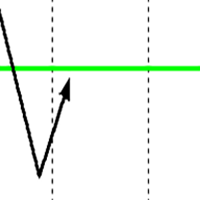
The Reversal Area EA is designed to identify likely price ranges for price to turn from. This EA is used in conjunction with other EA's that I developed and serves as filtering tool to keep from entering too early. The overall idea is to be a buyer below the green line. A seller above the green line for the sell version. The second thing to keep in mind is time. When price fluctuate over the course of a few days and move further below this zone (long bias) it offers greater likelihood of settin
FREE
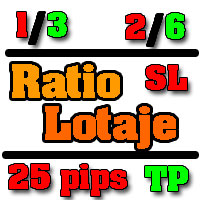
Utilidad de uso informativo la cual ayudará a gestionar el riesgo de los trades con la ayuda visual de los datos proporcionados. el usuario se encargará de ubicar sus SL y TP manual acorde al lotaje. Asesor experto desarrollado para MT5 con el objetivo de ingresar ratios de utilidad y % de riesgo, adicional los Pips de SL para el cálculo del lotaje para dicho riesgo. Estos se calculan sobre el balance actual. El usuario tomaría como dato ingresar el lotaje que se calculó y arrastrar el S
FREE
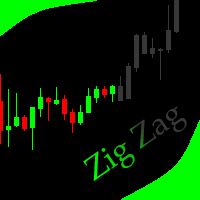
This indicator allows to hide ZigZag indicator (on all MT4 timeframes) from a date define by the user with the vertical line. This indicator can be use with other "Hidden Indicators". Indicator Inputs: Depth Deviation Backstep Information on "ZigZag" indicator is available here: https://www.mql5.com/en/articles/1537 ************************************************************* Hey traders!! Give me your feeds! We are a community here and we have the same objective.... make some money from th
FREE

The DJ_15_811543657_S_BB_CF_SQX is an algorithmic trading strategy for MetaTrader, tested on DJ using the M15 timeframe from December 7, 2017, to June 2, 2023. There is no need to set up parameters, all settings are already optimized and fine-tuned.
Recommended broker RoboForex because of EET timezone.
You can find the strategy source code for StrategyQuant at the link: https://quantmonitor.net/dow-jones-bollinger-breaker/
Key details are:
MagicNumber: 811543657
Main Chart: Current s
FREE

NUR NOCH 2 VON 10 EXEMPLAREN FÜR 99 $ VORHANDEN! Danach wird der Preis auf 199 $ erhöht.
- ECHTES SIGNAL: 50K Live-Signal: Klicken Sie hier Your Last Hope ist ein zuverlässiger EA mit einer bewährten Einstiegsstrategie, die über mehr als 10 Jahre Daten getestet wurde und einen qualitativ hochwertigen Handel pro Tag ermöglicht. Es konzentriert sich auf die Aufrechterhaltung eines kontrollierten Risikos Verhältnis unter Verwendung von Stop-Losses für alle Trades, ohne riskante Methoden wi

This tick indicator draws synthetic bars/candlesticks that contain a definite number of ticks. Parameters: option prices - price option. It can be Bid, Ask or (Ask+Bid)/2. the number of ticks to identify Bar - number of ticks that form OHLC. price levels count - number of displayed price levels (no levels are displayed if set to 0 or a lower value). calculated bar - number of bars on the chart. Buffer indexes: 0 - OPEN, 1 - HIGH, 2 - LOW, 3 - CLOSE.
FREE

Trader Family EA use multiple custom indicators to determine entry orders and exits. Every order uses a pending order and always uses a take profit and stop loss with a risk reward of 1:1.5, everything is calculated automatically. This EA is suitable for beginners and advanced traders, this EA can be customized according to the risk profile of the trader himself. Requirements and Recommendations Trader Family EA specifically for the USDJPY pair on the H1 timeframe. ( will be optimized for ot
FREE
This EA is a flexible and powerful metatrader expert advisor that trades using the MACD indicator and implements many useful features. It can trade using the MACD indicator alone, or donchian breakouts confirmed by the MACD indicator from any timeframe. Additionally, it offers a martingale feature and forex session filters. [ Installation Guide | Update Guide | Troubleshooting | FAQ | All Products ] Easy to use and supervise Fully configurable settings Customizable break-even, SL, TP and traili

Definition :
Risk Monitor is an expert for Analyzing, monitoring, controlling account risks.
Strategy :
Analyze Each Currency Volume and Direction on Account and Sort Them Find and Suggest Best Three Symbols in Opposite Direction (Hedging Positions) for Controlling Risk. Analyze User-Defined Position and preview effect before placing /Closing
Features of EA :
Graphical Interface Show Risk Graph for each currency Smart Analyze and suggest best hedging positions

This EA trades using the RSI Indicator. It offers many trading scenarios and flexible position management settings, plus many useful features like customizable trading sessions, a martingale and inverse martingale mode. [ Installation Guide | Update Guide | Troubleshooting | FAQ | All Products ] Easy to use and supervise It implements three different entry strategies Customizable break-even, SL, TP and trailing-stop Works for ECN/Non-ECN brokers Works for 2-3-4-5 digit symbols Trading can be NF

Smart Copy is an Easy-to-Use EA that supports Multi Copying Metatrader4 and Metatrader5 and Local/Remote Copying. (Remote Version is coming soon)
This is Free Version and can be used on Demo accounts only. Use the Full Version for real trading.
Specifications :
Real Time, Multi Terminal - Multi Account - MT4/MT5 trade copying Copy from netting to hedge and hedge to netting is supported.
Fast and instant copy
All settings are input visually. Easy modifying symbol names,
FREE
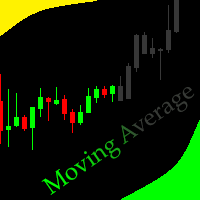
this Moving Average indicator is like no other, making trading easier for you,the settings are preset and can't be changed but don't let that stop you because it's highly accurate.
If the candle closes above the line you enter buys and below then you go for sells, this is build to help beginner traders on their journey to becoming profitable
Easy and quick to understand
FREE
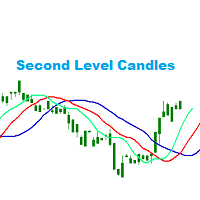
Second Level Candles And Alligator Indicators 每12秒产生一个K线,而且自带Alligator指标,对超短线选手交易非常有帮助。程序启动时可能不成功,是因为MT5 MqlTick 数据加载少的原因。可以通过修改显示的数据参数避免,比如display=100,程序正常之后再将参数调大 display=300 。如果数据不正常,也可以采用重新加载的方式解决。 如果您对这个指标有任何建议,请联系作者。 Second Level Candles And Alligator Indicators produced a candle per 12 seconds,include Alligator, it's helpful to Short-Term Trading。You'd better reload the indicator every start MT5 or change display parameter to reslove data bug. Please attach author when you had some su
FREE

The indicator shows the number and ratio of ticks with the price growth and fall for each candle of the chart. The upper part of the histogram in the form of thin lines shows the number of price growth ticks (bullish strength), while the lower part shows the amount of price fall ticks (bearish strength). The thicker histogram bars is the difference between the strength of bulls and bears. A positive difference is displayed in green, and the negative one is red. The strength of bulls increases wh
FREE

The Indicator indicator draws 2 clouds based on Donchian Channels indicator values. The upper cloud is formed by the upper lines values and the lower cloud by the lowers lines values. The indicator allows to change the Channels parameters and the clouds colors the period of the base line and the multiplier of each Donchian Channels instance. The indicator holds 5 buffer index as follow: [0] - Outer values of the upper cloud [1] - Inner values of the upper cloud [2] - Base/Center line values [3
FREE

This EA automatically closes all Open Trades and Pending Orders at your specified Net Profit or Net Loss. The TP and SL for a single trade can easily be set in Meta Trader, on individual basis and on hitting that TP or SL, the trade is automatically closed. However, if you have multiple trades and you want to set a Net TP and Net SL (in terms of profit & loss) for all of them, then Meta Trader cannot help you. Here comes this EA “Net TP Net SL Setter” using which you can set a Net TP and Net SL
FREE
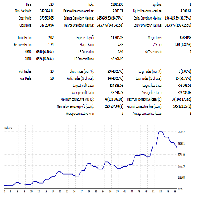
This is MacroTrendTrader. It trades in DAILY time frame even if you run it on lower time frames. It opens/closes trades once per day at a specific time that you choose via input tab: - "param(1-5)" are optimization parameters. - "Open/Close Hour" is set via input tab. Make sure to choose this to be away from nightly server shutdown. - "high risk" mode if chosen, sets a closer stop loss level. Therefore higher lot sizes are taken. This is a light load EA from processing point of view. Calculatio
FREE

Description The Profit and Loss Indicator by Creative Tech Solutions is a robust and comprehensive tool designed to help traders monitor their trading performance in real-time. This indicator provides detailed metrics on profits and drawdowns, ensuring traders are always informed about their trading activities and performance. With customisable alerts and display settings, this indicator is an essential tool for any serious trader. Features Real-Time Metrics : Monitor profit and drawdown percent
FREE

Investment Castle News Indicator will plot vertical lines before the news on the chart and categorized in three different colors in accordance with the news importance. You can choose to limit the news to the current chosen symbol or show all future news on the same chart. High impact news is marked in Red lines be default. Medium impact news is marked in Orange lines be default. Low impact news is marked in Yellow lines be default.
FREE

This EA has been developed, tested and traded live on DAX M30 TF. Everything is ready for immediate use on real account. Very SIMPLE LONG ONLY STRATEGY with only FEW PARAMETERS. Strategy is based on the DOUBLE TOP strategy on the daily chart. It enters if volatility raise after some time of consolidation . It uses STOP pending orders with FIXED STOP LOSS. To catch the profits there is a TRAILING PROFIT function in the strategy and TIME BASED EXIT . EA has been backtested on more

GPF Stochastic: a momentum indicator that compares a specific closing price of an asset to a range of its prices over a certain period. It helps traders identify potential overbought or oversold conditions in the market. The indicator consists of two lines: %K Line : The main line, which represents the current closing price relative to the price range over a set period. %D Line : The signal line, which is a moving average of %K. The Stochastic Oscillator ranges from 0 to 100 , with levels typic
FREE

TendencyLine Indicator - Market Trend Analysis (An exclusive indicator by PPF - Past Project Future)
General Description TendencyLine is a technical indicator developed by PPF - Past Project Future to help traders identify the prevailing market trend. It overlays a trend line based on a user-selected moving average on the price chart and displays a colored histogram that signals the trend direction.
Main Features Trend Identification: The indicator differentiates between bullish and bear
FREE

This is a bufferless indicator which can display classical X and O columns if applied on custom symbol charts built by Point-And-Figure-like generator PointFigureKagiCharts or its DEMO . The indicator will enforce a fixed price-scale on the chart to make sure the marks keep correct aspect ratio. The marks are shown only if the chart time-scale is large enough to hold them in the space allocated per bar (if the horizontal scale is one of 3 smallest ones, the indicator draws nothing and outputs a
FREE

This is a smooth and responsive accelerometer which reveals the market trend and strength. [ Installation Guide | Update Guide | Troubleshooting | FAQ | All Products ]
Two moving averages indicate trend direction The histogram represents strength of the price movement It draws buy and sell zones as colored vertical lines Should be used as a confirmation indicator Customizable line widths and colors It implements alerts of all kinds This indicator is similar to MACD but aims to react faster to
The utility for managing open positions can work with stops (take profit and stop loss) in money, percentages or points. The built-in trailing stop starts working from profit, the size of which can be set in currency or as a percentage. With the help of the built-in trading simulator, you can check how the utility works in the strategy tester. Benefits setting stop loss and take profit in the deposit currency, as a percentage of the account balance or by points; adding stop loss and take profit

You've probably heard that different brokers give different results? But what is the main problem when brokers have approximately the same trading conditions for spreads and commissions,you have the same ping.. but the results of trading on real accounts are very different. What's the matter?
There are situations when even good advisors give bad results and the point here may not be in the adviser, but in the broker and you can draw the wrong conclusion about the adviser without getting a good

If you can not create a background image for yourself (photo size and format must be changed), let me know. I make your photo for free. Otherwise, you can read the help file . A tool for chart management You can change the background image You can change the background color Change the color of the candles Volume colors, line charts and everything else You can also enable and disable some items Read the help file for more information
Settings:
Save Changes After Remove Tool
Back Ground Phot
FREE

A Heatmap with a Volume Profile is like a thermal imager or x-ray machine. It will help you to estimate the relative distribution of volume during the price movement and to understand the relationship between volume and price. Indicator Volume Profile "Volumos Maxima" is a powerful tool for analyzing this relationship. After simple experimentation with heatmap, you can find that each trading instrument has its own “ characteristic ” way of distributing volume. And this will help you to make a b
TrendFollowMT is a fully automated trading system which is using large time frame to determine the trend and use small time frame to find the entry point. Once the trend changed to opposite side, the system will wait for another entry point to recover with bigger lot size. Moreover, the target profit will be moved up when more position had been opened. The aim is to cover the cost of waiting time and risk.
Free version will only trade on buy signal and locked the initial Lot size (0.01). Paid v
FREE

EquityShield is a lightweight and dependable Expert Advisor (EA) for MetaTrader 5, crafted to protect your trading account from excessive losses with minimal resource usage. It monitors your account's equity drawdown and automatically closes all open positions and pending orders if the drawdown exceeds your specified threshold, either in percentage (%) or a fixed amount ($). Designed as a robust safety barrier, EquityShield ensures your capital remains secure during unexpected market volatility
FREE
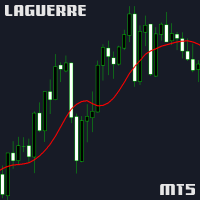
Laguerre Indicator with Gamma Input Overview: The Laguerre Indicator is a sophisticated financial analysis tool designed to provide traders and investors with a dynamic and responsive method to track market trends. Its core functionality is centered around a unique algorithm that adapts to market volatility, offering clearer insights compared to traditional indicators. Key Feature - Gamma Input: Gamma: The sole input for the Laguerre Indicator, 'gamma,' plays a pivotal role in calibrating the i
FREE

The 4xtradingllc Panel allows you to enter sells and buys in a quick manner as well as close all trades at once. The panel also has a account protector that will close all trades once the protector has been hit.
You can attached this utility to most indicators and combine the two to have your indicator fully functioning as well as the panel to buy sell and close trades quickly and protect the account from losing X percentage.
MAKE SURE TO JOIN OUR DISCORD SERVER FOR FULL TRAININGS. DISCORD LI
FREE
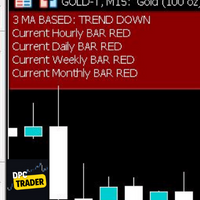
This Utility Bot is for New Traders, that struggle to spot the Trend direction. It also make you conscious about different Timeframes Bar Status. Utility have 3 Moving Averages totally configurable by input parameters. 3MA Based Trend is shown for the current Timeframe selected on the chart. (Line 1) 3MA Based Trend for Daily Timeframe. (Line 2nd) Also provide quick information about the currently Hourly Daily and Weekly Candle Status. Utility work on 1 Min Bar control, so comment section info
FREE

# TickVolumeLines — визуализация тиковых объёмов через линии на графике ## Описание Индикатор **TickVolumeLines** отображает тиковые объёмы в виде горизонтальных линий на графике. - **Зелёная линия** — на уровне **Low** бычьей свечи. - **Красная линия** — на уровне **High** медвежьей свечи. Толщина линии зависит от величины тикового объёма на баре. Индикатор помогает быстро визуально определить всплески объёма и потенциальные уровни интереса участников рынка. ## Особенности - В
FREE

Endlich wurde die Schnittstelle benutzerfreundlich. Jetzt können Sie die Periode des Indikators mit der Maus steuern. Klicken Sie einfach auf die Schaltfläche und scrollen Sie mit dem Mausrad, um den CCI-Zeitraum zu erhöhen oder zu verringern. Die Taste kann an beliebiger Stelle platziert, gesichert und mit einem einzigen Tastendruck verwendet werden. In einem Diagramm können Sie mehrere Indikatoren festlegen und sie einzeln oder auf einmal verwalten. Die einfache Installation auf dem Diagramm
FREE

The RSI (Relative Strength Index) scanner is a powerful technical analysis tool designed to help traders and investors identify potential trading opportunities in the forex, stocks, and cryptocurrency markets. RSI is a popular momentum oscillator that measures the speed and change of price movements and helps determine overbought or oversold conditions in an asset. The scanner takes advantage of this indicator to streamline the process of finding trading signals and opportunities. The RSI value
FREE

El indicador técnico conocido como Líneas de Tendencia Perfecta . Este indicador es una herramienta valiosa en el análisis técnico y se utiliza para mejorar la toma de decisiones en el trading. Aquí tienes una descripción paso a paso de cómo funciona y cómo puede ser utilizado por los traders: Identificación de Tendencias : Las líneas de tendencia perfecta se dibujan conectando dos o más puntos de precio en un gráfico, revelando así la dirección general del mercado. Una línea ascendente indica
FREE
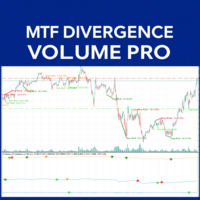
Divergence MTF Volume Pro: Your Ultimate Edge in the Market
Have you ever felt that the market takes you by surprise? Would you like a tool that anticipates possible turns and provides clearer signals for entering or exiting trades? Introducing Divergence MTF Volume Pro! Imagine seeing when price and volume (the force behind movements) start to contradict each other. This, known as divergence, is one of the most powerful signals indicating a potential trend reversal or strong continuation. Our
FREE

The Draggable Candle Timer is a smooth, minimal, and fully customizable tool that displays the countdown time until the next candle close. It is draggable and can be repositioned anywhere on the chart, so it never gets in the way. Alerts can be easily enabled or disabled directly on the chart by double-clicking the timer—no need to access the input settings. It runs smoothly, without the glitches and delays often encountered in other candle timers. To move the timer: Double-click to select it,
FREE

We at Minions Labs always like to defy the stablished systems and beliefs trying new things and new ways of seeing and interpreting the Market Data. And all starts with the following question...
WHAT IF...
You give more relevance and focus on the Wicks/Shadows on the candlesticks? And Why? In volatile markets wicks play an important role on determining who is winning the the fight between Bulls and Bears , and more than that, Higher and lower wicks can present you with a good status of the curr
FREE

Features
All Ichimoku Signals (Selectable) : Display all reliable signals generated by the Ichimoku indicator. You can choose which signals to view based on your preferences. Filter by Signal Strength : Sort signals by their strength—whether they are weak, neutral, or strong. Live Notifications : Receive real-time notifications for Ichimoku signals.
Transparent Cloud : Visualize the Ichimoku cloud in a transparent manner.
Available Signals
Tenkensen-Kijunsen Cross Price-Kijunsen Cross Price-C

The indicator generates early signals basing on ADX reading data combined with elements of price patterns. Works on all symbols and timeframes. The indicator does not redraw its signals. You see the same things on history and in real time. For better visual perception signals are displayed as arrows (in order not to overload the chart).
Features The best results are obtained when the indicator works on two timeframes. For example: M30 – the indicator shows the main trend; M5 – the indicator gen
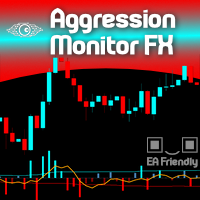
Would you like to monitor the aggression between Buyers and Sellers, minute by minute? Now you can! Welcome to the Aggression Monitor FX ! The Aggression Monitor FX indicator was developed for those markets that do not provide REAL data Volume, i.e. like the Forex market. We developed a way to use 1-minute Tick Volume data generated by Forex (and other) Brokers and manipulate it into "aggression" information in a very visual histogram with additional analysis lines. And it worked! (but hey! you
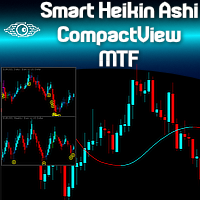
Are you already a fan of the Minions Labs Smart Heikin Ashi chart analysis tool? Or perhaps you're looking for a versatile Heikin Ashi chart capable of operating across multiple timeframes? Want to see the bigger picture before diving into the details, to make smarter ENTRY decisions? Do you want to build your own Dashboard of Symbols in just one chart, without dealing with messy multi-window MT5 stuff? Welcome to the Minions Labs Smart Heikin Ashi CompactView MTF indicator! Please see the power

The euro index (Euro Currency Index, EURX) is an average indicator of changes in the exchange rates of five currencies (US dollar, British pound, Japanese yen, Swiss franc and Swedish krona) against the euro. Displays a Eur X chart in a seperate window below the main chart. YOUR BROKER MUST HAVE THESE SYMBOLS FOR THE INDICATOR TO WORK Based on EUR/USD, EUR/JPY, EUR/GBP, EUR/CHF and EUR/SEK All these pairs must be added to Market Watch for the indicator to work correctly As this is calculated usi
FREE

A Swing Failure Pattern ( SFP ) is a trade setup in which big traders hunt stop-losses above a key swing high or below a key swing low for the purpose of generating the liquidity needed to push price in the opposite direction. When price 1) pierces above a key swing high but then 2) closes back below that swing high, we have a potential bearish SFP . Bearish SFPs offer opportunities for short trades. When price 1) dumps below a key swing low but then 2) closes back above that swing low, we have

MT5 to Discord Notification Hub is a user-friendly tool that connects MetaTrader 5 (MT5) with Discord, enabling seamless transmission of trade alerts, updates, and custom messages directly from MT5 to your Discord server. You can easily adjust and enable or disable specific parts of the notifications, making it ideal for signal providers and traders who want to keep their audience informed with real-time updates
Setup guide A setup guide is available here https://www.mql5.com/en/blogs/post/

SlopeChannelB – ein technisches Analysewerkzeug, das einen geneigten Preisbewegungskanal erstellt und einzigartige Möglichkeiten bietet, den aktuellen Marktstatus zu bewerten und Handelssignale zu finden. Hauptmerkmale des Indikators: Geneigter Preisbewegungskanal :
Der Indikator hilft dabei, Unterstützungs- und Widerstandsniveaus zu visualisieren, die mögliche Umkehrpunkte oder die Fortsetzung des Trends anzeigen können. Verschiedene Linienfarben und Hintergrundhervorhebung :
Geneigte Unte

Indicator-forecaster. Very useful as an assistant, acts as a key point to forecast the future price movement. The forecast is made using the method of searching the most similar part in the history (pattern). The indicator is drawn as a line that shows the result of change of the close price of bars. The depth of history, the number of bars in the forecast, the patter size and the quality of search can be adjusted via the indicator settings.
Settings: PATTERN_Accuracy_ - quality of the search.
FREE

Switch symbols and timeframe by arrow buttons 1. You can switch multiple symbols of one or all charts. 2. You can set list of symbols to switch between them or get them from Market Watch. 3. You can change timeframe of one or all charts. List of timeframes here [M1, M5, M15, M30, H1, H4, D1, W1, MN1]. Switch symbol of all charts: indicator check current symbol of the chart to get index of it in list and change for next or previous. Key functions: - Right arrow key: switch to next symbol. - Left
FREE

Diese Strategie kombiniert Nadaraya-Watson Envelope , RSI und ATR Stop Loss Finder für präzise Handelssignale mit dynamischem Stop-Loss.
Funktionsweise: • Nadaraya-Watson Envelope: Identifiziert dynamische Unterstützungs- und Widerstandszonen. • RSI: Zeigt Momentum und Überkauf/Überverkauf an. • ATR Stop Loss Finder: Setzt Stop-Loss basierend auf Volatilität.
Einstieg: • Long: • Preis am unteren Envelope. • RSI unter 30. • Short: • Preis am oberen Envelope. •
FREE

Advanced ideas of the popular MACD indicator: It detects and displays classic and reverse divergences (two methods of detecting divergences). It uses different color to highlight an uptrend and a downtrend. Two methods of determining a trend: а) MACD crosses the 0 level (classic signal); б) MACD crosses its own average (early signal). This is a multi-timeframe indicator: it can display MACD data from other timeframes. Two methods of drawing: classic histogram and line. It generates sound and vis

Стрелочный индикатор, выдающий сигнал при пересечении канала боллинждера. Сигналы выдаются в виде стрелок и подходят для торговли бинарными опционами.
Входные параметры Period of BB - период боллинджера Shift of BB - смещение боллинджера Deviation of BB - отклонение боллинджера Inform about finding the signal - параметр, отвечающий за получение уведомлений (Alert) о найденном сигнале. По умолчанию - да
FREE

RSI Condition:
The Relative Strength Index (RSI) for the current period is below a specified low threshold (RsiLow). This indicates oversold conditions. Candlestick Pattern:
It checks for a specific candlestick pattern across three consecutive candles: The current candle (1) closes higher than it opens (bullish) The previous candle (2) closes lower than it opens (bearish) The current candle's close is below the high of the previous candle Price Action:
The alert also checks that the current
FREE

Donation: USDT (TRC20) : TJhnnAGwkJqVyAM69Uq9fuDFNxfu1X1c9x USDT (BEP20/KCC/ERC20) : 0x0b9a736E6178F47450322936170213d419C4A7c0
You can use this expert to execute Martingale orders for you open positions. This expert will add to your positions with a pre-defined loss step.
For choosing open positions you can use Symbol Name or Magic Number . Also the loss step will be defined by currency or pips. All positions that refer to a certain order will be closed by entered Profit from input section.
FREE

TradeCopy is an efficient MT4, MT5 trade copy software,using as EA on MT4 real account. You can download the Demo unlimit version to test on Demo account: Trade Copy MT4 Demo Free Trade Copy MT5 Demo Free
Features: 1.Can achieve cross-MT4 and MT5 trade copy . 2. The Sender and the receiver are in the same file, which is convenient to use. 3.Can achieve cross-broker trade copy. 4.More trade copy style, you can copy by balance,equity, lot ratio or fixed lot . 5.Can enlarge or reduce the amoun

The " Pure View " indicator is designed to quickly display and hide indicators on the chart. Description
1. Currently Pure View works with Stochastic, MACD, RSI indicators 2. Displaying and hiding indicators occurs using hot keys 3. The key combination Shift + C will display or hide the "Stochastic" indicator on the chart 4. The key combination Shift + V will display or hide the "RSI" indicator on the chart 5. The key combination Shift + B will display or hide the "MACD" indicator on the chart
A
FREE

Order Book, known also as Market Book, market depth, Level 2, - is a dynamically updated table with current volumes of orders to buy and to sell specific financial instument at price levels near Bid and Ask. MetaTrader 5 provides the means for receiving market book from your broker, but in real time only, without access to its history. This expert adviser OrderBook History Playback allows you to playback the market book events on the history using files, created by OrderBook Recorder . The exper
FREE

Trade in the opposite directions with HedgeTerminal HedgeTerminal is a full-featured trading terminal inside MetaTrader 5. This is a graphic panel resembling MetaTrader 4 terminal. It allows you to track oppositely directed positions in the manner it is possible in MetaTrader 4. In other words, we can open unlimited number of positions on a single symbol even if positions are in complete or partial hedge (lock). Thus, you can maintain long and short positions simultaneously, which is impossible
FREE

VTrende Pro - MTF indicator for trend trading with a display panel for MT5 *** Videos can be translated into any language using subtitles (video language - Russian)
Although the signals of the VTrende Pro indicator can be used as signals of a full-fledged trading system,
it is recommended to use them in conjunction with the Bill Williams TS.
VTrende Pro is an extended version of the VTrende indicator. Difference between Pro version and VTrende:
- Time zones
- Signal V - signal 1-2 waves
- S
MetaTrader Market - der einzige Shop, in dem man Handelsroboter als Demoversion herunterladen und testen sowie anhand historischer Daten optimieren kann.
Lesen Sie die Beschreibung und Bewertungen anderer Kunden über das gewünschte Produkt, laden Sie es direkt ins Terminal herunter und erfahren Sie, wie man einen Handelsroboter vor dem Kauf testet. Nur bei uns können Sie ein Programm testen, ohne dafür zu bezahlen.
Sie verpassen Handelsmöglichkeiten:
- Freie Handelsapplikationen
- Über 8.000 Signale zum Kopieren
- Wirtschaftsnachrichten für die Lage an den Finanzmärkte
Registrierung
Einloggen
Wenn Sie kein Benutzerkonto haben, registrieren Sie sich
Erlauben Sie die Verwendung von Cookies, um sich auf der Website MQL5.com anzumelden.
Bitte aktivieren Sie die notwendige Einstellung in Ihrem Browser, da Sie sich sonst nicht einloggen können.