Handelsroboter und Indikatoren für den MetaTrader 5 - 25

Cybertrade Keltner Channels - MT5 Created by Chester Keltner, this is a volatility indicator used by technical analysis. It is possible to follow the trend of financial asset prices and generate support and resistance patterns. In addition, envelopes are a way of tracking volatility in order to identify opportunities to buy and sell these assets.
It works on periods longer than the period visible on the chart. All values are available in the form of buffers to simplify possible automations.
FREE

Der Handelsberater dient der Automatisierung des Handels auf Finanzmärkten mithilfe der Indikatoren Bollinger Bands und ATR (Average True Range). Es ist für die Verwendung auf der MetaTrader 5-Plattform konzipiert und ermöglicht Ihnen das Öffnen und Schließen von Positionen abhängig von den aktuellen Marktbedingungen. Optimiert für die Arbeit an XAUUSD+ mit M15-Zeitrahmen
Funktionsprinzip:
Indikatoren:
- Bollinger-Bänder: Werden verwendet, um überkaufte und überverkaufte Niveaus zu besti
FREE
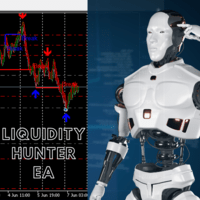
The Liquidity Hunter EA for MetaTrader 5 leverages advanced liquidity concepts inspired by Smart Money Concepts (SMC). Using sophisticated algorithms, the EA identifies key areas of liquidity at extreme and internal swing highs and lows in the market. It strategically plots rectangle clusters around these levels, indicating potential stop areas and liquidity pools. The EA then executes pending limit orders precisely at these identified liquidity zones, optimizing entry points for trades. It fea
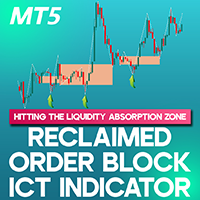
Reclaimed Order Block ICT Indicator MT5 Built upon the ICT trading principles, the Reclaimed Order Block ICT Indicator MT5 for MetaTrader 5 pinpoints essential price areas where an order block is initially breached, leading to a structural shift and the formation of a new trend. As the price revisits these levels post-breakout, the indicator generates strategic buy and sell signals, assisting traders in making data-driven decisions. «Indicator Installation & User Guide» MT5 Indicator Installatio
FREE

El indicador "Mega Spike Boom and Crash" es una herramienta diseñada para su uso en los índices sintéticos, específicamente en los pares Boom y Crash. Su propósito principal es identificar y trazar zonas que funcionan como niveles de soporte y resistencia en distintas temporalidades. La temporalidad mas recomendada para usar este indicador es en el marco de tiempo de 5 minutos El precio de apertura de ( 1 H , 15 M , 30M ) horas son los niveles de precios más importante del día. Representa e

Indicator determines the direction of price movement, calculates the possibility of entering the market using an internal formula and displays a breakout entry signal. Indicator signals appear both at the beginning of trend movements and in the opposite direction, which allows you to open and close orders as efficiently as possible in any of the market conditions. Version for МТ4: https://www.mql5.com/en/market/product/58349
Benefits: a unique signal calculation formula; high signal accuracy; d
FREE

MT5 Candlestick Pattern Alert Indicator: Enhance Trading Precision and Speed Overview The MT5 Candlestick Pattern Alert Indicator stands as a robust solution tailored to empower traders by swiftly detecting candlestick patterns and delivering timely alerts through various channels. This advanced tool facilitates efficient analysis of patterns, enabling traders to seize potential profitable trades promptly. Significance of Candlestick Patterns Candlestick patterns play a pivotal role in technical
FREE

Introduction to X3 Chart Pattern Scanner X3 Cherart Pattern Scanner is the non-repainting and non-lagging indicator detecting X3 chart patterns including Harmonic pattern, Elliott Wave pattern, X3 patterns, and Japanese Candlestick patterns. Historical patterns match with signal patterns. Hence, you can readily develop the solid trading strategy in your chart. More importantly, this superb pattern scanner can detect the optimal pattern of its kind. In addition, you can switch on and off individu
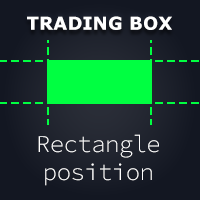
Rectangle position changer tool is used for precise/accurate rectangle positioning by time or price only. You can move each side of rectangle separately with lines created around selected rectangle. This tool will replace classical grid because it is like dynamical chart grid for rectangle grid. This tool allows you to adjust your rectangles, from all 4 sides, with ease and makes your technical analysis that much faster. This tool is handy when corner points for changing rectangle position a
FREE

MACD Divergence Expert Advisor (EA) Overview The MACD Divergence Expert Advisor (EA) automates the MACD Divergence Trading Strategy , identifying and trading both the validation and invalidation of divergence patterns . The EA utilizes the Moving Average Convergence Divergence (MACD) indicator to detect price-momentum discrepancies, providing early signals for potential trend reversals. With customizable thresholds, trendline visualization, flexible entry mechanisms, and risk management feature

Description of strategy: The EA trades on 2 pairs with a positive correlation. On one, he trades only for buying, on the second only for selling. If the position goes to a loss, the adviser begins to resolve it by opening deals much smaller in volume than the original one and biting off small pieces on price rollbacks. The opposite trade, which is in the black, will not be closed until the unprofitable one is resolved or until they reach the specified profit in total.
Clearing (averaging) trades
Automatically scans the chart to find Harmonic Patterns, and give you the chance to enter early in good operations. Also if selected, it will alert you in advance when future patterns appears, showing you a projection of a posible future pattern. The main goal for this algorithm is to determine with high precision the moment when a trend ends and a new one begins. Giving you the best price within a reversal. We have added the "Golden Trade", we define it as the perfect order: For those ord

Order Block Void Indicator MT5
The Order Block + Void Indicator in MetaTrader 5 is an advanced tool designed to detect key liquidity areas and highlight them as order blocks. These zones are frequently utilized by institutional traders, making them ideal reference points for determining support and resistance levels. This indicator visually marks bullish order blocks with green boxes and bearish order blocks with red boxes. Additionally, once an order block is consumed, it turns gray to indic
FREE

The indicator automatically identifies the 1-2-3 pattern on the chart. The indicator is able to monitor the formation of pattern in real time. It informs the trader when the pattern is completely formed (when the price breaks the line in point 2) and displays the completed patterns in history. The patterns are never redrawn. The indicator can identify patterns on any instruments (currency pairs, stock market, gold, etc.) without the need to adjust to each instrument. Simple and clear visualizati

Volume and RSI-based sniper entry signals for Boom and Crash synthetics feature robust entry alert systems. For more advanced filter signals, consider the Harmonic Hybrid Pro. When trading spikes, three orders are strategically placed to manage risk, with the third order positioned close to the highest probability of a spike. Signals are no longer valid fifteen minutes after the final order, and any losses should be closed promptly. For take profit (Tp), it is advisable to exit shortly after a s
FREE

BREAKOUT-SESSION-BOX LONDON EU US ASIA Open
watch the expectation of a volatile movement above or under the opening range We take the high of the range as Entry for a long trade and SL will be the low of the range and vice versa the low of the range as Entry for a short trade and the high for SL The size of the range is the distance to the TP (Take Profit) The range of the opening hours should not be larger than about 1/3 of the average daily range 4 breakout examples are already predefined: A
FREE

The Expert advisor was created based on ORDER BLOCKS AND SMART MONEY CONCEPTS and Pit floor trading strategies. TRADING SETTINGS: Working Time frame : Current to 1 Month i recommend trading from 1Hr to Daily time frames as lower time frames are more prone to markets noise Stop loss : Use this to set your stop loss per trade taken Take Profit : Us
FREE
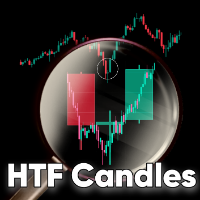
HTF Candles is an indicator which plots the outline of the higher time-frame candles on the lower candle. The indicator gives you the option to choose whether or not to view live current HTF candle, with no lag or repainting. Features No objects drawn on chart: The indicator does not plot any lines or rectangle objects on the chart, it simply draws the htf candles. This keeps your chart simple and clean. MTF Selection: The indicator allows you to choose all the different higher time-frames for e

Der Indicator Automator für MT5 ist ein flexibler MT-5 Expert Advisor für Entwicklung von Handelsstrategien und für den automatisierten Handel auf Basis von bis zu 4 externen Indikatoren. Vorteile:
Import von bis zu 4 Indikatoren (kein Quellcode benötigt) Schnelle Entwicklung von Handelsstrategien Automatisierter Handel ohne aufwendig EA Entwicklung Unterstützung von verschiedenen Money-Management-Methoden Optionale Nutzung von Grid- und Martingale-Techniken Leistungsfähiger virtueller traili
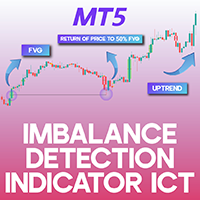
Imbalance Detection Indicator ICT MT5 The Imbalance Detection Indicator ICT MT5 is a specialized tool designed for the MetaTrader 5 platform to recognize three primary types of market imbalances: Volume Imbalances (VI), Opening Gaps (OG), and Fair Value Gaps (FVGs). To enhance readability, the indicator highlights bullish zones in green and bearish zones in red. These imbalances reflect discrepancies between Supply and Demand levels, often signaling areas where price reactions may occur. Indic
FREE
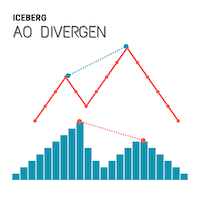
Iceberg Divergen Indicator Uncover the hidden opportunities beneath the surface.
Overview Divergences in the Awesome Oscillator (AO) often signal powerful market reversals, yet spotting them manually can be challenging and time-consuming. Missing out on these opportunities can cost traders valuable entry points. That’s why we created the Iceberg Divergence Indicator — a powerful tool that precisely detects both regular and hidden divergences in AO. With Iceberg Divergence, you won’t just id
FREE

Bollinger Breakout Pro EA Ein intelligenter Breakout-Expert Advisor, der Bollinger-Bänder mit Trendbestätigung für hochwahrscheinliche Trades nutzt. Entwickelt für präzise Einstiege und flexibles Risikomanagement.
Hauptfunktionen Bollinger-Bänder-Ausbruchslogik Startet Trades, wenn der Kurs außerhalb der Bollinger-Bänder schließt, was auf potenzielles Momentum hindeutet.
Intelligente Trendbestätigung Verwendet gleitende Durchschnitte über 50 und 200 Perioden sowie ADX, um sicherzus
FREE

Trade on crypto exchanges in MT5! GRat_Crypto is a tool for manual and automated trading , including ANY available EA, ANY cryptocurrency on most popular crypto exchanges in the familiar MT5 environment 24/7. Features 1. ALL instruments of the 9 most popular crypto exchanges are available: Binance, BingX, Bybit, Coinbase, CoinEx, Kraken, KuCoin, MEXC and OKX . 2. The ability to place ANY type of order available in MT5, both market and pending, to modify orders and positions, to delete order

Note = After the purchase please send me a private message to receive the set file. FCK Emperor EA is best for session's high-low break trading strategy. Option shows for trading. Note = After the purchase please send me a private message to receive the set file. Common set file available in comments. Connect with other traders by joining our MQL5 community of over 390 members. Stay up to date with the latest product updates, tips, and exclusive content. FCK Emperor EA stands o

Synthetic indeces are one of a kind of forex markets. Specially, on boom and crash indices on M1 timeframe is really interesting. I always thought that it was impossible to catch spikes safely until today. Everything has it's limits. This EA is based on martingale strategy with low drawdown. Max grid level is 3. When each trades goes on drawdown, the next trade will be multiplied by 2. The EA does not use take-profit or stoploss . So the backtesting will show the same results as real-time tradi
FREE
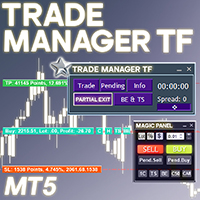
Trade Manager TF Expert MT5 The Trade Manager TF Expert is a specialized tool designed to enhance trade execution, risk management, and capital allocation for traders. It provides a structured approach to managing trades with advanced functionalities, accessible through two primary panels: the Trade Manager panel and the Magic Panel . This expert advisor includes essential features such as Partial Exit, BreakEven, Trailing Stop, order execution, position sizing, and setting profit targets . Thes
FREE

Martingal. Parabolicum ist ein Expert Advisor für mehrere Währungen. Es ist möglich, 10 Währungspaare gleichzeitig zu testen. Arbeitssymbole: EURUSD, GBPUSD, USDCAD, EURCAD, CADCHF, USDCHF, AUDCAD, AUDCHF, EURCHF, EURGBP Zeitrahmen H1 Mindesteinzahlung: 1000 $ (Mindestbetrag 0,01) Empfohlene Mindesteinzahlung: 10000 $ Empfohlener Chargenschritt 0,01 Art des Sicherungskontos Wichtig beim Testen: Um Zeit und Ressourcen zu sparen, wird empfohlen, den Simulationsmodus „1 Minute OHLC“ auszuwählen
FREE

** All Symbols x All Time frames scan just by pressing scanner button ** *** Contact me to send you instruction and add you in "Harmonic Scanner group" for sharing or seeing experiences with other users. Introduction Harmonic Patterns are best used to predict turning point. Harmonic Patterns give you high win rate and high opportunities for trade in during one day. This indicator detects the best and successful patterns based on Harmonic Trading concepts . The Harmonic Patterns Scanner Sc
Unlock the full potential of trading with the Bollinger Bands Expert Advisor (EA) , a highly customizable, automated tool built around the widely-used Bollinger Bands indicator. This EA is designed with advanced filters and flexible settings, empowering traders to manage risk effectively through customizable parameters such as lot size, stop-loss, take-profit, and session filters. With multiple trend confirmation options and versatile trailing stop methods, the Bollinger Bands PROject EA adap
FREE

OK here it is!! I must confess I'm a big fan and user of my Bullscalper and Bear scalper... but this ea is really showing amazing results
what does it do: this ea will open positions based on Fibonacci chart that will be magnetize to your on chart the use of time frame has no meaning the Fibonacci stick to the high and low looking back in hours my suggestion is any thing from a week time to a month let it work its charm
second it will secure positions with an automatic trailing loss
Have f
FREE

Der KPL Swing Indikator ist ein einfaches Trendfolge-Mechanisches Handelssystem, das die Eingabe und Ausgabe automatisiert. Das System arbeitet mit einem harten Stop-Loss und einem Trailing Stop-Loss zur Ausstiegsstrategie bei rentablen Trades. Es werden keine Ziele definiert, da niemand weiß, wie hoch (oder niedrig) der Preis bewegt werden kann. Ein Trailing Stop-Loss sichert Gewinne und entfernt Emotionen aus dem Handel. Von dem Indikator Amibroker konvertiert mit Modifikationen.
Perfekt zum
FREE
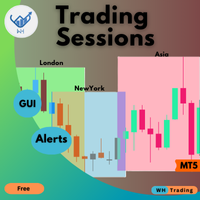
Steigern Sie Ihre Handelspräzision mit dem WH Trading Sessions MT5- Indikator für MetaTrader 5! Dieses leistungsstarke Tool hilft Ihnen, wichtige Marktsitzungen mühelos zu visualisieren und zu verwalten. Basierend auf: WH SMC Indicator MT5
MT4-Version: WH Trading Sessions MT4
Hauptmerkmale: Interaktives GUI-Panel – Einfaches Auswählen und Umschalten zwischen Handelssitzungen in Asien, London und New York .
Anpassbare Warnungen und Einstellungen – Passen Sie den Indikator
FREE

Quantum Dow Jones Quantum Dow Jones Einstellungen Symbol: US30 Zeitrahmen: 5M Lots: Lots Durchschnittlicher Gewinn pro Handel Maximaler Drawdown (MAX DD) Nettogewinn in 2 Jahren 0.01 $0.20 $2.76 $240 0.10 $2.00 $27.6 $2,400 1.00 $20.0 $276 $24,000 10.0 $200 $2,760 $240,000 Übersicht Der Quantum Dow Jones ist ein ausgefeiltes automatisiertes Handelswerkzeug, das speziell für den Handel am Dow Jones entwickelt wurde. Mit einer durchschnittlichen Frequenz von 45-50 Trades pro Woche kombiniert diese
FREE
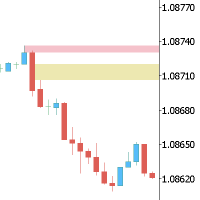
This Expert is the perfect companion for SMC/ICT users.
It allow to draw easily the Supply , Demand , Imbalance(fvg) zones as well set up MetaTrader alerts if price touchs the zone. Imbalance (fair value gap) have options to be displayed in full or based on the filling to the follwing candle, so you will never miss one.
You can also zoom on a clande with a specific period. Very usefull when you look at an 1h candle in the past and you want to see the details in M5.
How does it work ? Simply s
FREE

The VSA Scanner Dashboard is a multi-symbol, multi-timeframe scanner that displays VSA signals. It is based on the Volume Plus and VSA Signals indicator. Features Displays the VSA signal of the last closed candle. Monitors 28 customizable instruments (symbols) and up to 21 timeframes at the same time. Easily arrange symbols in any order. Each signal has a tooltip that displays the name and time of appearance. Click on each signal to open a new chart. All types of alerts (sound, pop-up, email,

USER MANUAL LINK
INITIAL OFFER
Free downloads that will work in live accounts until April 30th 2025. Afterwards, the EA will stop trading.
On May 1st 2025, paid downloads for unlimited-use will be available for the first five downloads or 5 days, whichever is first, for just 30 US$ each.
After the first five paid downloads, or 5 days, ZING will be sold at the regular price of 249 US$. Before running ZING, ma ke sure that your account size matches with the initial deposit input parameter in the
FREE

The Volume Weighted Moving Average (VWMA) is calculated based on Prices and their related Volumes giving importance to those candles with more Volume. During periods of almost equal volume distributed along the observed period (commonly, in low volume periods) the VWMA will be graphically similar to a Simple Moving Average. Used along other moving averages a VWMA could be used as an alert, filter or whatever your imagination could think of...
HOW TO "READ" THIS INDICATOR As any Moving Average.
FREE

Top bewertet auf anderem MarketPlace - Jetzt verfügbar auf METATRADER Identifizieren Sie Bereiche und die nächsten wahrscheinlichen Bewegungen | Erhalten Sie früheste Signale und die Stärke von Trends | Klare Ausstiegssignale vor Umkehrung | Erkennen Sie die Fibo-Levels, die der Kurs testen wird | Indikator, der nicht zurückverfolgt, nicht verzögert - ideal für den manuellen und automatisierten Trading - geeignet für alle Vermögenswerte und Zeiteinheiten Noch 5 Exem

Auto Fibo Expansion is an indicator that projects the Fibonacci expansion levels above and below the opening price of the day. It does the calculation based on the previous day and projects the levels on the current day. It is very efficient to find "psychological" zones of support and resistance. Its appearance is all configurable and you can set up to 30 different levels. Enjoy! This is a free indicator, but it took hours to develop. If you want to pay me a coffee, I appreciate a lot <3 PayP
FREE

Professional tool for professional traders It allows you to browse all available financial instruments and select best ones to trade with lightning speed.
Fastest market screening ever
Move your mouse over the instruments and instantly see 3 charts with selected timeframes and predefined indicators! Click on the symbol name to hold it. Use UP and DOWN keys to select previous / next instrument.
Ultimate charting Smooth scale, automatic indicator lines width, smart grid and much more. You'll li
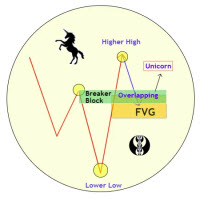
Unicorn Model ICT Indicator — Smart Trading with Precision The Unicorn Model ICT Indicator is a powerful and intelligent tool designed for traders who follow Smart Money Concepts (SMC) and Inner Circle Trader (ICT) methodologies. This indicator simplifies complex price action by visually identifying key market structures and providing high-probability trade setups. Key Features: A Bullish Unicorn Pattern A Lower Low (LL), followed by a Higher High (HH) A Fair Value Gap (FVG), overlapping the est

The indicator that shows the countdown to the change of candles is equipped with an alert when the bar changes (the alert is not active if installed on the M1 time frame). Displays seconds if installed in time frame M1, displays minutes and seconds if installed in time frame above M1, and displays hours and minutes if installed in time frame h1 and above. The time displayed is calculated based on the running time.
FREE
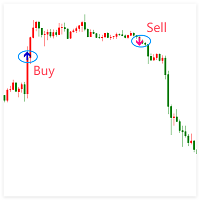
Extreme Breakout Signal is a trading strategy based on price breaking through key support or resistance levels. It indicates potential trend shifts, allowing traders to capture new upward or downward movements.
Parameter extreme radius: extreme radius( Different parameters can be set for different periods ) Key Principles Support & Resistance : Prices often reverse near these levels; breaking them may signal a new trend. Confirmation : Use volume or other indicators to verify the breakout's

Der Expert Advisor "Speedometer" basiert auf einer Strategie zur Analyse der Tick-Geschwindigkeit, die Ein- und Ausstiegspunkte auf der Grundlage von Änderungen der Tick-Datenrate identifiziert. Der Expert Advisor überwacht die Tick-Dynamik und öffnet Positionen, wenn ein bestimmter Tick-Geschwindigkeitsschwellenwert erreicht ist, was rechtzeitige Markteintritte bei hoher Aktivität und das Vermeiden von Trades bei geringer Volatilität ermöglicht. Der Expert Advisor unterstützt folgende Einstell
The Omega Trend Indicator is an advanced tool that has been specifically designed to detect market trends early, and follow them efficiently. The indicator draws two lines. The main (thicker) Trend Line represents the presumed lower or upper volatility limits of the current market trend. A break in the main Trend Line indicates a potential reversal or shift in the movement of the trend. The Trend Line also indicates the best point to place a stop loss order. In Omega Trend Indicator, the Trend L
FREE
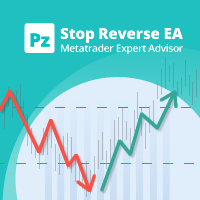
Dieser EA stellt verlorene Trades mithilfe eines sequentiellen und kontrollierten Martingals wieder her: Er platziert aufeinanderfolgende Trades mit zunehmender Losgröße, bis der ursprüngliche Trade wiederhergestellt ist, plus einem kleinen Gewinn. Es bietet ein komplettes, problemloses Handels-Framework, von der Verwaltung der ersten Trades bis zur Wiederherstellung. Bitte beachten Sie, dass der EA ein Martingal implementiert, was bedeutet, dass er Bilanzverluste hinzunehmen hat, die später wie

Fibomathe Indicator: Support and Resistance Tool for MT5 The Fibomathe Indicator is a technical analysis tool designed for MetaTrader 5 (MT5) that assists traders in identifying support and resistance levels, take-profit zones, and additional price projection areas. It is suitable for traders who use structured approaches to analyze price action and manage trades. Key Features Support and Resistance Levels:
Allows users to define and adjust support and resistance levels directly on the chart.

Show Pip Value and Spread on Chart as Object or Comment. User can select to display Pip Value and/or Spread by object on main Chart, or show both only as Comment lines on chart. Object Color, Font face and Size and also which corner to show, may change by user. Pip Value calculated in accordance of input Lot size , Default is 1 lot . Can use at all currency pairs , Gold , Silver and most other charts.
FREE

Fully automatic trading system that trades Renko bars and trend indicators. Renko bars are drawn in the indicator window below the chart. The signal to sell or buy is the intersection of renko and indicator signal. The default settings for the euro / dollar pair, t he EA has shown the best results for the pair GBPJPY and GOLD . The timeframe for trading is m1. There is a time filter. The EA has an autolot system. Our telegram channel After installing the EA, download the installation set
FREE
Unlock the power of automated trading with the GA Stochastic Oscillator Expert Advisor (EA) , a cutting-edge tool designed to revolutionize your trading experience. Built around the highly reliable Stochastic Oscillator indicator, this EA empowers traders to capitalize on market opportunities with precision and efficiency. Whether you're a beginner or an experienced trader, the GA Stochastic Oscillator EA offers unparalleled flexibility, allowing you to customize a wide range of parameters to
FREE

Offer of a pack of all our EAs, with support and updates.
Introducing Our EA for BTC: BTC Stable Exness M30 Product Description: The "BTC Stable" EA is specifically designed to trade in the cryptocurrency market with high precision and probability of success. With this algorithm, optimized and tested on Exness, you'll achieve impressive results for your BTC investments. Perfect for traders seeking consistency and long-term stability. Backtest Results: Initial Capital: $200
Total N
FREE

This EA runs on Volatility 75 index (M12 Timeframe). EA is fully dynamic (dynamic lot size, dynamic SL, dynamic TP, and dynamic trailing SL). Recommended account $200. Please note, Volatility 75 Index is available on Deriv Broker (make sure to use on Volatility 75 Index, 12M timeframe)
Please join discord for any and all questions. For Volatility indexes use Deriv (broker) https://deriv.com/markets/derived-indices/synthetic-indices
Direct purchases will only be in discord.
Assorted bots avail
FREE

Smarter handeln mit Echtzeit-CRT-Alerts! Der CRT Alert EA ist für Trader konzipiert, die mit der Candle Range Theory (CRT) arbeiten. Das Tool überwacht mehrere Zeitrahmen und sendet eine Benachrichtigung, wenn die dritte Kerze erscheint – ideal für manuelles Trading. Hauptfunktionen:
Echtzeit-Benachrichtigungen
Multi-Zeitrahmen-Überwachung
Anpassbare Einstellungen
Push-Nachrichten für MT5
Weitere Features folgen bald Funktionsweise:
1️⃣ Überwachung von 3 aufeinanderfolgend

Idea extracted from the books by Anna Coulling and Gavin Holmes using Volume and Spread Analysis (VSA) techniques coupled with Al Brooks' expertise with Price Action these candles are magical, identify the exact moment
of the performance of the big players are acting in the market represented by the colors:
1) Red Candles we have an Ultra High activity,
2) Candles Orange we have a Very High Activity
3) Candles Yellow we have one High Activity
4) White Candles represent normal activity in
FREE
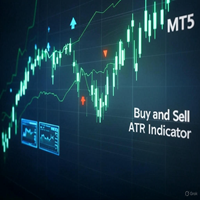
Buy and Sell ATR Indicator The Buy and Sell ATR Indicator is a powerful trend-following tool for MT5, combining ATR-based trend detection with RSI confirmation. It plots a dynamic trend line and generates clear buy (blue arrows) and sell (red arrows) signals when price action confirms a trend over a user-defined number of candles. A unique flat market filter, based on average ATR, prevents signals in low-volatility conditions. Customize ATR periods, RSI levels, signal thresholds, and arrow styl
FREE

Dies ist ein einfacher Candle Stick Pattern Indikator, der in jeder Zeiteinheit funktioniert und nach standardmäßigen Paramtern automatisch entsprechende Pattern im Chart anzeigt, sobald die Bedingungen erfüllt sind. Folgende Candle Stick Pattern sind derzeit implementiert: Bullish Hammer | Bearish Hammer Bullish Inverted Hammer | Bearish Inverted Hammer Bullish Engulfing | Bearish Engulfing Piercing | Dark Cloud Cover Bullish 3 Inside | Bearish 3 Inside Die Formationen werden automatisch berech
FREE

Based on the Extreme Trend Indicator on Trading View converted for MT5. Usage of the Indicator is free, but if you want the source code, you can purchase the source code by messaging me.
Extreme Trend is an indicator that identifies when a new trend is forming and creates a trading signal. This indicator can be used for many markets, forex, gold etc. If you have any inquiries or want to create an EA using this indicator, you can message me.
FREE

Golden Trend Pulse — trend indicator developed specifically for Gold, also applicable to the Cryptocurrency and Stock markets. The indicator is designed for precise determination of market trends using advanced analytical methods. The tool combines multifactor analysis of price dynamics and adaptive filtering of market noise, ensuring high accuracy in identifying key entry and exit points. Thanks to its intelligent system, the indicator effectively handles market variability, minimizing false
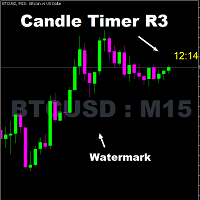
Timer remaining to finish the candle. A simple informative indicator of how much time is left until the current candle ends. In a simple, easy and objective way. In the input parameters, enter the desired color of the clock, the font size and the displacement to the right of the candle. I hope I helped with this useful and free tool. Make good use and good business.
FREE

CommunityPower EA — is the Expert Advisor for MetaTrader 4/5, created by community and for community. It is free, versatile and very powerful, and allows to trade a wide range of strategies. The idea is simple Your suggestions + my code = a win-win for everyone!
Is it a ready-to-use money-making machine? No, it is definitely not. It is a tool, which allows you to create and run your own trading strategy, and it is up to you to find profitable settings and take the responsibility for your tra
FREE
Risk Control Advisor
"Risk Control" ist ein fortschrittlicher Positionsmanager für MetaTrader 5, der den Prozess des teilweisen Schließens von Positionen auf Basis von vorgegebenen Risikoparametern und dem Risiko-Ertrags-Verhältnis (RR) automatisiert. Der Advisor hilft Händlern, offene Positionen effektiv zu verwalten, Risiken zu minimieren und potenzielle Gewinne zu maximieren. Weitere Produkte -> HIER Hauptmerkmale: - Automatisches, teilweises Schließen von Positionen basierend auf vorgegebe
FREE

Tax Buddy creates a simple, sortable trading report which you can send to your local tax authorities alongside your annual declaration. I've been using this kind of report for the German Finanzamt in order to declare my capital gains ("Kapitalerträge") in a readily comprehensible manner. For testing purposes, the Demo version places random trades in the Strategy Tester on the symbol of your choice and creates a demo report for them.
Conveniently, all reports are stored in the common path for al
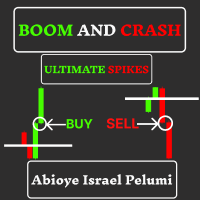
Einführung in Boom and Crash Ultimate Spikes Der Boom and Crash Ultimate Spikes EA wurde speziell für den Handel mit Boom- und Crash-Märkten entwickelt, darunter Boom 1000 Index, Boom 900 Index, Boom 600 Index, Boom 500 Index, Boom 300 Index, Crash 1000 Index, Crash 900 Index, Crash 600 Index, Crash 500 Index und Crash 300 Index. Dieses EA ist extrem benutzerfreundlich und erfordert nur einen einzigen Eingabeparameter, im Gegensatz zu anderen EAs, die komplizierte und frustrierende Konfiguration

Stargogs Pay EA Is an Trend, scalping and Hedging EA to protect accounts from blowing and gain profits. It uses Hedging Its Based On EMA's For Scalping, Daytrading and swing. Can trade on small accounts Small to no Risk on Bigger accounts. Low Drawdown. Special Entries. EA works on all currencies, metals, indices, stocks, volatility indices, Boom & Crash indices, Jump indices. Minimum Deposit $10 Parameters Lotsize Lot Multiplier (Can be changed based on account balance) 0.0 To Turn Multiplie

Using the Stochastic Oscillator with a Moving Average is a simple but very efficient strategy to predict a trend reversal or continuation.
The indicator automatically merges both indicators into one. It also gives you visual and sound alerts.
It is ready to be used with our programmable EA, Sandbox, which you can find below: Our programmable EA: https://www.mql5.com/en/market/product/76714 Enjoy the indicator!
This is a free indicator, but it took hours to develop. If you want to pay me a coff
FREE
Fundamental Scanner is a Non-Repaint, Multi Symbol and Multi Time Frame Dashboard based on Fundamental Signals Indicator . Fundamental Signals Indicator has a powerful calculation engine that can predict market movement over 3000 pips (30000 points). The indicator is named fundamental because it can predict trends with large movements, no complicated inputs and low risk.
Features :
Multi-Symbol Support (Support automatic listing of market watch symbols) Multi-TimeFrame Support (Over 7 custo

BreakRunner - Automatisierter Handel mit fortschrittlichem Risikomanagement
BreakRunner ist ein Expert Advisor, der für Trader entwickelt wurde, die ihre Handelsstrategien mit einer auf Price Action basierenden Scalping-Strategie und fortschrittlichem Risikomanagement automatisieren möchten. Der Roboter erkennt Preisakkumulationen und führt Kauf- oder Verkaufsaufträge aus, wenn wichtige Hoch- oder Tiefpunkte durchbrochen werden. Hauptmerkmale Handelsstrategie: Erkennung von Preisakkumulationen u
FREE

Dieser Indikator bildet einen Kanal basierend auf den Messwerten des ADX-Indikators (Average Directional Movement Index), zeigt den Händler an und informiert ihn über eine Preisumkehr an den Grenzen dieses Kanals. Er kann auch melden, wenn der Preis die Kanalgrenzen berührt. Außerdem werden zusätzliche gepunktete Linien gezeichnet, die von den + DI- und -DI-Werten des ADX-Indikators abhängen. Es besteht auch die Möglichkeit, Signale in Abhängigkeit von den stochastischen Messwerten zu filtern.
FREE

Arbency ist ein Latency Arbitrage Expert Advisor, der darauf ausgelegt ist, schnelle Preisunterschiede zwischen zwei oder mehr Broker-Feeds auszunutzen.
Arbency wurde sorgfältig entwickelt, um Daten effizient zwischen einer beliebigen Anzahl lokaler Terminals auszutauschen. Weitere Erläuterungen zum Strategiekonzept und Informationen zur Verwendung des Experten finden Sie im Benutzerhandbuch. Signale und Gruppenchat: https://www.mql5.com/en/users/conorstephenson MT4 kann nicht zu
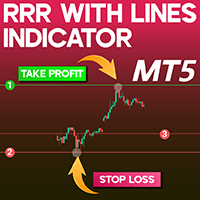
RRR with lines Indicator Download MT5 Effective risk management is a fundamental aspect of sustainable trading in financial markets. The RRR Indicator in MetaTrader 5 provides traders with a structured approach to calculating the Risk-to-Reward Ratio (RRR) . By drawing three adjustable horizontal lines, it assists traders in setting Stop Loss and Take Profit levels with precision. «Indicator Installation & User Guide» MT5 Indicator Installation | RRR with lines Indicator MT5 | ALL Products By
FREE
MetaTrader Market bietet jedem Entwickler eine einfache und bequeme Plattform für den Verkauf von Programmen.
Wir unterstützen Sie bei der Veröffentlichung des Produkts und beraten Sie gerne, wie man eine Beschreibung für den Market vorbereitet. Alle Produkte, die im Market verkauft werden, sind durch eine zusätzliche Verschlüsselung geschützt und können nur auf dem Rechner des Kunden gestartet werden. Illegales Kopieren ist ausgeschlossen.
Sie verpassen Handelsmöglichkeiten:
- Freie Handelsapplikationen
- Über 8.000 Signale zum Kopieren
- Wirtschaftsnachrichten für die Lage an den Finanzmärkte
Registrierung
Einloggen
Wenn Sie kein Benutzerkonto haben, registrieren Sie sich
Erlauben Sie die Verwendung von Cookies, um sich auf der Website MQL5.com anzumelden.
Bitte aktivieren Sie die notwendige Einstellung in Ihrem Browser, da Sie sich sonst nicht einloggen können.