Handelsroboter und Indikatoren für den MetaTrader 5 - 197
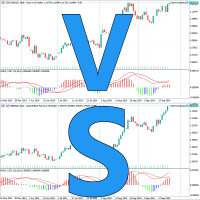
Wir präsentieren Chart Compare – Ihr ultimatives Tool zur Synchronisierung mehrerer Diagramme
Jetzt im Angebot für 39 $ (normalerweise 59 $)
Synchronisieren Sie nahtlos mehrere Diagramme für sofortige Einblicke.
Hauptfunktionen:
Blitzschnelle Synchronisierung: Ereignisgesteuerte Technologie sorgt für reibungslose und sofortige Aktualisierungen aller Diagramme.
Schlank und effizient: Minimale Nutzung der Systemressourcen für optimale Leistung.
Schnelle Vergleiche: Vergleichen Sie ähnliche

First Minute Balance Rate Prop FTMO Broker.
Only for DE40, US100, US30. This Version works with fixed Lot. Automatic add London and US Session.
One Trade a Day when SL and TP on 10k pip. Robot Strategy: Trade open = First Tick in Direction.
TP and SL can be 10k pips for a different Balance Strategy. Write me a Message of a few Questions when you are undecided. Ex4 Code by Request.

Manager PRO is an advanced tool for automated position management in the Forex market, designed to optimize profits and minimize losses. The EA automatically closes positions when a specified profit or loss threshold is reached, enabling precise risk management across multiple symbols simultaneously. This tool is ideal for prop firms, where controlling daily loss limits is crucial. Key Features: Profit and Loss Management: Automatically closes positions when profit or loss reaches the specified

BollingerPro - Your Complete Solution for Leveraging Bollinger Bands and Volume BollingerPro is a sophisticated Expert Advisor (EA) designed for traders who want to capitalize on Bollinger Bands, volume, and ATR (Average True Range). This robot is ideal for traders looking to use an automated strategy based on reversal signals, incorporating proven technical indicators to maximize potential gains while controlling risk. Key Data Utilized: Bollinger Bands : to identify dynamic support and resista

MT4 Version | User Guide
Optimize Your Trading with Risq Manager In trading, precise risk management is essential to achieving long-term success. However, opening a trade while adhering to strict risk management rules can be complex and time-consuming, especially on the MetaTrader platform. Simplifying the Trading Process Risq Manager is designed to simplify and automate these repetitive tasks. Whether you're a beginner or an experienced trader, this tool streamlines the process while ensurin

Launch Promo: Limited Offer! Be one of the first 100 people to get GSFX VORTEX GOLD TRADER at a special launch price! Secure your copy now and take advantage of this incredible deal before the price goes up. Hurry! Once 100 spots are filled, the price will be raised! Don't miss out—get your edge in Gold trading today!
GSFX VORTEX GOLD TRADER
Maximize your Gold trading potential with GSFX VORTEX GOLD TRADER, designed for precision and optimal performance. Powerful Bollinger Bands Stra

Long Term Buy Set1: TP/SL20kpip. Set2: TP/SL10kpip. Set3: TP/SL 5k pip. Set4: TP/SL 2k pip. Set5: TP/SL 500pip. Rate Prop FTMO Broker.
Only Pair DE40, US100, US30. Automatic added EU London Session. This Version works only with fixed Lot and buy. Robot Strategy: Trade open = First "Round Price-Number Entry". Write me a Message of Questions when undecided. I send ex4 Code by Request.

Billionaire Ea Studiato nei minimi Particolari Grossa percentuale di profitti!
NUOVO SET PER PIU' COPPIE INSIEME BASSO SPREAD TIME FRAME M5 SET NEI COMMENTI Time Frame H1 (M5 PER PIU' COPPIE INSIEME SU 500€ LOTTO 0.01 ANCHE 4 COPPIE ALTERNATE ESEMPIO EURUSD , USDCHF Ecc) Capitale minimo 500€$\$ LOTTO =0.10 - 1000€$ = 0.35 Coppie( XAUSUSD /EURUSD /EURAUD principalI) e su tutte le altre basso spread Conti ECN (consigliato) SE VOLETE FAR MOLTI PIU' PROFITTI POTRETE METTERE LE 3 CO
Nadaraya Watson Envelope Multicurrency Scanner MT5: Key Features The Nadaraya Watson Envelope Multicurrency Scanner Dashboard provides a streamlined way to monitor crucial reversal signals across multiple currency pairs and timeframes. Built on the popular TradingView indicator known for its accurate reversal calls, this scanner adapts the same core logic into an MT4/MT5-friendly format. It focuses on short-term opportunities in lower timeframes and strong trend signals in higher ones, help
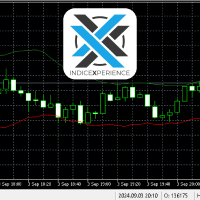
Indicador para mercado de Índice Futuro Brasileiro (WIN) __________________________________________________________________________________________________
O indicador trabalha com rompimento de canal indicando o sentido do movimento e os 3 possíveis TP e o SL baseado no ATR.
Indicação de utilização em TimeFrame de 5M, mas pode ser utilizado em qualquer tempo gráfico de sua preferencia. __________________________________________________________________________________________________

Hello community, on this occasion I present to you Boom 500 Deluxe It is a bot programmed for the Boom 500 pair, adapting to what Prop Firms are. Funding accounts. where he works with a simple and effective strategy, hunting SPIKES trends works in purchasing, accompanying it the Stochastic indicator with its already modified parameters It is adapted with a minimum capital of 1000usd or if it is for funding accounts with 5000usd which would be the minimum for prop firms. It can be used with a max

CVB Cumulative Volume Bands: Maximieren Sie Ihre Trades mit kumuliertem Volumen! Der CVB Cumulative Volume Bands ist ein fortschrittlicher Indikator, der für Trader entwickelt wurde, die präzise Signale auf Basis des kumulierten Volumens suchen. Durch die Nutzung von kumulierten Volumenbändern bietet dieser Indikator klare Einblicke in den Kauf- und Verkaufsdruck am Markt, um Umkehrungen und starke Kursbewegungen zu identifizieren. Hauptmerkmale: Analyse des kumulierten Volumens :

This indicator is one of our first brilliant programs, the indicator is quite useful and seems to give the best results when combined with price action, and a combination of oscillators , mainly the Bollinger bands and the moving average , you can also use this on all time frames but be careful on the lower time-frames as the trend is not too steady or rather moves fast, this will help you have better entries.

This is one of our best products available on the market, it will work with every pair you can think of, this ea works together hand in hand with the trend and support and resistance strategy , it will work with all the timeframes and all oscillators , this will amaze you on how best it works and makes trading a whole lot easier you can use this with the rsi oscillator for best results.

EuroScout: Ihr strategischer Partner für langfristigen Erfolg im Forex!
Maximieren Sie Ihre Gewinne mit EuroScout, dem Trading-Bot, der für EUR/USD im H1-Zeitrahmen entwickelt wurde und auf nachhaltige Ergebnisse über einen längeren Zeitraum optimiert ist. Was macht EuroScout einzigartig: Für H1 optimiert: Präzision und Zuverlässigkeit für den Intraday-Handel mit EUR/USD. Risikomanagement: EuroScout minimiert die Exposition durch fortschrittliche Risikomanagement-Strategien. Langfristige Strateg
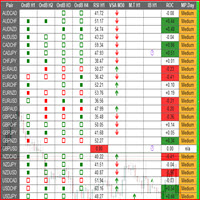
This is a multipurpose indicator and has the following indicators in it with dashboard ( scanner) and chart indicator on multi time frames .
Divergent Bar
Market Profile ( Daily Weekly Monthly Intraday and Custom Period , Market Profile Day type )
Order Block
Inside Bars
Higher High Higher Close and Lower Low and Lower Close
Imbalance Finder
Scalping
Currency Strength Meter
Momentum candles
VSA Setups
Much more See for your self Forexsource.net
USERS WILL GET ACCESS to Forexs
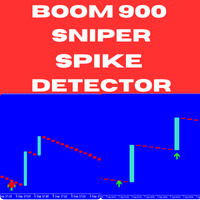
Boom and Crash Sniper Spike Detector - Boom 900 Unlock the potential of spike trading on Boom 900 with the Boom and Crash Sniper Spike Detector. This cutting-edge indicator provides precise and clear signals, helping you identify high-probability trades and capture spikes effortlessly. Designed for traders who want to enhance their trading performance, this tool simplifies the process of detecting spike opportunities. Key Features: Multi-Timeframe Compatibility : The indicator works across multi

Mad Panda Bot MT5 is a powerful expert advisor that utilizes a basic, scale-in drawdown grid formula. Widen or tighten the grid for the ultimate risk management tool, creating infinite possibilities for low to high risk. This EA can trade any market. Choose between trend, hedge, martingale or single sided (long/short) trading.
Hello, my name is Bill Mitzlaff. I started building this strategy in 2016. I spent two years optimizing in a demo account. I started trading live with this strategy in 2

This is Multiple Timeframe of Malaysia SNR Levels and Storyline. The single timeframe version here Features: + Display level on multiple timeframe (higher or lower) + Turn on/off level on timeframe + Alert when price touch level 1. if high > resistance level but close of candle < resistance level , this level become unfresh - Name of level will have "(m)" meaning mitigated if close of candle > resistance level , this level become invalid and can be removed in chart (there is setting for keep/rem

This indicator converted from Squeeze Momentum Indicator [LazyBear] version on TradingView [---- Original Notes ----]
This is a derivative of John Carter's "TTM Squeeze" volatility indicator, as discussed in his book "Mastering the Trade" (chapter 11). The Squeeze Momentum Indicator (or TTM Squeeze) is an indicator that measures volatility and momentum, based on price movement within a tight range for a period of time and then breaking out sharply to initiate large moves.
The most popular versi

ZigZag function
The first zigzag was proposed by Arthur A. Merrill in 1977 and is based on the vertical axis (price range %). The second zigzag is based on the horizontal axis (period), which is widely known in MT4 and MT5. this is the third zigzag designed from a completely new perspective. However, it is not based on originality, but on more fundamental theory.
First, I created the smallest zigzag 0. I bundled zigzag 0 together in accordance with Dow Theory to create zigzag 1. I bundled z

CustomRSI50 Alert and Mail at Cross Indikator CustomRSI50 Alert and Mail at Cross Indikator Beschreibung Der CustomRSI50 Alert and Mail at Cross Indikator ist ein fortschrittlicher technischer Indikator, der auf dem beliebten Relative Strength Index (RSI) basiert. Er wurde entwickelt, um den automatisierten Handel zu vereinfachen, indem sofortige Benachrichtigungen über Alarme und E-Mails gesendet werden, wenn der RSI-Wert die Schwelle von 50 überschreitet. Der Indikator bietet eine klare und an
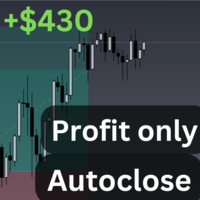
Expert Advisor Overview: This Expert Advisor (EA) is specifically crafted for traders who want to efficiently manage their open trades on a specific symbol by ensuring that all positions are closed once a predefined profit target is achieved. Whether you are trading forex, stocks, or commodities, this tool offers a streamlined and automated way to lock in profits, minimizing risk and maximizing control. Key Features: Profit Target Control: The EA monitors the total net profit of all open positio

To achieve mutual support between MT4 and MT5, and to purchase the MT4 version, please click here>> Main follow-up function: 1. Reverse order capability 2. Cross platform follow-up, ignoring different names 3. Proportional order, magnification and reduction order 4. Compared to a specified currency pair, not compared to a specified currency pair 5. Can be ordered one to many, many to one, any order 6. Other unclear messages

AlphaStrike EA is an advanced automated trading system designed for the MetaTrader 5 platform, utilizing a combination of technical indicators and sophisticated risk management strategies to identify and execute trading opportunities in the forex market. This robot is optimized to operate across multiple symbols simultaneously, offering flexibility to apply various strategies on different instruments. By default, AlphaStrike is configured to trade on EURUSD, GBPUSD, and EURGBP pairs on the M15
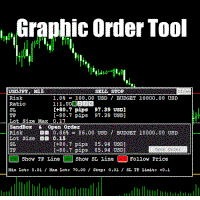
Graphic Order Tool
Graphic panel to help trader to make orders.
Drag TP line, SL line and/or ENTRY line with immediate calculation of the profit and loss in pips and USD.
Risk management: Set % of your balance you can risk in the order to make it safe for your money.
Automatically detect the type of possible order (BUY, SELL, BUY_STOP, SELL_LIMIT, BUY_LIMIT, SELL_STOP) depending on mode (BUY/SELL) and position of lines ENTRY , TP , SL .
Panel is semi-transparent, not to cover the main char

Chandelier Exit for MT5 The Chandelier Exit indicator is designed to dynamically set stop-loss levels based on market volatility, measured through the Average True Range (ATR). Key Features: ATR-Based Stops : The indicator calculates stop-loss levels for long and short positions using a moving average of the True Range (ATR), adapting to market volatility changes. Customizable Parameters : Users can set the ATR period, ATR multiplier, and choose whether to use the closing price to determine pric

Heiken Ashi CE Filtered is an indicator that generates trading signals based on Heiken Ashi candlesticks with additional filtering. For filtration is used: Chandelier Exits , based on ATR changes, to determine the direction of the trade. You can download this indicator here: Chandelier Exits Zero Lags SMA , based on linear regression, for additional trend confirmation. You can download this indicator here: Zero Lags SMA Main Functions: Buy/Sell Signals: the indicator generates entry and exit po

Master Close via Telegram can help you perform some management tasks on MT4/MT5 remotely via your Telegram by one click, easy to set up & use. Demo here (see more Master Notify Master Control ) ************************************************************************************ LIST OF COMMANDS: info_acc - Get account info info_pen - Get pending orders details info_pos - Get positions details info_pos_sum - Get positions summary
close_pen - Delete all pending orders close_pos_all -
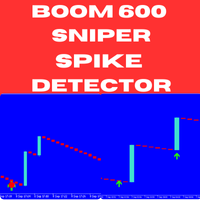
Boom 600 Sniper Spike Detector - MQL5 Listing Description Introducing the Boom 600 Sniper Spike Detector – a cutting-edge, non-repainting indicator designed to help you effectively capitalize on spikes in the Boom 600 market. Ideal for both seasoned traders and beginners, this indicator offers precise, actionable signals to enhance your trading strategy and maximize your profit potential. Key Features: Non-Repainting Signals : Guarantees reliable and consistent signals that do not repaint, provi
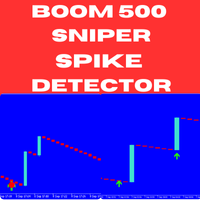
Introducing the Boom 500 Sniper Spike Detector – an advanced, non-repainting indicator specifically crafted to help you capture spikes in the Boom 500 market with precision. Whether you are an experienced trader or just starting, this indicator provides reliable signals that simplify spike trading, making it an essential addition to your trading arsenal. Key Features: Non-Repainting Signals : The Boom 500 Sniper Spike Detector generates highly reliable signals that do not repaint, allowing you t
Smart Fractals Indicator - Ein erweitertes Fraktal für Ihr Trading auf MT5 Der Smart Fractals ist die Weiterentwicklung des klassischen Fraktal-Indikators, den Sie auf Ihren Charts kennen und verwenden. Speziell für MetaTrader 5 entwickelt, identifiziert dieser Indikator nicht nur klassische Marktumkehrpunkte, sondern geht darüber hinaus und macht Ihr Trading effizienter und rentabler. Wir haben das Grundkonzept der Fraktale genommen und es in ein intelligenteres und funktionaleres Werkzeug verw

The Super Trend Extended Indicator is a powerful tool designed to assist traders in identifying market trends and making informed trading decisions. It combines a robust trend-following algorithm with advanced filtering options to provide precise entry and exit signals. Key Features: Trend Identification : The indicator effectively highlights the current market trend, whether bullish or bearish, helping traders stay on the right side of the market. Customizable Parameters : Users can adjust sens

Overview :
The Advanced News Trading Panel is a versatile tool designed for traders who rely on news-based trading strategies. This Expert Advisor (EA) provides an intuitive graphical interface that allows users to quickly set up pending orders and manage risk with ease. With the ability to automatically place Buy/Sell Stop orders based on your pre-set stop order distance from the bid/ask price, stop-loss and take-profit levels, the EA allows for precision trading during high-volatility news eve

Entdecken Sie GBPCrasher: der Bot, der für diejenigen entwickelt wurde, die ihre Forex-Handelsoperationen mit Sorgfalt und Strategie optimieren möchten!
GBPCrasher ist ein algorithmischer Handelsbot, der für den Handel auf dem GBP-Markt mit einem M15-Zeitrahmen entwickelt wurde. Er ist für diejenigen gedacht, die eine langfristige, automatisierte Lösung suchen und darauf abzielen, Marktschwankungen mit einem vorsichtigen Ansatz und dem Fokus auf stetiges Kapitalwachstum zu nutzen. Strategie basi

Certainly. Here's the explanation in English: This program is a custom indicator that calculates the MACD (Moving Average Convergence Divergence) and shows the crossovers between the MACD and Signal lines. Here are the main functions of the program: MACD Calculation: Calculates the difference between the Fast EMA (Exponential Moving Average) and Slow EMA. This difference forms the MACD line. Signal Line Calculation: Creates the Signal line by taking a simple moving average (SMA) of the MACD valu

Question : What wins Wars? Answer : Anticipation!
"Anticipation" is a powerful MQL5 Expert Advisor (EA) designed specifically for trading Gold (XAUUSD) on the 5-minute timeframe. It integrates advanced trading features, focusing on intelligent risk management, precision entry and exit strategies, and dynamic trade management. This EA is ideal for traders looking to maximize profits while minimizing risks in volatile markets like Gold.
Key Features:
Intelligent Trade Status: Prevents adding n

ZigWave Oscillator: Optimieren Sie Ihre Trades mit Oszillatoren und ZigZag! Der ZigWave Oscillator ist das perfekte Werkzeug für Trader, die Präzision und Klarheit bei der Analyse des Finanzmarkts suchen. Dieser Indikator kombiniert die Stärke der Oszillatoren mit der visuellen Einfachheit von ZigZag und hilft Ihnen, die besten Kauf- und Verkaufsgelegenheiten schnell und effizient zu identifizieren. Warum den ZigWave Oscillator wählen? Präzise Oszillatoranalyse : Integrieren Sie RSI, W

AI forex robot is an advanced trading tool that utilizes sophisticated algorithms and machine learning techniques to analyze market data and make informed trading decisions. One of the key indicators it uses is the envelopes indicator, which plots a pair of parallel lines, usually representing a standard deviation away from a moving average. This indicator helps the robot to identify potential trend reversals or breakouts by highlighting areas of support and resistance. By continuously monitorin

One thousand Pip Set1:TP/SL 20kpip. Set2:TP/SL 10kpip. Set3: TP/SL 5k pip. Set4: TP/SL 2k pip. Set5: TP/SL 500 pip. Rate Prop FTMO Broker.
Only Pair DE40, US100, US30. Automatic added EU London Session. This Version works with fixed Lot and buy/sell. Robot Strategy: Trade open = First "Round Price-Number Entry". Write me a Message of Questions when undecided. I send ex4 Code by Request.

If you like my EA Free Version, you should like this also with advance feature upgraded :D This Basic strategy is same with free version. Here is some advance setting Disable/Enable, closed order time Risk Management Option, Fix Lot Money, you can chose amount of money that risk. It's very usefull for PropFirm that we need to control Risk Management Balance, Auto Lot based on your Balance Entry FVG, set where FVG you want to entry. 1 - Most Last Gap, 0.5 - Middle of FVG , 0 - Last Candle High/
Daily Performance Tracker (MetaTrader indicator) calculates the currency rate change relative to the previous day's close and displays it as a percentage in the main chart window. It also offers the option to show weekly and monthly percentage changes. You can customize colors to differentiate between positive and negative price movements. Additionally, a small, customizable arrow visually indicates the price direction. If your broker operates in a non-standard time zone, the Time Shift paramete

Attention! Contact me immediately after purchase to receive setup instructions! The Energy of Daria MT5 Expert Advisor is a reliable assistant for Forex traders. It uses key market patterns, such as price reversals after sharp movements in any direction. This is a fully automated trading system that requires no special skills from you. Simply launch the advisor and enjoy your free time — it will handle all settings and operations for you. The advisor was developed using the Tickmill MT5 quotes

Introducing Crossover Killer Trading Bot – Precision, Reliability, and Consistent Performance
Our Advanced Trend-Following Trading Bot is designed to leverage the power of proven technical indicators while employing sound risk management principles to help traders optimize their strategies.
Key Features:
- Moving Average Crossover Strategy : The bot identifies trend changes through the use of a dual moving average crossover system, generating precise buy and sell signals based on market mome

Flex One is able to open and manage orders based on any indicator. Flex One is ideal for you to automate trades with the signals of an indicator you have or even validate the signals received by an indicator are really profitable. In addition to Flex One opening a source based on any indicator you have, it also has numerous options to manage your trade, among these options you can count on: Partial • You can perform up to two partials. • Different volumes can be set for each partial, always resp
The Saduk v24 indicator is a highly specialized tool designed to improve trading decisions by delivering precise signals based on market dynamics. It integrates momentum, trend direction, and volume analysis to help traders identify optimal entry and exit points , making it valuable for both trend-following and counter-trend strategies . When used with support and resistance levels , its effectiveness is significantly amplified. These levels represent critical zones where prices often reverse or

Attention all Boom and Crash traders! Elevate your market monitoring with the cutting-edge RSI indicator, Market Watch . - Customize alert settings for periods, volatility thresholds, and price spikes - Receive voice notifications when your targets are hit - Seamless integration with MetaTrader5 for real-time data
The indicator works on all five Boom and Crash Markets!
Default settings: Number of timeframes: Timeframe 1 - True Timeframe 2 - True Timeframe 3 - True Timeframe 4 - True Timeframe

Dies ist ein Indikator für binäre Optionen. Es berechnet Engulfing Candles mit einer Signalbestätigung des gleitenden Durchschnitts. Die grünen Kauf- und roten Verkaufspfeile werden im Diagramm angezeigt.
Es wurde auf einem 3-Minuten- und 5-Minuten-Chart mit mehreren Paaren (EUR/USD, EUR/JPY, USD/JPY usw.) getestet. Es funktioniert auch auf dem OTC-Markt von Pocketoption, z. B. EUR/JPY OTC und EUR/USD OTC.
Für Anfänger, Wenn Sie Martingal verwenden, sind die empfohlenen Einstellungen: Anfangs

First Order Robot Strategy =over OR under Last Minute open Set1: TP 2K / SL1K Set2: TP 1K / SL 1 K Rate Prop FTMO Broker. Or Real Account with 200$. Only Pair DE40, US100, US30. Automatic added London Session. This Version works fixed Lot buy/ sell. Write me privat Message of Questions, when undecided. Ex4 Code by Request. inp1_TimeStart= Robot Worktime Start inp1_TimeEnd = Robot Worktime Ende inp8_TimeStart= Time to Robot Reboot inp8_TimeEnd = Time to Robot Reboot

Megatron scalp is a time range breakout EA with a combination of a scalping trail stop that minimalizes drawdowns. The inputs are fairly simple to use and are easy to understand. You can use the default settings on USDJPY or any currency pairs with tight spreads. Also, ensure your broker allows scalping manipulation prior to use or testing. Warm regards as you try or use my bot

ProItPulse Expert Advisor – MT5 Version Dieser EA basiert auf einer innovativen Grid-Strategie, die sowohl bei Drawdowns als auch im Gewinn Positionen eröffnet, um maximale Profite zu erzielen. Über 5 Jahre Entwicklungszeit flossen in die Optimierung dieser Strategie, um höchste Effizienz und Sicherheit zu gewährleisten. Live Signal Link LIVE SIGNAL: HIER KLICKEN
NUR NOCH 3 VON 10 EXEMPLAREN FÜR 49,99 $! Danach wird der Preis auf 99,99 $ erhöht.
Einfach auf EUR/USD H1 anwenden und loslegen

Looking for EA to automate your trading strategy on the Forex market? TrendRocWaves Robot — your faithful companion in the world of trading! This 100% automated EA offers unique features:
- works exclusively on high timeframes (H1,H2,H3,H4) for confirmed response to market changes. - uses the most popular and liquid currency pairs such as EURUSD,GBPUSD with minimal spreads and fast transaction execution. - applies a scalping method based on a medium-term trend to achieve local goals and reduce

The adviser uses a strategy based on trading in the daily interval of the chart using the M1, M5, M15, M30 timeframe. Advisers calculates the signal using technical indicators and only on the daily time intervals. The EA uses an intelligent algorithm for partial closing of an order in profit, thereby minimizing the lot size and in case of a price reversal, the loss will be small. Each position is strictly protected by stop loss. A multi-currency adviser trades in 26 currency pairs. Use multicurr

The adviser uses a strategy based on trading in the daily interval of the chart using the M1, M5, M15, M30 timeframe before US Figures announced. Advisers calculates the signal using technical indicators and only on the daily time intervals. The EA uses an intelligent algorithm for partial closing of an order in profit, thereby minimizing the lot size and in case of a price reversal, the loss will be small. Each position is strictly protected by stop loss. A multi-currency adviser trades in 26 c

The adviser uses a strategy based on trading in the daily interval of the chart using the M1, M5, M15, M30 timeframe on Monday Open. Advisers calculates the signal using technical indicators and only on the daily time intervals. The EA uses an intelligent algorithm for partial closing of an order in profit, thereby minimizing the lot size and in case of a price reversal, the loss will be small. Each position is strictly protected by stop loss. A multi-currency adviser trades in 26 currency pairs
Order Block Tracker is here to solve one of the biggest challenges traders face: identifying order blocks. Many traders fail to spot these critical zones, often missing out on key market entries. But with Order Block Tracker , you no longer have to worry about that. This advanced indicator automatically highlights these crucial zones for you, giving you the confidence to enter the market at the right time. MT4 Version - https://www.mql5.com/en/market/product/123358/ Key Features of Order

If you are unsure how to use this indicator, please feel free to reach out to me. I will explain it to you and provide reading materials to help you make the most of it.
TD Sequential Scanner: An Overview The TD Sequential scanner is a powerful technical analysis tool designed to identify potential price exhaustion points and trend reversals in financial markets. Developed by Tom DeMark, this method is widely used by traders to gauge market cycles and potential turning points with precision. Ho

This new version includes all MT5 timeframes (M1, M2, M3, M4, M5, M6, M10, M12, M15, M20, M30, H1, H2, H3, H4, H6, H8, H12, D1, W1 & MN1). The TD count for each timeframe is displayed on the top left corner. You don't need to do analysis anymore, as the scanner does all the analysis and updates every 1 second, allowing users to see real-time data for informed decision-making. Alerts are set on by default (can be turned off), which notifies users at the completion of every TD9. If you need a sca

Moving Average EA Plus is a fully automated Expert Advisor that takes the trading of Moving Average to a whole new level. Moving Average EA Plus can either open one buy trade when MA turns up (blue color MA) or one sell trade when MA turns down (red color MA) or can open a new same direction trade on every new candle, as long as the slope direction of the Moving Average remains unchanged. A series of unique settings make this EA extremely versatile. This EA comes with provided set files for

Subscribe to the MA7 Trading channel to receive notifications about new programs, updates and other information. Ask questions in the profile on the MQL5 .
Description of work The MA7 Viola C2 expert advisor is based on the MA7 Viola indicator. When a signal appears, the expert advisor opens a position, sets a stoploss and takeprofit, and after opening the position, accompanies it until it is closed. After receiving a loss, the expert advisor increases the volume. Detailed information about th

The TrendSync Strategy is a comprehensive trend-following tool designed to help traders capture high-probability trades by aligning trends across multiple timeframes. The strategy leverages the Average Directional Movement Index (ADX), Simple Moving Average (SMA), and Fractals indicators to provide precise entry and exit points. The strategy includes robust risk management features, making it suitable for both novice and experienced traders looking for a reliable and systematic approach. This st

Build an HFT Bot with source code. This specialized algorithm in the bot will build an HFT bot for you, to alter, enhance and optimize to trade by. The algorithm in the bot is a special recipe to build an HFT program. One that you can enhance upon creation. Just follow the steps:
Load the bot on a chart Wait for it to load, could takes some time depending on computer, refresh chart if needed (USE DEMO SO IT WON'T MAKE REAL TRADES WHILE YOU BUILD). THIS IS BEING USED AS A BUILDER NOT AN EA A
The Gold Key Level Volatility MT5 Indicator is a robust tool designed to help traders track volatility and key price levels across various assets, including gold and popular volatility indices. This indicator excels at measuring market volatility and identifying critical price levels, such as support and resistance, providing traders with valuable insights for making informed trading decisions. It is particularly suited for assets like gold and synthetic volatility indices, such as Volatility 75

Disruptive Edge EA is an innovative Expert Advisor developed from the concept of disruptive technology. It incorporates technical analysis strategy based on the various price movements, patterns, trends, retrenchments and reversals which are carefully coded into the system. It use s a flexible and dynamic execution trading algorithm which depends on price action/ movement to execute very high precision trades. All trades are protected with a hard stop loss. Very good risk management is an integr

Attention! Contact us immediately after purchase to receive setup instructions! Princess of Milana MT5 Advisor is your reliable partner in the Forex market. It utilizes key market patterns, such as price reversals after sharp movements in any direction. This is a fully automated trading system that requires no special skills from you. Simply launch the advisor and enjoy your free time — the setup is already done! Your EA will handle everything for you. Trading Pair: AUDCAD
ACCOUNT REQUIREMENTS

Patient Rocket utilizes bollinger bands and alligator to guide the EA to make trades based on the parameters set . its a slow moving train. Dont over risk and you will earn a good fortune. Great EA for people who need a constant smaller profits while minimizing risk. It trades trend and you will love it. Do try it before buying....
Also; Please Note
Futures and forex trading contains substantial risk and is not for every investor. An investor could potentially lose all or more than the initi

This is the best indicator we have created by far, this indicator replicates the well known heiken ashi indicator, but with a more precise entry point, this indicator can work on all time-frames and is strong on all the time frames , this indicator does not repaint nor does it lag , this indicator strategy combined with price action will change your trading experience , elevate your experience to the next level.

This is best binary signal indicator for 1 minute expiry on 1 minute chart window. Buy and Sell arrows appear on previous candle. This is best momentum candle strategy in all markets. Important = Use martingale (if you are not aware of martingale system then first search martingale and learn it ) all forex ___indexs___companies___all timeframes best for binary trading style Thank you...............

Dieser MACD (Moving Average Convergence Divergence) Indikator hat folgende Eigenschaften: Separates Fenster: Wird unter dem Hauptchart angezeigt. MACD-Linie: Blaue Linie, die den Unterschied zwischen schnellem und langsamem EMA zeigt. Signallinie: Rote Linie, die den SMA der MACD-Linie zeigt. Histogramm: Graues Histogramm, das den Unterschied zwischen MACD- und Signallinie zeigt. Kauf-/Verkaufssignale: Grüne (Kauf) und rote (Verkauf) Pfeile an Schnittpunkten. Nulllinie: Graue gepunktete Linie,
Looking for EA to automate your trading strategy on the Forex market? TrendRocWaves Oscillator — your faithful companion in the world of trading! This manual trading system offers unique features:
- works exclusively on high timeframes (H1,H2,H3,H4) for confirmed response to market changes. - uses the most popular and liquid currency pairs such as EURUSD,GBPUSD with minimal spreads and fast transaction execution. - applies a scalping method based on a medium-term trend to achieve local goals a
MetaTrader Market bietet jedem Entwickler eine einfache und bequeme Plattform für den Verkauf von Programmen.
Wir unterstützen Sie bei der Veröffentlichung des Produkts und beraten Sie gerne, wie man eine Beschreibung für den Market vorbereitet. Alle Produkte, die im Market verkauft werden, sind durch eine zusätzliche Verschlüsselung geschützt und können nur auf dem Rechner des Kunden gestartet werden. Illegales Kopieren ist ausgeschlossen.
Sie verpassen Handelsmöglichkeiten:
- Freie Handelsapplikationen
- Über 8.000 Signale zum Kopieren
- Wirtschaftsnachrichten für die Lage an den Finanzmärkte
Registrierung
Einloggen
Wenn Sie kein Benutzerkonto haben, registrieren Sie sich
Erlauben Sie die Verwendung von Cookies, um sich auf der Website MQL5.com anzumelden.
Bitte aktivieren Sie die notwendige Einstellung in Ihrem Browser, da Sie sich sonst nicht einloggen können.