Handelsroboter und Indikatoren für den MetaTrader 5 - 139

Only gold and bitcoin can be profitable. Trade time is 30 minutes and trend time is 1 hour.
You should check the efficiency of this robot at the end of three months.
Strong trends make very good profits.
There are many inputs for your personalization, but the best settings are defined by default.
This indicator will have many updates and special settings will be added to it.
You can contact us via Instagram, Telegram, WhatsApp, email or here. We are ready to answer you.

Do you want an EA with small stoploss? Do you want an EA that is just in and out of market?
Gold looks at several MT5 It is ONLY buying when the market opens and with a window of 10 minutes or less.
It uses pre-market price so be sure your broker has that.
This strategies (yes, it is 2 different strategies that can be used with 3 different charts) have tight stoplosses and a takeprofit that often will be reached within seconds!
The strategies are well proven. I have used them manually for

[75% OFF - SALE ENDS SOON] - RevCan Trend Entry Point is a trend based trade alert indicator for serious traders. It does all the price and chart analysis all by itself, and whenever it finds any potential high quality trading opportunity(Buy or Sell) using its revolutionized price prediction algorithms, it sends instant trade alert directly on the chart, MT4 terminal and on the mobile device. The trade signals will be visible on the chart as Up and Down arrows, while the instant audible ale

Robo =Crisis= is a completely new unique approach to trading in the "swamp" of trading. Trading in automatic and semi-automatic mode. The robot works according to the current market situation, no stories, redraws, grids and other things. One of the main advantages of the robot is the love of strong volatility. He's not afraid of the news. Absolutely any volatility in the market is our friend. Features of trading: - The adviser includes ( Robo =Crisis= and the Flat indicator, which will be added

Basato sull'indicatore RSI aiuta a capire quando il trend sta cambiando in base ai periodi impostati. E' possibile impostare intervalli di tempo personalizzati e colori delle frecce. Segui l'andamento e valuta anche in base alla volatilità dell'asset. Funziona con ogni coppia di valuta ed è da considerare come un'aiuto ad una valutazione. Puoi associarlo con altri indicatori.

Multifunctional universal trading system . Suitable for all Forex and Crypto markets.
.set files are updated weekly, published on our site.
----
Frank.ex5 [FOR OPTIMIZATION], fast engine for optimization of TS_DayTrader Trading System.
Designed specifically for high-speed optimization in MT5 Tester.
For graphical interface, see Frankenstein.ex5 .
Both Frankenstein.ex5 and Frank.ex5 have automatic trading capabilities.
Parameters(.set files) for Frank.ex5 and Frankenstein.ex5 are interchang

Only 5 copies of the EA at $333! Next price --> $1111 The robot only works on the Nasdaq for 30 minutes or less
Please contact me for optimal settings.
The robot only trades two times a day in American Time. Very low risk. Limits specified. Opens only one position. Martingale does not. Absolutely scalp.
You can contact us via Instagram, Telegram, WhatsApp, email or here. We are ready to answer you.

Quantitative analysis software, this indicator came from another country and thanks to my network today I can share this software with you!
Russian Tool plots arrows on your asset, indicating the trend the asset will enter, easy to use and easy to install indicator
We have been working with robots and indicators since 2018! We came to MQL5 to be able to bring better benefits at the time of payment by our customers!,
our Instagram where we post daily stories of operations: https://www.instagr
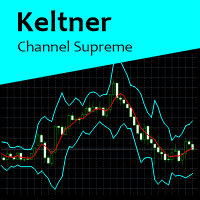
Keltner Channel Supreme is a indicator based on Keltner Channels, with some configuration besides period and Keltner multiplier factor. In this indicator, it is possible to change to an exponential moving average and if prices will be calculated according to close price or typical price. This indicator works on all graphics. If you have some doubt, please PM.
Expert Advisor Stop and Reverse Cut Switch Hedge based on Parabolic SAR indicator. There are two setting in EA: 1. Cut Switch 2. Hedging
Recommended settings: TimeFrame = H4 Risk = 0.1 Minimum Balance = 1.000 MaxToBep = 4
Main Parameter Description: - Hedging Mode False = Cut Switch True = Hedging - Max Martingale Level = Lot / Volume will reset after "n" Losses - Risk = Based % of Balance -MaxOP to BEP = Target BEP will be active if there is a certain number op open position - Percent BEP =
Скальпирующий алгоритм полностью автоматической торговли на FORTS для фьючерсов Сбербанка и Газпрома Московской биржи. Рабочий таймфрейм 5 минут. Алгоритм анализирует:
1) Импульсное изменение цены в моменте и на истории сопряженных активов. 2) Глубину рынка на наличие повышенных объемов в стакане. 3) Роботизированные и айсберг заявки в стакане. 4) Потенциальные ценовые и фрактальные уровни. 5) Историю на хорошо отработавшие паттерны прайс экшен. В случае когда алгоритму удалось выбрать подходящ
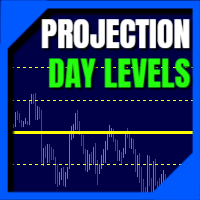
Daily Projection Levels , as the name implies, is an indicator that project the price changes in percentage above and below the opening of the day (or closing of the previous day.
These are "psychological" support and resistance areas where price tries to retrace or break out.
With this you have a powerful tool to predict what these zones will be! You can define which projection levels you want (up to 5 above and below), in addition to have alert messages and visual customization. If you want to
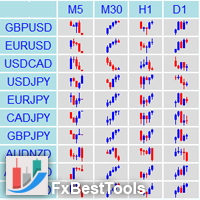
Definition : Market View is a dashboard (scanner) to view price graphs of all symbols and all timeframes at a glance. The utility is designed user friendly and added a wide range of customization options.
Main features of Market View : Visual settings window on the chart Customizable list of symbols and timeframes Different shapes : Real Candles, Schematic Candles, Arrows Customizable number of candles Changeable size of dashboard (scanner)
Highlight timeframes with gaps on candles Open approp
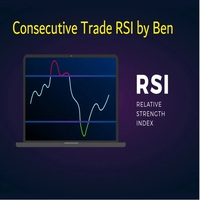
This EA takes trades based on a configured RSI level. At each candle close, it will resume a position if the one closes above the previous one.... The SL and TP are positioned and it is the sum of all the trades initiated that will close the positions: Either in % of capital, or in pips. IMPORTANT :
it is the magic number that allows the EA to properly close positions. so be sure to put different magic numbers on each graph. Important : have a good money management with this type of EA (little

User Grid MT5 is a multifunctional grid Expert Advisor designed to fully or partially automate various ideas related to grid trading (on a hedging account) . The Expert Advisor can trade on any timeframe, on any currency pair, on several currency pairs, on any number of signs. It does not interfere with manual trading, trading of other Expert Advisors, or the operation of any indicators. It allows you to adjust your settings on the fly, works only with your own positions and orders. It has a
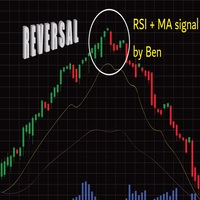
Important : have a good money management with this tpe of EA (little lot size....and avoid margin call)
The EA takes a trade when 2 conditions are met: The achievement of an RSI level, and the break of a moving average of your choice.
When the trade is initiated: the SL is positioned (in pips) the TP1 can be: the kijun, or another moving average, you can configure a value approaching the TP1 (which avoids the price shift of brokers) the partial close is done the SL after TP1 can be configured

Supported currency pairs: EURUSD,USDCAD, GBPUSD, EURGBP Recommended timeframe: M15
The EA should run on a VPS continuously Setting Fixed Lot - fixed frist trading lot StopLoss, in pips - stop loss value TakeProfit, in pips - t ake profit value CCI: averaging period, Averaging period for calculation
CCI: type of price, Use martingale, martingale Mode Martingale coefficient, martingale multiplier Order Maximum number of multiplications
Dieser Indikator zeigt optimale Take-Profit- und Stop-Loss-Niveaus an. Diese Niveaus werden auf der Grundlage historischer Daten berechnet. Beim ersten Start wird der Indikator auf die Historie trainiert. Danach bewertet er die Wahrscheinlichkeit, dass der Preis dieses oder jenes Niveau in Zukunft überwinden wird, und wählt die optimalsten Optionen für die Platzierung von Stop-Orders aus. Beispielsweise werden Take-Profit-Werte so gewählt, dass der Gewinn maximal ist und die Wahrscheinlichkeit,

Donchian Channel DC is the indicator of Donchian Channels, that plots maximum and minimum values of a specific period, besides mean value line. It´s possible to configure simple period for analysis and the indicator will plot all three values. You can trade with this indicator as trend or reversal, according to each strategy. Do not let to test others indicators as soon as others expert advisors.

Ein vernünftiger Ansatz zur Preisbeobachtung Kaufen Sie, wenn die Preise steigen und verkaufen Sie, wenn die Preise fallen Die obige Aussage über den Kauf bei steigenden Preisen oder den Verkauf bei fallenden Preisen ist möglicherweise zu weit gefasst und erfordert möglicherweise einige Richtlinien und Regeln. Hier kommt The 3 Duck’s ins Spiel.
Der Indikator Price Average Mt5 hilft Ihnen, Kaufgelegenheiten in Richtung des letzten Aufwärtstrends und Verkaufsgelegenheiten in Richtung des letzten
Die hypergeometrische Reihe wird verwendet, um die Gewichtungskoeffizienten dieses Filters zu berechnen. Dieser Ansatz ermöglicht eine recht interessante Glättung der Zeitreihen. Die hypergeometrischen Filtergewichte fallen nicht so schnell ab wie exponentiell und linear gewichtete gleitende Durchschnitte, aber schneller als geglättete gleitende Durchschnitte. Aus diesem Grund ähnelt das Verhalten dieses Filters in vielerlei Hinsicht dem Verhalten von gleitenden Durchschnitten. Es hat jedoch me
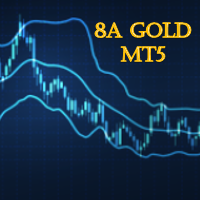
Der 8A Gold Expert Advisor ist ein von 8aSistemas entwickeltes System, das eine Reihe von Variablen wie die Volatilität und die Stärke der Impulse mit den Bollinger-Bändern integriert, um Einstiegspunkte mit hohen Erfüllungsmöglichkeiten zu bestimmen. Es ist ein System, das sowohl die Märkte in Bereichen mit geringer Volatilität als auch in Momenten mit hoher Volatilität, die den Bollinger brechen, bearbeiten kann, all diese Aufgaben können gleichzeitig und zu bestimmten Zeiten erledigt werden.

Investopedia FIVE EA basiert auf diesem Artikel:
https://www.investopedia.com/articles/forex/08/five-minute-momo.asp
HANDELSBEDINGUNGEN
- Achten Sie darauf, dass der Handel mit Währungspaaren unter dem X-Periode EMA und MACD im negativen Bereich liegt. - Warten Sie, bis der Kurs den EMA für den Zeitraum X überschreitet, und vergewissern Sie sich dann, dass der MACD entweder dabei ist, von negativ nach positiv zu wechseln, oder innerhalb von fünf Balken in den positiven Bereich eingetreten
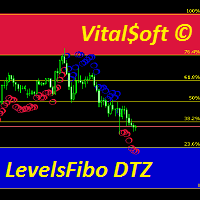
The combined Levels Ib DTZ indicator helps to determine the trend direction when trading. Displaying signals on the chart about a possible upcoming trend change. The indicator is a combination of Fibonacci levels with overbought and oversold zones and a trend indicator based on ZigZag and ATR indicators. The Levels Ib DTZ indicator helps traders predict future price movements and adjust their strategy accordingly. It works on all timeframes.
The Sytem Equivalent is a breakout trading system in data distribution based on deep machine learning, parameterized neural network technology. Data distribution has different types of breakout - different systems study and analyze in terms of neural network parameters, something progress up to date. The system analyzes every profit from the distribution of breakout types so that it is tested on the backtest and it is very successful.The accuracy of profit in the learning system for neural netwo
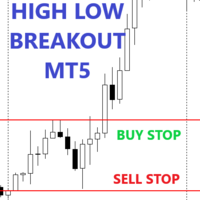
This expert advisor will make a pending order at a certain time, pending orders are made in the form of buying at the highest price and selling at the lowest price (in a predetermined time frame) you can make a pending order breakout at the highest and lowest prices according to your wishes, thus it can be used for the following strategies: - Asian Session BreakOut - European Session BreakOut - US Session Breakout - News Trading - Etc.
Main parameter description Notes : order type 4 is not part

Informações Importantes sobre o Bra50 Index Bot (BACKTEST VISUAL desativado para proteger parte da Estratégia.)
Se você está procurando um robô que cumpre aquilo que promete, você acabou de encontrar! O Brazil Index Bot irá superar todas as suas expectativas com certeza! E o melhor de tudo, é só colocar na sua conta, ligar e já começar a lucrar! Deseja conhecer mais sobre o Bra50 Index Bot e seus resultados? Baixe agora os relatórios detalhados em: https://bit.ly/INFOSBRAZILINDEXBOT (Utilize es

VWAP Volume And Price is the indicator for Volume Weighted Average Price, designed according to regular calculation. The average price is calculated using typical price - (high + low + close) / 3 - and weighted by volume for each candle. So, the indicator can be used to trend trades, balanced with volume. Try other products and expert advisors too. Any doubt, PM.

Supimpa B3 Trader é o robô de negociação automatizada para a bolsa brasileira B3, para os ativos miniíndice WIN e minidólar WDO. A estratégia de negociação é baseada na média VWAP - Volume Weighted Average Price - que utiliza uma média ponderada dos preços em relação ao volume de negociação em cada vela. O robô é de configuração simples, com entrada do valor do período da média de análise e do takeprofit e stoploss fixos. Além disso, pode-se configurar também o número de contratos, configuração
The idea of this trading system from the EMA with a Mediante price from the EMA indicators is based exactly 100% from Ripster47 trading system, me is just the person to create it on the MT5 platform, but with alerts for your own buy/sell settings. Hereby I make a copy from Ripster47 explanation for using that system: " EMA Cloud By Ripster
EMA Cloud System is a Trading System Invented by Ripster where areas are shaded between two desired EMAs. The concept implies the EMA cloud area serv

GBP Scalper 03 is a simple EA that can work automatically to carry out trading activities. Like the previous version (GBP Scalper 01 & GBP Scalper 02 (MT4 platform)), this EA is kept simple and only requires Lot, TP, and SL settings to use.
And because of the absence of the Buy_only and Sell_only options on the MT5 platform, an option is added to manage the activation of Buy Trade or Sell Trade
As the name implies, this EA is only suitable for trading with the GBPUSD pair, and is design

Торговая стратегия. Советник применяет в торговле 4 трендово-сеточные стратегии с различными параметрами. Тем самым обеспечивается распределение рисков по торговым объемам в рынке. Авторская система определения тренда и учет волатильности торгуемой пары позволяют автоматически подстраиваться советнику под настроения рынка. Используется автоматическая фиксация убытка при достижении заданной в настройках просадки. Доступно широкое количество фильтров сигналов, которые позволяют минимизировать л

British stuff The Expert Advisor tool has been developed for GBPJPY 1H based on SMA 200 and pending orders. It has been backtested on more than 18-year long tick data with 99% quality of modeling. The enclosed screenshots demonstrate the complexity. A broker with a small spread and slippage is recommended for better performance. There is no need to set up any parameters, except Magic number and Friday exit time, lot size . All other settings are already optimized and fine-tuned. Strategy worki
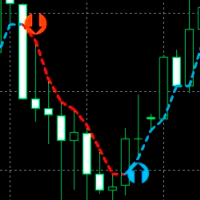
Ein Indikator zur genauen Bestimmung von Preisumkehrpunkten in allen Zeiträumen und allen Währungspaaren. Mit Hilfe der technischen Analyse des Marktes und mathematischer Diagnosemodelle bestimmt dieser Indikator mit großer Effizienz die Kursumkehrpunkte und die aktuelle Trendrichtung. Der Indikator zeigt diese Informationen auf dem Chart in Form von Pfeilen und Linien an. Die Pfeile zeigen die Trendumkehrpunkte und die Linien zeigen die aktuelle Trendrichtung.
Dieser Indikator kann in bestehe

EL BBot Aliens 100 DouKang se basa en cálculos matemáticos en función del precio especialmente tratando de disminuir los riesgos de las subidas y bajadas extremas, utiliza dos entradas opuestas y si el precio sube se fortalece con mas entradas y si baja también se fortalece con mas entradas, (ver video). Se recomienda usar el test para determinar el deposito mínimo para cada par, en el caso del oro con el dolar es de 3mil (ver video). Si aumenta la distancia=1,,, disminuye el riesgo, (distancia
Das Dienstprogramm steuert jeden Parameter eines Indikators, indem es das Mausrad durchläuft. Wenn Sie einen Indikator gekauft oder gemietet haben, können Sie seine Benutzeroberfläche mit diesem Dienstprogramm ändern. Jeder Indikator, der mindestens einen ganzzahligen Parameter enthält, ist dafür geeignet.
Wenn Sie zuerst versuchen möchten, wie es funktioniert, laden Sie den kostenlosen Standart Scroller herunter, um die Indikatoren aus der Standardlieferung des Terminals zu steuern.
Funkti

Second To NoneFX Spike Catcher EA V1.1 Use This spike Catcher everyday or let it run on VPS, make profit and withdraw everyday. Very Cheap and accurate Spike Catcher... AFFORDABLE!!!
2nd To NoneFX Spike Catcher EA V1.1 -----> NEW FEATURE Multiply on loss to cover previous loss. This Robot is Also Developed To milk the BOOM and CRASH indices . It works On all Boom and Crash pairs (boom 300, 500, 1000 & Crash 300, 500, 1000) I would Highly recommend that you use this Robot to Catch spikes

Camaleão Bands B3 Trader é o robô de negociação automatizado para a bolsa Brasileira B3, tanto para trade em miniínidice WIN, quanto para trade em minidólar WDO. O robô usa as Bandas de Bollinger para análise de ordens de entradas, permitindo trades a favor ou contra a tendência, dependendo da volatilidade das bandas, afinal, quando as bandas estão estreitas, é mais provável que o mercado fique lateral, realizando mais trades contra a tendência. Porém, quando o mercado explode, as bandas se alar

Angesichts der Differenz der Handelssitzungen zeigt der Indikator die Trendrichtung und das Widerstandsniveau an. Alle Ereignisse werden auf dem Diagramm markiert und Warnungen werden gesendet. Mit SessionAlert können Sie ruhig, gemessen handeln. Sie müssen nur die Start- und Endzeit der Sitzungen angeben. Der Indikator zeigt das Widerstandsniveau an, zeigt mit einem Pfeil ein Trendwechselereignis an und markiert zusätzlich die Berührung des Widerstandsniveaus durch den Preis. Das Funktionsprinz
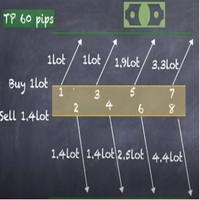
Strategy description can be seen in the attached video( https://www.youtube.com/watch?v=JzN1fEZmc40 ).
This hedging strategy strictly follows what is presented in the video.
The strategy works on any pair of forex, crypto, indices and other derivatives.
Through the settings, you can customize the size of lots, add pairs for operation, and profit and loss points.
The distance between sell and buy orders must be configured according to the number of decimal places of the pairs that will be tra

PULLBACK HUNTER What is every trader's cherished dream? To see without delay the places where the reversal will happen. This, of course, is from the category of magic, though... nothing is impossible. But for now I've prepared for you an indicator that marks in real time the end of corrections to the current movement or in short - catches pullbacks.What is the main point? Many people practice rebounds when the price moves in the direction of the open position. And they do them on the formation o

Before installing the HeatMap indicator make sure you are using a broker that gives you access to the Depth of market (DOM) !!
This indicator creates a heatmap on your chart allowing you to see the buy or sell limit orders easily and in real time. You have the possibility to change the setting and the colors of the HeatMap in order to adapt to all markets and all charts. Here is an example of a setting you can use with the NASDAQ100 on the AMPGlobal broker : https://www.youtube.com/watch?v=x0Y

Gold Plus is a fully automated Expert Advisor designed for XAUUSD trading. It is based on cluster analysis of machine learning and genetic algorithms. The Expert Advisor contains a self-adaptive market algorithm that uses price action patterns and standard trading indicators. The entry and exit logic works only when a bar closes. It filters market noise, greatly speeds up optimization, avoids stop-loss hunting and ensures correct operation at any broker with a reasonable spread. The Expert Adv

Informações Importantes sobre o CryptoHacker (Não repinta! Não gera sinais atrasados!)
Se você está procurando um indicador que cumpre aquilo que promete, você acabou de encontrar! O CryptoHacker irá superar todas as suas expectativas com certeza! E o melhor de tudo, é só colocar na sua conta, ligar e já começar a lucrar!
O CryptoHacker é um sistema profissional de trade criado para as plataformas MT4 & MT5 e otimizado para trabalhar com CryptoMoedas.
Nosso sistema utiliza uma poderosa lógic

DYJ ChameleonTrend arbeitet auf Basis von Trend Following und Counter Trend System. DYJ ChameleonTrend ist ein Indikator mit hoher Wahrscheinlichkeit. Dieser Indikator verwendet einen einzigartigen Mix-Indikator, der anspruchsvolle Indikator mit Benutzerdiskretion kombiniert. Dieser Indikator ist einer der fortschrittlichsten Ma Cross Adn ATR und Varianz Algorithmen. Der Indikator zeigt zwei farbige Richtungspfeile und Trend-Scrollbälle an, die die besten Entry- und Exit-Positionen für Trader a

Всем привет. Представляю Вашему вниманию Индикатор TRUE ATR. Так же есть данный индикатор для mt4 https://www.mql5.com/ru/market/product/82414 Данный индикатор работает на всех рынках. TRUE ATR высчитывает среднестатистическое движение инструмента за 1 день и показывает сколько в инструменте осталось энергии внутри дня. В отличие от классического индикатора АТР которые без разбора учитывает все бары(свечи), TRUE ATR при расчете среднестатистического движения инструмента использует ближайших 5

The price is 450$ for next 10 buyers (Remaining copy :10) Next price: 600$ KAPITAL SECURE EA : I s a fully automated "arbitrage" trading system, which is especially effective in trading popular currency pairs, it uses 11 pairs at the same time: EURCHF, GBPNZD, AUDNZD, NZDUSD, NZDJPY, GBPAUD, EURCAD, EURUSD, EURJPY. In order to pass the MQL4 tests, we have modified the settings, you just need to download our profitable settings that we use on LIVE accounts. LIVE Signals: Capital #1 50K € Cap

The Market Entropy indicator was created to measure the order of price changes over time. consists of two lines and a histogram where the lines are responsible for measuring the price movement and the histogram measures the strength of the analyzed movement. It can be used to find a trend (Image 2) or price reversal (Image 3).
Blue Line: Buy Entropy Red Line: Sell Entropy Historgram: Market Entropy
Interpretation: Buy Line above the Sell Line indicates that in the analyzed period buyers were

FIRST 10 FREE Zeus is a system developed by 8A Sistemas, it is very simple but its strength lies precisely in its simplicity, Zeus works on the statistics of the price of the previous day, such as its minimum price, maximum price, greatest retracement, pivot points among other statistical data that is not We reveal it to guarantee our intellectual property, but it is only statistical data that is not necessary for the operator to know for its correct operation.
Strategy: Zeus looks for impul

Nehmen Sie am Handel mit dem WolfeWaveBuilder-Indikator teil! Dies ist ein einzigartiges Tool, das speziell dafür entwickelt wurde, die erfolgreichsten und profitabelsten Investitionsentscheidungen zu treffen. Es ist ideal für Live-Konten und profitiert von einer gründlich getesteten und praktisch garantierten Handelsstrategie. Verpassen Sie nicht Ihre Gelegenheit! Fangen Sie an, mit dem WolfeWaveBuilder-Indikator Geld zu verdienen!
MT5-Version https://www.mql5.com/ru/market/product/8920
Indik

HiLo B3 Trader é o robô de negociação automatizada para a bolsa brasileira B3, para ativos miniíndice WIN, minidólar WDO e também ativos como milho (CCM). O robô opera calculando o indicador HiLo e emitindo ordens de acordo com a tendência. Além da configuração do período do HiLo, pode-se configurar filtros de tendência, bem como ajustar o takeprofit e stoploss para fixos ou dinâmicos com o indicador ATR. Ativos recomendados: WIN, WDO, CCM. Timeframes: M10. Atenção: alterar o parâmetro BR1 para
As you know, the logarithmic chart is essential for any Technical approach. This Expert Advisor create a customize symbol for any symbol you want and it plot logarithmic chart for that. You can easily switch between logarithmic and arithmetic charts. the Expert provide crosshair for last and actual price and you can add your personal LOGO to chart. also you can set individual zoom for each Time Frame. Important: The Expert Advisor doesn't work on Demo version. because Demo version work only on S

„Ehrlichkeit kann uns praktisch jeder verzeihen: und, sagen wir, ein unzureichend professionelles Spiel und sogar eine unzureichend professionelle Poesie. Dafür gibt es viele Beispiele. Aber wenn die Ehrlichkeit verschwindet, wird nichts vergeben.“
Golden Rings - Der Forex-Finanzroboter bietet Optionen, um profitable Trades auch in instabilen Märkten zu finden, wenn die aktuelle Trendrichtung unklar ist. Es wird dem besten Trend folgen, um Gewinne zu maximieren und die Wahrscheinlichkeit mögli

Informações Importantes sobre o ArrowHacker (Não repinta! Não gera sinais atrasados!)
Se você está procurando um indicador que cumpre aquilo que promete, você acabou de encontrar! O ArrowHacker irá superar todas as suas expectativas com certeza! E o melhor de tudo, é só colocar na sua conta, ligar e já começar a lucrar!
O ArrowHacker é um sistema profissional de trade criado para as plataformas MT4 & MT5 e otimizado para trabalhar com qualquer ativo na plataforma MetaTrader 5, sejam moedas, m

ImbaTrend Runner - is the trend following manual system for forex/crypto market. It defines medium-term trends and works with it in intraday mode. System shows enter points, profit and loss targets. As a rule profit targets are 2-3 X bigger than loss targets. Indicator is AutoAdaptive and it automatically updates it's settings during trading. Indicator is sensitive to market changes, regular updates helps to stay in relevant trend. Main Indicator's Features Signals are not repaint, late or disap

McDuckEA MT5 – works on the martingale strategy. It shows good results when trading on Gold, XAUUSD. Martingale orders are opened with a step from each other and only after the opening of a new bar of the set timeframe. During the release of important news, the adviser suspends the opening of new orders. The EA has an internal risk control system and, if the risk is exceeded, it starts to exit the market, closing extreme positions in pairs. The level of loading of the deposit determines the risk

EA介绍 :Stable Grid是一款中长期全自动化的交易顾问,放弃大起大落 只追求大概率稳定的细水长流。 资金门槛 :使用该EA的资金门槛稍微比较高,具体内容看配置介绍。 类型 :中长线EA策略
优点 :较为稳定、全自动
缺点 : 1.面对超大单边行情略显恐惧,若不是超大单边那也不屑一顾。 2.获利周期较长,对于短线交易者的心理造成焦虑感!
止损:每张订单都不设置止损,然而止损按照策略来执行。 止盈:按照固定点数来执行。
风险管理 :任何策略都不是最重要的,风险管理才是最重要的!本EA使用了复利模型,严格控制了仓位比例。
配置介绍 :必须严格按照推荐的配置来执行。 周期推荐:30分钟 货币推荐:美瑞
杠杆推荐:1:100-200 最低余额:$10000
要求 : 1.EA需要良好的经纪条件,平台最好是低点差低滑点,网络最好保持稳定。 注意 : 2.当使用EA 专家建立头寸之后,使用的连续性也是需要严格遵守,除了非交易日之外都应当挂上EA。举例:假设一年有365天,然而外汇市场一年的交易日仅为240天,在这240天内都应该连续使用EA!
EA测试 :(该EA属于中长

Dieser Indikator verwendet lokale Hochs und Tiefs der Preisreihe. Nach dem Hervorheben der Extrema werden ihre Werte geglättet. Dadurch werden zwei Kanäle aufgebaut - extern und intern. Der interne Kanal zeigt die Grenzen, wenn die Preisbewegung strikt einem linearen Trend folgt. Der äußere Kanal zeigt die Grenzen für die Preisbewegung mit einem logarithmischen Trend. Nach der Berechnung der Kanäle analysiert der Indikator die tatsächliche Preisbewegung und bietet Empfehlungen zum Öffnen und Sc

Divergence and Convergence are important harbingers of reversals in stock markets.
The Divergence Sync indicator is designed to automatically search for divergences on a large number of indicators with different parameters.
The search for divergences is carried out on these indicators: (CCI, CHO, DeMarker, MACD, MFI, Momentum, OBV, OsMA, RSI, Stochastic, WPR, Awesome Oscillator ).
To search for divergences, you can use one technical indicator or search simultaneously on any number of indicat

At first, I got my teeth into Phoenix Ultra Expert Advisor.
This Expert Advisor will support automatic close order if the direction is correct and perform recovery if the direction is wrong. If you enter an order: 1. The price goes in the right direction and hits the Min Profit Point , trailing stop 20% of the current profit. 2. The price goes in the opposite direction, the Expert Advisor will place the order with the volume is Recovery Volume Percent at the input, the distance to

The ATRStopLoss Expert Advisor determines where best to put a stop relative to the current price.
How it works ATRStopLoss gets the size of ATR for the selected period ATRStopLoss draws Stop-Loss levels from the current price with the size of the ATR. As the price and the timeframe change, ATRStopLoss also adjusts the Stop-Loss levels. Settings MA_Period - period of the ATR MA_Timeframe - ATR timeframe

The LevelsDetector Expert Advisor identifies the strongest levels on the chart.
How it works LevelsDetector collects data on all the prices of Japanese candlesticks for the selected period LevelsDetector considers the top levels, which often touched the price. As the price and the timeframe change, the LevelsDetector also corrects the levels. Settings candlesCount - Number of candles for the analysis maxLevelsCount - Number of levels to display magic_number - Unique number of the Expert Adviso

FINAL BLUE EA THE DESCRIPTION : Finale bleue is a trading robot that allows the automation of analysis and trading processes. It opens and closes orders based on certain criteria and calculations it has been programmed to perform. EXPLANATIONS: He opens and closes orders much faster and more efficiently than a human ever could, and he does it 24/7 without emotion. Which makes it an ideal trading tool. It only exits the market in blue and in the end it always emerges as a winner on all

SLTPSetter - StopLoss Take Profit Setter HOW DOES IT WORK? Risk and account management is a very critical aspect of trading. Before entering a position, you must be fully aware how much you will be willing to loss both in percentage and value. This is where SLTPSetter gets you covered.
All you need to do is attach the indicator on the chart and PRESS BUY OR SELL automatically, all parameters needed for placing the trades will be provided at the top left corner of the screen. Feel free to adjust

Market Conditions indicators can provide support to the trader so that he can identify market trends over a given period. The purpose of this model is to allow traders to have a global vision on the exchange markets. And the formula that we develop allow to scan the major currencies in the exchange market. The model uses a purely statistical formula which is based on the historical data of the major currencies "eur, usd, gbp, jpy, aud, nzd, cad, chd". Of which 28 currency pairs are traded. It

ROC Price Histogram Alert ist ein Momentum-basierter technischer Indikator, der die prozentuale Preisänderung zwischen dem aktuellen Preis und dem Preis vor einer bestimmten Anzahl von Perioden misst. ROC wird mit einem Histogramm gegen Null aufgetragen, wobei sich der Indikator nach oben in den positiven Bereich bewegt, wenn Preisänderungen nach oben gehen, und sich in den negativen Bereich bewegt, wenn Preisänderungen nach unten gehen.
Der Hauptschritt bei der Berechnung des ROC-Zeitraums is
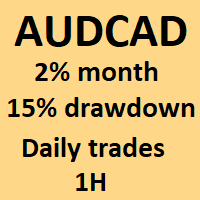
My name is Moose and I trade the AUDCAD 1H I am very profitable and have been trading for more than 3 years live. I have a very successful track record. I am a bit risky, but I do like to receive my reward at the end of the day. I am only 3 years old, but my boss has been trading for 17 years - he designed me and my rewards. I give a return of 1 to 2% a month ( to be used with my other ea's) for higher profit return (3-5%) a month. you can always increase risk. Draw down is under 15%.
Recommend
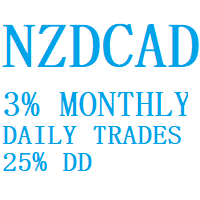
My name is Bea and I trade the NZDCAD 1H I am extremely profitable with low risk. I trade every other day, but when I do, you don't need to worry. I am under control.
I give a return of 1 to 3% a month ( to be used with my other ea's) for higher profit return (3-5%) a month. you can always increase risk. Draw down is under 30%. Using 100% tick data and forward testing: turn $5,000 into $63,812 with 30%dd 90% of trades close within 60 hours Turn $10,000 into $149,237 with 30%dd This all done wit
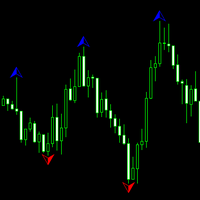
An indicator for all timeframes with a configurable number of bars for calculating fractals. Suitable for determining extremes of both lower and higher order, by which it is possible to determine the patterns of technical analysis, as well as divergences.
The indicator has one adjustable parameter - the number of bars for extremum calculation. It is also possible to change the color characteristics.

MACD strategies EA is a EA that can support multiple MACD strategies. Purchasing this EA can save you the time taken to automate your existing MACD strategy through coding a custom EA and it also helps you discover profitable MACD strategies as its fully compatible with the strategy tester and all settings are editable. The EA supports both scalping, short term and long term strategies. The various supported settings are explained below: NOTE: The default settings in the EA are s
MetaTrader Market - Handelsroboter und technische Indikatoren stehen Ihnen direkt im Kundenterminal zur Verfügung.
Das MQL5.community Zahlungssystem wurde für die Services der MetaTrader Plattform entwickelt und steht allen registrierten Nutzern der MQL5.com Webseite zur Verfügung. Man kann Geldmittel durch WebMoney, PayPal und Bankkarten einzahlen und sich auszahlen lassen.
Sie verpassen Handelsmöglichkeiten:
- Freie Handelsapplikationen
- Über 8.000 Signale zum Kopieren
- Wirtschaftsnachrichten für die Lage an den Finanzmärkte
Registrierung
Einloggen
Wenn Sie kein Benutzerkonto haben, registrieren Sie sich
Erlauben Sie die Verwendung von Cookies, um sich auf der Website MQL5.com anzumelden.
Bitte aktivieren Sie die notwendige Einstellung in Ihrem Browser, da Sie sich sonst nicht einloggen können.