Kostenpflichtige technische Indikatoren für den MetaTrader 5 - 3

Dies ist ein sehr einfacher und dennoch wirksamer Indikator für den Handel mit Ausbrüchen variabler Fraktalperioden. Ein Fraktal ist eine Preisbildung aus einer ungeraden Anzahl von Balken, wobei der mittlere Balken der höchste oder niedrigste Preispunkt der Formation ist. Diese Preise dienen als kurzfristige Unterstützungs- und Widerstandsniveaus, die dieser Indikator verwendet, um einen Preiskanal zu zeichnen und Ausbrüche anzuzeigen. [ Installationsanleitung | Update-Anleitung | Fehlerbehebu
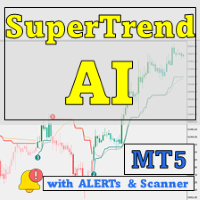
Nur 4 Exemplare verfügbar für $49 – Sichern Sie sich Ihres, bevor der Preis auf $149 steigt! Entdecken Sie die Kraft der KI mit dem SuperTrend AI Clustering MT5 mit Scanner , einem revolutionären Handelstool für MetaTrader 5 (MT5). Dieser Indikator definiert die Marktanalyse neu, indem er K-Means-Clusterbildung mit dem weit verbreiteten SuperTrend-Indikator kombiniert und Händlern einen Vorteil bei der Navigation von Trends und Signalen verschafft. See more MT4 version at: SuperTrend AI Clust

Marley-Indikator: Präzises Trading in MT5 Verbessern Sie Ihr Trading mit dem Marley-Indikator, der für außergewöhnliche Signalgenauigkeit in MT4 und MT5 konzipiert wurde. Dieses vielseitige Werkzeug ist für die Krypto- und Forex-Märkte optimiert und bietet Präzision und Flexibilität in Ihrer Handelsstrategie. Nahtlose Integration mit MT4: Für Nutzer der MT4-Plattform ist der Marley-Indikator vollständig kompatibel und hier zugänglich. Für Krypto- und Forex-Märkte optimiert: Krypto-Exzellen

This indicator is converted from UT Bot alerts indicator by @QuantNomad of Trading View to MT5. its considering ATR and creating new candles on chart and also is giving good entry points based on its candles. all buffers of new candles and also entry signals are included as buffer so can be used easily on any EA. there are also some different strategies on the internet that can be used or contact me to create it for you.

The indicator automatically identifies the 1-2-3 pattern on the chart. The indicator is able to monitor the formation of pattern in real time. It informs the trader when the pattern is completely formed (when the price breaks the line in point 2) and displays the completed patterns in history. The patterns are never redrawn. The indicator can identify patterns on any instruments (currency pairs, stock market, gold, etc.) without the need to adjust to each instrument. Simple and clear visualizati

The indicator displays volume clusters or volume profiles to choose from. For trading symbols which contain the tape of deals, the indicator can perform calculations based on the tape of deals.
Input variables
StepPoint - cluster step in points, if the value is zero, the step is assigned automatically. HistoryTicks - size of tick history (for VolumeType in the mode TimeAndSales). AssociatedTimeframe - binding the indicator to the specified timeframe of the chart, if the value is equal to

Der Boom and Crash Spike Detector Indikator ist basierend auf einer fortschrittlichen Strategie kodiert, hauptsächlich um den Boom und Crash in den Preisen zu erkennen. Komplexe Algorithmen wurden implantiert, um Booms und Crashs mit hoher Wahrscheinlichkeit in den Preisen zu erkennen. Es warnt vor möglichen Boom- oder Crash-Phasen:
Boom-Phase: Wenn der Preis zu schnell steigt. Crash-Phase: Wenn der Preis zu schnell sinkt.
ZEITLICH BEGRENZTES ANGEBOT: Der Indikator ist für nur 30 $ und leben

Sind Sie es leid, profitable Markttrends zu verpassen? Wünschen Sie sich ein zuverlässiges Tool, das Trendfortsetzungen präzise und genau erkennen kann?
Suchen Sie nicht weiter! Unser Trendfortsetzungsindikator soll Ihre Handelsstrategie stärken und Ihnen helfen, immer einen Schritt voraus zu sein.
Der Trendfortsetzungsindikator ist ein leistungsstarkes Tool, das speziell entwickelt wurde, um Händlern bei der Identifizierung und Bestätigung von Trendfortsetzungsmustern auf verschiedenen Fi

Beschreibung:
Der Indikator „Marktstruktur HH HL LH LL“ ist ein leistungsstarkes und zugleich einfaches Instrument zur Analyse der Preisdynamik auf den Finanzmärkten. Dieser Indikator hilft Händlern und Investoren, Trendänderungen zu erkennen und wichtige Punkte in Preiszeitreihen zu identifizieren.
Hauptbestandteile des Indikators:
HH (Higher High): Der Höchststand, an dem der Preis über dem vorherigen Höchststand schließt. HH deutet auf einen sich verstärkenden Aufwärtstrend hin. HL (Hi

Wir stellen vor: Trade Sniper: Ihr Vorsprung auf den Märkten.
MT4-Version: https://www.mql5.com/en/market/product/122371
Haben Sie es satt, profitable Trades zu verpassen oder auf der falschen Seite des Marktes zu landen? Lernen Sie Trade Sniper kennen, den hochmodernen Indikator, der die Macht der Trends nutzt, um Ihnen einen messerscharfen Vorteil beim Traden zu verschaffen.
Trend Sniper ist nicht nur ein weiterer 08/15-Indikator. Es ist ein ausgeklügeltes Tool, das fortschrittliche Alg
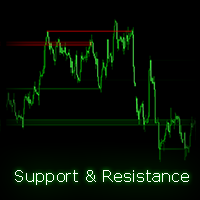
Dieser Indikator findet und plottet automatisch Support- und Widerstandskanäle auf Ihrem Chart, um wichtige Level einfach zu identifizieren. Der Indikator unterstützt mehrere Zeitrahmen, sodass Sie Kanäle aus verschiedenen Zeitrahmen auf Ihrem aktuellen Chart anzeigen können. Darüber hinaus bietet er transparente Farben für verbesserte visuelle Klarheit und ermöglicht es Ihnen, die Farben der Kanäle nach Ihren Wünschen anzupassen. Wie funktioniert dieser Indikator? Der Indikator findet Schwingun

Sekundendiagramm für MetaTrader 5
Mit den Indikatoren können Sie im MetaTrader 5-Terminal Diagramme mit einem Zeitrahmen in Sekunden erstellen. Der Zeitrahmen in einem solchen Diagramm wird in Sekunden festgelegt, nicht in Minuten oder Stunden. Somit können Sie Diagramme mit einem Zeitrahmen von weniger als M1 erstellen. S15 ist beispielsweise ein Zeitrahmen mit einer Periode von 15 Sekunden. Sie können Indikatoren, Expert Advisors und Skripte auf das resultierende Diagramm anwenden.
Sie er

Dark Support Resistance is an Indicator for intraday trading. This Indicator is programmed to identify Support and Resistance Lines , providing a high level of accuracy and reliability.
Key benefits
Easily visible lines Only the most important levels will be displayed Automated adjustment for each timeframe and instrument Easy to use even for beginners Never repaints, never backpaints, Not Lag 100% compatible with Expert Advisor development All types of alerts available: Pop-up, Email, Pus

The CCI Trend Dashboard is an advanced technical analysis tool available that provides a dashboard interface for traders to analyze multiple symbols and timeframes at once. It uses the Commodity Channel Index (CCI) in combination with currency strength and volumes to analyze market trends. The tool is user-friendly and suitable for both beginner and advanced traders. Note: The values are derived from the CCI values of the respective symbol and timeframe using the specified period from the sett

An indicator based on candlestick patterns
To catch short-term and long-term trends
If it gives a signal in the direction of the trend, it is long term
And if it gives a signal in the opposite direction of the trend, it is short term
Too many signals
Can be used in all symbols
Can be used in all time frames
Attributes: Too many signals Can be used in all symbols Can be used in all time frames Simple settings Simple and fast usage With author lifetime support
Settings: Candle back: Th

The Squeezer indicator simply draws ascending lines with Sell signal in the downtrend and descending lines with Buy signal in the uptrend to catch the pullbacks and sniper entries. This is a common successful trading strategy being used by many successful traders, and the good thing about this strategy is that it works with all time frames. The difference is in the take profit level between them. Buy / Sell signals are triggered at the close of the current candles above / below the ascending or

40% off. Original price: $50 Moving Average Trend Scanner is a multi symbol multi timeframe triple MA crossover dashboard that helps traders to monitor, and identify potential market trends from one chart. This panel scans 3 moving averages in up to 28 configurable instruments and 9 timeframes for triple moving average alignment and moving average crossover with a deep scan feature to scan all market watch symbols (up to 1000 instruments!).
Download Demo here (Scans only M1 and M6) Sett

This indicator converted from 5 min Buy and Sell Range Filter - guikroth version on TradingView Popularity of the Range Filter
The Range Filter is a very popular and effective indicator in its own right, with adjustments to the few simple settings it is possible to use the Range Filter for helping filter price movement, whether helping to determine trend direction or ranges, to timing breakout or even reversal entries. Its practical versatility makes it ideal for integrating it's signals into

Multicurrency and multitimeframe indicator of the Standard Deviation Channel. Displays the current direction of the market. On the panel, you can see breakouts and touches (by price) of the levels of the linear regression channel. In the parameters, you can specify any desired currencies and timeframes. Also, the indicator can send notifications when levels are touched. By clicking on a cell, this symbol and period will be opened. This is MTF Scanner. The key to hide the dashboard from the char

LAUTSTÄRKE RICHTUNG MT5
Normalerweise ändert sich die Farbe der Lautstärkeanzeige, wenn die aktuelle Lautstärke höher als die vorherige ist. Dies ist wichtig, aber nicht sehr nützlich.
Aus diesem Grund wurde dieser Indikator erstellt, der zusätzlich zum normalen Volumen, wenn die Kerze bullisch oder bärisch ist, sie in einer anderen Farbe anmalt, standardmäßig blau für bullisch und rot für bärisch, aber diese Farben können angepasst werden Geschmack des Händlers.
Vergessen Sie nicht,

I've combined two trading strategies, the Order Block Strategy and the FVG Trading Strategy, by utilizing a combination of the FVG indicators and Order Blocks. The results have been surprisingly effective.
This is a two-in-one solution that makes it easy for traders to identify critical trading zones. I've optimized the settings so that all you need to do is install and trade; it's not overly complex to explain further. No need for any usage instructions regarding the trading method. You shou

Quarterly Cycles
Quarterly Cycles is based on the Quarterly Theory developed by Daye ( traderdaye on X ). This is an aid to the user to find Cycles and it is NOT automatic detected, user can select AMDX or XAMD in each Cycle and it will be visually drawn on the chart. Quarterly Cycles: Yearly, Monthly, Weekly, Daily, 6 Hour (90 minutes)
– Yearly Cycle : The year is divided in four sections of three months each Q1 - January, February, March Q2 - April, May, June Q3 - July, August, Sept

One of the most powerful and important ICT concepts is the Power of 3. It explains the IPDA (Interbank Price Delivery Algorithm) phases. PO3 simply means there are 3 things that the market maker's algorithm do with price:
Accumulation, Manipulation and Distribution
ICT tells us how its important to identify the weekly candle expansion and then try to enter above or below the daily open, in the direction of the weekly expansion.
This handy indicator here helps you keep track of the weekly

Dies ist ein MTF-Indikator für Unterstützungs- und Widerstandsniveaus basierend auf den Extremwerten des Advanced ZigZag Dynamic und/oder Extended Fractal Indikators mit Preisetiketten (kann deaktiviert werden). Für den MTF-Modus können höhere TFs ausgewählt werden. Standardmäßig werden die Ebenen basierend auf ZigZag-Indikatorpunkten generiert. Fraktale Indikatorpunkte können auch zusammen mit ZigZag oder stattdessen verwendet werden. Um die Verwendung zu vereinfachen und CPU-Zeit zu sp
It is a very simple indicator to display daily loss percentage, open position loss percentage, monthly loss percentage and monthly profit percentage. MT4 version
We assure you that we welcome any suggestions to improve this indicator and make the necessary changes to improve this indicator.
You can contact us via Instagram, Telegram, WhatsApp, email or here. We are ready to answer you.

Volume Delta Candles offer a straightforward way to analyze trading activity within each candle, making it easier to see what's happening without needing an extra volume indicator. This tool uses lower timeframe or real-time data to show the percentage of buying and selling volume within a candle as a colored bar. Make sure you understand Volume and Volume Delta before jumping in. If you’re not sure, reach out to me first for a quick rundown. But if you're already familiar, you're good to go! Ke

This is a well-known ZigZag indicator. But it differs by the fact that its plot is based on values of the middle line which is set by a user. It can display Andrews’ Pitchfork and standard or Bobokus Fibo levels. NO REPAINTING.
Parameters Period МА — middle line period. Default value is 34. Minimum value is 4. Maximum value is set at your discretion. Used to calculate price — type of price used for the midline calculations. The averaging method — type of smoothing for the middle line. Turning

This is the forex visual orders tool & forex position size (lot) calculator with intuitive panel. Risk Reward Ratio Indicator works on all kind of symbols: currency pairs, indices, metals, commodities, cryptocurrencies, etc.
If you want to make sure that Risk Reward Ratio Indicator works on your favorite symbols contact us ( visit our profile ) and ask for 7-day free trial to test this tool without limits. If you want to place orders easier, faster and more intuitive? If you like to mark tr

The Zero-Lag MA Trend Levels indicator combines a Zero-Lag Moving Average (ZLMA) with a standard Exponential Moving Average (EMA) to provide a dynamic view of the market trend. This indicator automatically plots the EMA and ZLMA lines on the chart. The colors of the lines represent the market trend.
With EMA: ++ green (uptrend) when EMA > zlma ++ red (downtrend) when EMA < zlma With ZLMA: ++ green (uptrend) when the line is trending up ++ red (downtrend) when the line is trending down
When
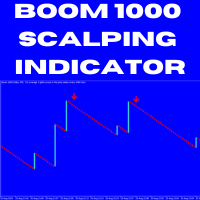
DC Boom 1000 Scalping Strategy Guide **Price**: $30 **Contact**: WhatsApp/Telegram: +27683229304 WhatsApp/Telegram: +27671192993 1. Understanding the Boom 1000 Index Boom 1000 Index: A synthetic index known for generating upward spikes. This strategy focuses on capturing the brief downward movements between spikes by selling when specific signals appear. 2. Timeframe M1 Timeframe: This strategy is exclusively designed for the 1-minute (M1) chart, allowing you to make quick trades and capture sma

Market volume profile indicator. It works on almost all instruments - currency pairs, stocks, futures, on real volumes and on ticks. It can be set as automatic determination of the range of building a profile, for example, for a week or a month, etc. and set the range manually by moving the borders (two vertical lines red and blue). Shown as a bar graph. The width of the histogram at a given level means, conventionally, the number of trades made on it. With the "Mode level line color" para

Boom and Crash Gold miner v2 Trading indicator based on market momentum works on m1 for boom and crash 1000 and M5 time frame for normal trading pairs wait for blue arrow to appear plus change of candle stick color and candlesticks must be above the 2 modified moving averages then you can buy the market. wait for orange arrow to appear plus change of candle stick color and candlesticks must be below the 2 modified moving averages then you can sell the market.

A Heatmap with a Volume Profile is like a thermal imager or x-ray machine. It will help you to estimate the relative distribution of volume during the price movement and to understand the relationship between volume and price. Indicator Volume Profile "Volumos Maxima" is a powerful tool for analyzing this relationship. After simple experimentation with heatmap, you can find that each trading instrument has its own “ characteristic ” way of distributing volume. And this will help you to make a b

Advanced Stochastic Scalper ist ein Oszillator mit dynamischen überkauften und überverkauften Niveaus, während diese Niveaus im Standard-Stochastic-Oszillator statisch sind und sich nicht ändern. Dadurch kann sich Advanced Stochastic Scalper an den sich ständig ändernden Markt anpassen.
Wenn ein Kauf- oder Verkaufssignal erscheint, wird ein Pfeil auf dem Chart gezeichnet und eine Warnung ausgelöst, die es Ihnen ermöglicht, rechtzeitig eine Position zu eröffnen und nicht ständig an Ihrem PC zu s

Trap Play refers to a market situation where price initially makes a new high or low, luring traders into believing a strong trend is forming. However, the price quickly reverses and invalidates the breakout, trapping those traders who entered positions based on the initial move. This sudden reversal often results in a rapid exit of positions, leading to significant price movement in the opposite direction. Trap plays can occur in various financial markets and timeframes and are characterized

Optimized Trend Tracker OTT is an indicator that provides traders to find an existing trend or in another words to ser which side of the current trend we are on.
We are under the effect of the uptrend in cases where the prices are above OTT ,
under the influence of a downward trend, when prices are below OTT
it is possible to say that we are.
The first parameter in the OTT indicator set by the two parameters is the period/length.
OTT will be much sensitive to trend movements if i

To get access to MT4 version please click here . This is the exact conversion from TradingView: "SwingArm ATR Trend Indicator" by " vsnfnd ". Also known as : "Blackflag FTS" by "Jose Azcarate" This is a light-load processing and non-repaint indicator. All input options are available except multi time frame. Buffers are available for processing in EAs. Extra option to show buy and sell signal alerts. You can message in private chat for further changes you need.
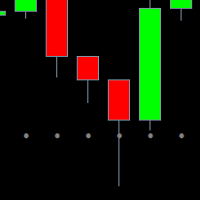
Wie viel Gewinn wird durch ein falsch installiertes Teikprofit verloren. Und wie viele Kerzenmuster weigerten sich, zu arbeiten, weil es an der Stelle ihrer Ausbildung keinen Interessenbereich für Bieter gab. Verpasste Gewinne und unrentable Eingänge bei der richtigen Wahl der globalen Richtung sind immer eine Schande im Triple. Der Handel bringt sehr viel Schmerz und Chaos mit sich, wenn wir versuchen, ohne klare Ziele zu handeln. Normalerweise zeichnen sie den Kanal und die Ebenen in den Hande
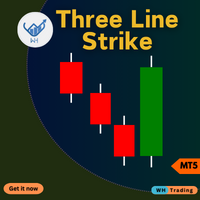
ThreeLine Strike Indicator für MetaTrader 5 (MT5). Dieses fortschrittliche Tool soll Ihnen dabei helfen, potenzielle Trendwenden auf dem Markt präzise und einfach zu erkennen.
Egal, ob Sie Anfänger oder erfahrener Händler sind, dieser Indikator kann Ihre Handelsentscheidungen verbessern und Ihre Gewinne maximieren. Contact me after purchase for guidance Hauptmerkmale: Präzise Umkehrsignale : Erkennen Sie potenzielle Trendumkehrungen anhand des Dreilinien-Strike-Musters, einer bewährten Can

Der RSI Crossover Alert ist ein leistungsstarkes Benachrichtigungssystem, das speziell für Händler entwickelt wurde, die den Relative Strength Index (RSI) in ihren Handelsstrategien verwenden. Dieser Indikator konzentriert sich auf die Identifizierung von RSI-Überkreuzungen, die auftreten, wenn die schnelle RSI-Linie die langsame RSI-Linie über- oder unterschreitet. Durch die Kombination dieser Überschneidungen filtert der Indikator effektiv falsche Signale heraus und ermöglicht es Händ

The Bollinger R (Bollinger Reversals) is designed to recognize short term high profitable counter trend patterns from the chart. This system combines both Bollinger Bands and mean reversion to define positions where the market could potentially reverse direction. This is the MT5 version of Bollinger R Description Bollinger Bands are well known in the trading community. I have added the concepts mean reversion and "distance between Price and a Moving Average" to help confirm and trade the “bounce

Brilliant Reversal Indicator for MetaTrader 5 - Your Ultimate Alert-Driven Trading Solution Unlock unparalleled trading success with the "Brilliant Reversal Indicator" tailored for MetaTrader 5. This powerful tool has been meticulously designed to empower traders by identifying critical reversal opportunities with lightning-fast alerts. Key Features: Precise Reversal Detection: The Brilliant Reversal Indicator for MT5 specializes in pinpointing potential trend reversals, providing you with a str
Nützliches Werkzeug, das Sie benachrichtigt, wenn es eine mögliche Bewegung durch Volumeneingabe entdeckt.
Grundsätzlich in Futures.
Erkennt Bereiche ohne ANGEBOT / KEINE NACHFRAGE.
Vergleichen Sie das Volumen der Kerze mit den vorherigen.
Wenn die Lautstärke gesunken ist, wenn die aktuellen Kontrakte, übertreffen die vorherige, ALERT!
- Es kann in der Hauptgrafik oder in den Hauptfenstern geladen werden.
- Für jede Zeitlichkeit.
- Es warnt Sie mit einem Popup-Fenster,

Smart Tape - это индикатор ленты всех сделок с возможностью агрегации по цене и времени и фильтрацией по величине объема, включает в себя два отключаемых варианта отображения. Вариант 1: перемещаемое окно по графику со списком сделок (Time Sales). Список обновляется сверху вниз и не имеет возможности просмотра истории. Количество отображаемых строк выбирается пользователем. Порядок отображения в строке: время с точностью до миллисекунд, тип сделки (B - покупка или S - продажа

Der Indikator "HLC_bar_MT5 Wyckoff" für MT5 wurde erstellt, um die Analyse zum Zeitpunkt des Handels zu erleichtern. Die HLC Bar wurde von Richard Wyckoff verwendet und wird derzeit häufig in "VSA" -Operationen verwendet. Wyckoff stellte fest, dass die Verwendung von High, Low und Close den Graphen viel sauberer und einfacher zu analysieren machte. Der Indikator "HLC_bar_MT5 Wyckoff" ermöglicht: # Ändern Sie die Balkenbreite; # Lassen Sie die Leiste dieselbe Farbe; # Und markieren Sie die Bar, d

Was: $99 Now: $34 Blahtech Daily Range indicator displays the average daily range alongside the individual session ranges. Using the daily open price as a reference the indicator shows fixed range and dynamic range targets as lines on the charts. These lines clearly show when the average range has been exhausted. Daily and session ranges can be useful for confirming entries or setting targets and is an excellent odds enhancer for many trading systems. Links [ Documentation | Install |

** NOTE: This indicator uses realtime data. Thus DO NOT download Demo version. If you still need demo version, please refer to free version .
Symbol Chart Changer is an indicator/utility that offers you the option to switch between symbols and timeframes.
You can choose any symbol and timeframe on the same chart with just a few clicks. In addition, this indicator also shows the profit of the symbol through the color of the buttons.
Features: Click buttons on the chart to monitor all your

Smart Drawing Assist PRO MT5. Buttons will appears next to the selected object. The buttons are straightforward and amazingly easy to use. Features are as follow: Draw zigzag . Enabling you to draw patterns, draw zigzag, and draw shapes. All you have to do is click the button and start clicking point to point and it will draw automatically. Change object color . Rectangle/Trendline/HLine/Vline/Text/Price Arrow/Arrowed Line/ and your suggestion please. Flatten trendline . make a perfect flat line

Ein symmetrisches Dreiecks-Chartmuster stellt eine Phase der Kontraktion und Konsolidierung dar, bevor der Preis gezwungen ist, nach oben auszubrechen oder zusammenzubrechen. Ein Bruch von der unteren Trendlinie markiert den Beginn eines neuen Abwärtstrends, während ein Ausbruch von der oberen Trendlinie den Beginn eines neuen Aufwärtstrends anzeigt.
MT4-Version hier verfügbar: https://www.mql5.com/en/market/product/68709/
Dieser Indikator identifiziert diese Muster und warnt Sie, wenn sich
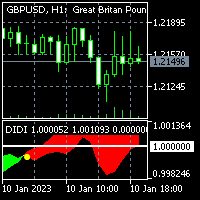
To get access to MT4 version please click here . - This is the exact conversion from TradingView: "Didi Index" by " everget ". - This is a popular version of DIDI index on tradingview. - This is a light-load processing and non-repaint indicator. - Buffer is available for the lines on chart and arrows on chart. - You can message in private chat for further changes you need. Thanks for downloading

6-BAND VWAP (Volume Weighted Average Price)
Fully customized and EA-friendly VWAP Bands Indicator.
Main Features:
Choose the period of VWAP calculation reset (Daily, Weekly or Monthly): For day trading use the Daily VWAP, and for longer term analysis use the Weekly or Monthly calculations. Choose how many bands (deviations) you want to show, up to 6. Choose zero to display only the main VWAP line. Fine adjustment of the deviation of the bands: Find the best band’s deviation for the in
Order Block Tracker is here to solve one of the biggest challenges traders face: identifying order blocks. Many traders fail to spot these critical zones, often missing out on key market entries. But with Order Block Tracker , you no longer have to worry about that. This advanced indicator automatically highlights these crucial zones for you, giving you the confidence to enter the market at the right time. MT4 Version - https://www.mql5.com/en/market/product/123358/ Key Features of Order

Moon 1 is a Box Break is a powerful indicator of Break Zone for any par and any timeframe. It doesn't requires any additional indicators for the trading setup.The indicator gives clear signals about opening and closing trades.This Indicator is a unique, high quality and affordable trading tool.
Perfect For New Traders And Expert Traders Low risk entries. Never repaints signal. Never backpaints signal. Never recalculates signal. For MT5 Only Great For Scalping Great For Swing Trading Arr
The VSA Scanner Dashboard is a multi-symbol, multi-timeframe scanner that displays VSA signals. It is based on the Volume Plus and VSA Signals indicator. Features Displays the VSA signal of the last closed candle. Monitors 28 customizable instruments (symbols) and up to 21 timeframes at the same time. Easily arrange symbols in any order. Each signal has a tooltip that displays the name and time of appearance. Click on each signal to open a new chart. All types of alerts (sound, pop-up, email,

This indicator shows when user set sessions are active and returns various tools + metrics using the closing price within active sessions as an input. Users have the option to change up to 4 session times.
The indicator will increasingly lack accuracy when the chart timeframe is higher than 1 hour.
Settings
Sessions
Enable Session: Allows to enable or disable all associated elements with a specific user set session.
Session Time: Opening and closing times of the user set session

MetaCOT 2 is a set of indicators and specialized utilities for the analysis of the U.S. Commodity Futures Trading Commission reports. Thanks to the reports issued by the Commission, it is possible to analyze the size and direction of the positions of the major market participants, which brings the long-term price prediction accuracy to a new higher-quality level, inaccessible to most traders. These indicators, related to the fundamental analysis, can also be used as an effective long-term filter

Volumen und MarketProfile Pro Beschreibung: Der MarketProfile Indikator bietet Ihnen eine präzise und detaillierte Analyse des Handelsvolumens über verschiedene Preisniveaus hinweg, indem er das Volumenprofil für jeden einzelnen Tag berechnet und darstellt. Dieser Indikator ist ideal für Händler, die ein tiefes Verständnis der Marktstruktur und der Volumenverteilung benötigen, um fundierte Handelsentscheidungen zu treffen. Hauptmerkmale: Tägliche Volumenanalyse: Der Indikator berechnet und zeig

Blahtech Fisher Transform indicator is an oscillator that displays overbought and oversold locations on the chart. The Fisher Transform algorithm transforms prices with any distribution shape into a normal distribution. The end result is a curve with sharp turning points that may help to identify bullish or bearish trends. Fisher Transform values exceeding 1.66 on the daily chart are considered to be good areas for reversal trades. Links [ Install | Update | Training | All Products ]

Boom and Crash Buy and Sell Trend. Non-repaint. Can be used on all timeframes 1 minute for scalpers. 5 minute to monthly timeframe for swing trading. works on all boom and crash pairs Crash300, Crash500, Crash1000. Boom300, Boom500, Boom1000. Green histogram colour means the trend is up(bullish) Buy signal. Dark orange histogram colour means the trend is down(bearish) Sell signal.

This non-repainting indicator, inspired by Larry Williams’ renowned "VIX Fix", replicates the power of the VIX (Volatility Index) but works across all asset classes—making it a versatile tool for traders. Originally designed for stock indices, this version adapts to any market, including forex, commodities, and crypto, providing valuable insights into potential market bottoms.
For more details, check out this pdf: https://www.ireallytrade.com/newsletters/VIXFix.pdf
Key Features: Based on the
This VWAP indicator is one I personally use in all of my trading strategies. Over time, I’ve found it to be one of the most accurate and reliable indicators for tracking price action and volume relationships. The best part about VWAP is that it remains consistent across all timeframes, so you don't have to worry about selecting the optimal timeframe or adjusting inputs.
Key features- Multiple VWAP Options : Offers 4 types of VWAP—daily, weekly, monthly, and yearly. Each comes with an adjustabl

The Market Momentum indicator is based on the Volume Zone Oscillator (VZO), presented by Waleed Aly Khalil in the 2009 edition of the International Federation of Technical Analysts journal, and presents a fresh view of this market valuable data that is oftenly misunderstood and neglected: VOLUME. With this new approach of "seeing" Volume data, traders can infer more properly market behavior and increase their odds in a winning trade.
"The VZO is a leading volume oscillator; its basic usefulnes
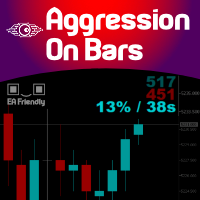
Imagine a Buy and Sell Pressure monitor on your chart that shows in REAL-TIME this data, bar by bar? Well, imagine no more. We present you an exclusive creation of Minions Labs : Aggression On Bars indicator. On every new bar on you chart this indicator will start counting in real-time the BUY/SELL pressure and present this data statistics directly inside your chart. As soon as a new bar is created in your chart, the counter restarts. Simple and effective. Just watch the video to see it running

The Advanced Trend Scalper MT5 indicator is designed to help both novices and professional traders. The indicator analyses the market and gives you buy and sell signals. It does not use any other indicators, it works only with the market actions. The signal appears right after the candle close and it does not repaint. The efficient algorithm provides a high degree of reliability of such signals. Advanced Trend Scalpe r for the MetaTrader 4 terminal : https://www.mql5.com/en/market/product/

The Multitimeframe-Candles (MCandles) - Indicator for MT5 shows the contour of an higher, free selectable, timeframe as an overlay on the current timeframe. You can freely choose the timeframe, number of candles and color of the overlays. The indicator only calculates the current candle frequently, so it saves computing capacities. If you like the indicator, please left a comment.

The indicator is designed to detect range market or consolidation areas on the chart. It does this by using the market volatility and price momentum. The indicator signals the start and stop of the range with icons on the chart and various type of alerts options provided in the input settings. Usage: The indicator can be used to check the state of the market i.e. trending or ranging to make appropriate decision and use strategies designed for specific market state. Please see the attached video
Crash Sniper Scalping Indicator for MQL5
The **Crash Sniper Scalping Indicator** is a powerful and reliable tool specifically designed for traders looking to profit from the Crash markets. Whether trading Crash 1000, Crash 900, Crash 600, Crash 500, or Crash 300 indices, this indicator provides high-precision signals to simplify scalping. With its clear visual cues and accuracy, it's an essential tool for traders aiming to capitalize on quick market movements.
Key Features: - **Multi-Timefr
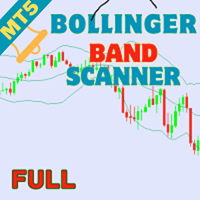
Welcome to the next level of trading sophistication with the Bollinger Bands Scanner for MT5! Elevate your trading experience and unlock enhanced insights and efficiency with our powerful MT5 indicator. Key Features: Effortless Bollinger Bands Scanning: Seamlessly harness the power of the Bollinger Bands Scanner to scan multiple assets effortlessly. Receive instant alerts when specific Bollinger Bands conditions are met, ensuring you're always ahead of market movements. Comprehensive Dashboard I
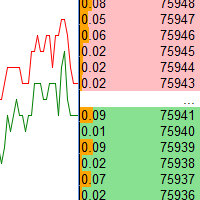
Tiefe der Marktanzeige. Es können bis zu 16 Instrumente angezeigt werden. Es gibt ein automatisches Scrollen der Preise, das durch Klicken auf "A" oben im Fenster deaktiviert werden kann. Es ist ein ziemlich schöner Indikator, es kann als Begrüßungsbildschirm fungieren, es wird nicht so langweilig sein, wie ein normales Diagramm auszusehen, genau richtig für die Meditation, besonders nach großen Marktverlusten. Der Indikator ist nicht für den Handel bestimmt, daher ist Ihre Einzahlung vollständi

Description : In the world of trading, candlestick patterns are a popular technical analysis tool used by many traders. There are numerous candlestick patterns, ranging from reversal patterns to continuation patterns. However, remembering all these patterns can be challenging, especially for novice traders. This often leads to traders having to manually memorize and identify candlestick patterns, which can be time-consuming and prone to errors. Candle Pattern Pro is a powerful indicator desig
MetaTrader Market - der einzige Shop, in dem man Handelsroboter als Demoversion herunterladen und testen sowie anhand historischer Daten optimieren kann.
Lesen Sie die Beschreibung und Bewertungen anderer Kunden über das gewünschte Produkt, laden Sie es direkt ins Terminal herunter und erfahren Sie, wie man einen Handelsroboter vor dem Kauf testet. Nur bei uns können Sie ein Programm testen, ohne dafür zu bezahlen.
Sie verpassen Handelsmöglichkeiten:
- Freie Handelsapplikationen
- Über 8.000 Signale zum Kopieren
- Wirtschaftsnachrichten für die Lage an den Finanzmärkte
Registrierung
Einloggen
Wenn Sie kein Benutzerkonto haben, registrieren Sie sich
Erlauben Sie die Verwendung von Cookies, um sich auf der Website MQL5.com anzumelden.
Bitte aktivieren Sie die notwendige Einstellung in Ihrem Browser, da Sie sich sonst nicht einloggen können.