• Typ des Indikators
  • Preis
     - 
  • Zurücksetzen
Schau das Lehrvideo über Market auf YouTube YouTube
Wie man einen Roboter oder Indikator kaufen kann
Starte Deinen EA im
Virtual Hosting
Teste einen Indikator/Roboter vor dem Kauf
Möchtest Du Geld im Market verdienen?
Wie man Produkte richtig präsentiert

Technische Indikatoren für den MetaTrader 5 - 9

icon Signale von technischen Indikatoren spielen eine entscheidende Rolle beim Eröffnen und Schließen von Geschäften auf den Aktien- und Devisenmärkten. Das Wesen von Indikatoren ist eine mathematische Transformation der Preise eines finanziellen Symbols, die darauf abzielt, zukünftige Preisänderungen vorherzusagen. Testen Sie technische Indikatoren, um das Marktverhalten besser vorherzusagen und davon zu profitieren.
Double Inside Bars
Juan Facundo Valdes
4.75 (4)
Dieser Indikator basiert auf der Strategie, die vom YouTube-Kanal „The Secret Mindset“ im Video „A Reliable Scalping Strategy I Discovered After 1 Month of Price Action Trading“ vorgeschlagen wurde. Eine vollständige und detaillierte Erläuterung der Strategie und Bedingungen zum Filtern der Signale finden Sie im Video.  * Der Ersteller des YouTube-Kanals hat nichts mit der Entwicklung dieses Indikators zu tun Die Signale sollten mit anderen Indikatoren kombiniert und nach dem Urteil jedes Händle
FREE
Gann Pivot Levels
Ali Gokay Duman
4.8 (5)
This indicator calculates gann support and resistance prices with use gann pyramid formulation and draw them on the chart. And If you want, Indicator can alert you when the current price arrive these pivot levels. Alert Options: Send Mobil Message, Send E-mail, Show Message and Sound Alert Levels: S1, S2, S3, S4, S5, R1, R2, R3, R4, R5 Inputs:  GannInputPrice: Input price for gann pyramid formulation. GannInputDigit: How many digit do you want to use for calculation formula. (The number and the
FREE
NakaTrend
Ricardo De Andrade Nakano
"Präsentieren Sie NakaTrend: Ihr ultimativer Trenddetektor für MetaTrader 5! Bereit, Ihr Handelserlebnis zu revolutionieren? Lernen Sie NakaTrend kennen, Ihren zuverlässigen Indikator zur präzisen und einfachen Identifizierung von Trendwechseln. Mit NakaTrend verpassen Sie nie wieder die Gelegenheit, Marktschwankungen zu nutzen. Wenn ein Bullentrend entsteht, signalisiert NakaTrend dies mit einem grünen Dollarzeichen und fordert Sie auf, eine Kauforder zu platzieren. Und wenn sich die Stimm
FREE
Round Level MT5
Szymon Palczynski
5 (1)
The fact that round number levels have a significant influence on the market cannot be denied and should not be overlooked. These psychological levels are used by both retail Forex traders and major banks that deal in Forex.  Very simple and effective indicator and most importantly free. ////////////////////////////////////////////////////////////////////////////////////////////////////////////////////////////////////////////////////////////// The program does not work in the strategy tester.
FREE
Erleben Sie die Kraft des Demark Trends Indikators für eine umfassende Trendanalyse und Handelsideen. Demark Indikatoren sind bekannt für ihre Effektivität bei der Bewertung von Markttrends und Erschöpfungspunkten. Unser Demark Trends Indikator bringt diese Expertise auf die nächste Stufe, indem er automatisch präzise Trendlinien auf Ihren Charts zeichnet. Mit anpassbaren Parametern, einschließlich der Anzahl der Kerzen in den Berechnungen, Alarmeinstellungen und Farben der Linien, haben Sie die
FREE
ADX Channel Indicator
Alexander Nikolaev
4.8 (5)
Dieser Indikator bildet einen Kanal basierend auf den Messwerten des ADX-Indikators (Average Directional Movement Index), zeigt den Händler an und informiert ihn über eine Preisumkehr an den Grenzen dieses Kanals. Er kann auch melden, wenn der Preis die Kanalgrenzen berührt. Außerdem werden zusätzliche gepunktete Linien gezeichnet, die von den + DI- und -DI-Werten des ADX-Indikators abhängen. Es besteht auch die Möglichkeit, Signale in Abhängigkeit von den stochastischen Messwerten zu filtern.
FREE
FractalZones RUS
GEORGI ANIKIN
5 (1)
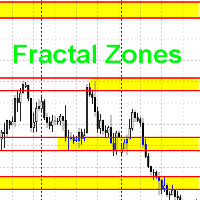
Данный индикатор рисует торговые зоны по фракталам со старших периодов, что упрощает торговлю по уровням. На одном графике данный индикатор рисует два типа торговых зон. Например если текущий период - H1, то торговые зоны будут искаться по фракталам с H4 и с D1. В стандартных настройках фрактальные зоны с H4 будут рисоваться желтым цветом, а с D1 - зеленым. При наложении зон, происходит смешивание цветов в месте пересечения зон. Как данную вещь поправить, я не знаю в данный момент. Принцип п
FREE
Donchian Pro
Paulo Henrique Faquineli Garcia
5 (3)
The Donchian Channel Channels are among the most popular tools of technical analysis, as they visually convey to the analyst the limits within which most price movement tends to occur. Channel users know that valuable information can be obtained at any time, whether prices are in the central region of a band or close to one of the border lines. One of the best known techniques to explore these concepts is Bollinger Bands. However, John Bollinger was not the only one to research the applicatio
FREE
Super Fractals
Aurthur Musendame
5 (4)
Think of the Super Fractal Indicator as the Bill WIlliams Indicator on Steroids. Indicator Abilities: 1. Adjust Candle around Fractal High or Low. 2. Adjust Lookback period and only plot for a specific number of history candles avoiding cluttering your trading desk. 3. The Indicator uses buffers so you call and use it from any EA. Note : The higher the candles around Fractal, the stronger the Turning point anfd viceversa is true.
FREE
Candle Pattern Pro MT5
Komang Putra Riswanjaya
Description : In the world of trading, candlestick patterns are a popular technical analysis tool used by many traders.   There are numerous candlestick patterns, ranging from reversal patterns to continuation patterns. However, remembering all these patterns can be challenging, especially for novice traders. This often leads to traders having to manually memorize and identify candlestick patterns, which can be time-consuming and prone to errors. Candle Pattern Pro is a powerful indicator desig
Inspiriert von ICTs privatem Mentorenkurs von 2016 (Monat 05), der auf YouTube geteilt wurde, ermöglicht unser innovatives Tool Händlern, die Märkte präzise zu navigieren. Durch Markierung von Perioden von 60, 40 und 20 Tagen hilft es, signifikante Marktbewegungen zu identifizieren und dabei auf das von ICT vermittelte Wissen zurückzugreifen. Was diesen Indikator wirklich auszeichnet, ist seine Vorwärtsprojektionsfähigkeit, ein Merkmal, das wertvolle Einblicke in zukünftiges Marktverhalten auf d
FREE
High Low Swing
Shahabeddin Baset
High Low Swing (HLS) Indicator The HLS indicator is a technical analysis tool designed to identify swing highs and lows in the market, aiding swing traders in making informed decisions. It offers an adjustable "degree" parameter, allowing you to customize the sensitivity to strong price movements based on current market conditions. Features: •    Clear Buy/Sell Signals: The indicator plots signals directly on the chart, simplifying trade identification. •    Adjustable Swing Strength: The "
FREE
Market Sniper Zone
Brendan Chinwedu Eze
4.75 (4)
Die Non-Repaint-Zonen sind ein Zeitbasisindikator, der nach einer möglichen Umkehrung des Marktes für einen perfekten Einstieg sucht. Es liest die Geschichte und zeichnet die mögliche Zone für unseren Comfort. Der Indikator verfügt über vier verschiedene Zonen, die die Geschichte des Marktes über 10.000 vorherige Balken lesen und den möglichen Einstiegspunkt vorhersagen. Es scannt bei jeder Markttrendänderung neu, um uns die mögliche Zone zu geben, es wird für den Handel mit allen Arten von Mä
FREE
V1 Stochastic Alert
Paul Conrad Carlson
5 (1)
Stochastic indicator alerts  when  EA Available in comments , must have indicator installed buys stochastic main line is above  signal line stochastic is below 30 rsi 5 is below 20 sell stochastic main line is below signal line stochastic is above 70 rsi 5 is above 80 ADD to chart  Stochastic k 30 - d 9 - slowing 3, levels 30/70 rsi 5 lelels 20.80 Full alerts  push, mobile , email ect All input settings variable  feel free to contact for more information or alert sugestions
FREE
Limited Time Offer! Take advantage of our 19% discount in celebration of our panel upgrade, now including Bias (1D, 4H, 1W). Buy now and boost your market analysis! Introducing the Smart Money Concepts (SMC) and Inner Circle Trader (ICT) Indicator , an advanced tool designed for professional traders seeking precision in their decisions. This indicator directly integrates the fundamental principles of SMC/ICT into your charts, providing clear and reliable visual signals to help you identify ke
A useful dashboard that shows the RSI values for multiple symbols and Time-frames. It can be easily hidden/displayed with a simple click on the X top left of the dashboard. You can input upper and lower RSI values and the colours can be set to show when above/below these values. The default values are 70 and 30. You can choose whether the dashboard is displayed on the right or left of the chart. If you want to have 2 dashboards on the same chart you must input a different name for each. The sca
FREE
Trend AMA MT5
Aleksei Krasov
4.5 (4)
Adaptive Moving Average (AMA) is a trend indicator using moving average and market noise filter. Indicator feature are blue and red points, showing the power of trend. Recommendations for trading: Auxiliary Indicator Detecting trend Detecting power of trend Detecting potential reversal points Main indicator Shows entry points for swing trading Serves as dynamic support and resistance Recommendations for use: Any instrument Any timeframe Input parameters: Period - AMA period Fast Period - fast MA
FREE
Aggression Volume
Flavio Javier Jarabeck
4.14 (14)
Aggression Volume Indicator is the kind of indicator that is rarely found in the MQL5 community because it is not based on the standard Volume data provided by the Metatrader 5 platform. It requires the scrutiny of all traffic Ticks requested on the platform... That said, Aggression Volume indicator requests all Tick Data from your Broker and processes it to build a very special version of a Volume Indicator, where Buyers and Sellers aggressions are plotted in a form of Histogram. Additionally,
FREE
SuperTrendNew
Tsog Erdene Borjigon Enkhkhudulmur
4.75 (4)
This Supertrend strategy will allow you to enter a long or short from a supertrend trend change. Both ATR period and ATR multiplier are adjustable. If you check off "Change ATR Calculation Method" it will base the calculation off the   S MA   and give you slightly different results, which may work better depending on the asset. Be sure to enter slippage and commission into the properties to give you realistic results. If you want automatic trade with Supertrend indicator, please buy following pr
FREE
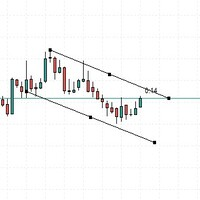
Are you tired of drawing trendlines every time you're analyzing charts? Or perhaps you would like more consistency in your technical analysis. Then this is for you. This indicator will draw trend lines automatically when dropped on a chart. How it works Works similar to standard deviation channel found on mt4 and mt5. It has 2 parameters: 1. Starting Bar 2. Number of bars for calculation The   starting bar   is the bar which drawing of the trend lines will begin, while the   number of bars for c
FREE
The XR Gartley Pattern MT5 is an indicator which displays and alerts Gartley pattern detected on the candlestick chart. It also displays potential trade with calculated Take Profit and Stop Loss. After purchasing XR Gartley Pattern Indicator, you can immediately download this indicator from the MT4-MT5 Market and start using it because all features are set to default, is not necessary to change any parameter. In addition, we have created a  private group  for customers who have purchased one of
FREE
The Daily Highs and Lows Indicator is a versatile tool that combines support and resistance levels with real-time market dynamics. By incorporating previous daily highs and lows, it provides valuable insights into market psychology and identifies potential areas of price reversals or breakouts. With its ability to adapt to changing market conditions and customizable options, traders can stay ahead of trends and make informed decisions. This indicator is suitable for various trading styles and ti
FREE
Cipher B Divergences
Alberto Gauer Borrego
5 (4)
Finally a Metatrader version of the very popular (and expensive) Market Cipher B indicator, or the Vumanchu Cipher B + Divergences very popular on Tradingview platform. This tool is very heavy on calculations, total are 31 plots using 97 buffers from several indicators. On my mid end computer, timeframes below M15 start getting a bit laggy, so it would require a powerful computer to run it properly at very low timeframes. It's still usable here, but somewhat sluggish response in Metatrader (l
FREE
CCFpExt
Stanislav Korotky
CCFpExt is an extended version of the classic cluster indicator - CCFp. Main Features Arbitrary groups of tickers or currencies are supported: can be Forex, CFDs, futures, spot, indices; Time alignment of bars for different symbols with proper handling of possibly missing bars, including cases when tickers have different trading schedule; Using up to 30 instruments for market calculation (only first 8 are displayed). Parameters Instruments - comma separated list of instruments with a common cu
Do you like trade Technical Analysis like I do? Then you will like this indicator, because it automatically calculates the support and resistance of the asset in simultaneous timeframes, or the famous MTF (Multi Time Frame). In addition to support and resistance, it is possible to have alert signals when the price breaks or touches (or both). Its configuration is very simple. The visual is fully configurable. Enjoy it!
If instead of giving the regression value indicator end of the regression line (LRMA), we give the value of its slope, we obtain LRS or Linear Regression Slope Indicator. Since the slope is positive when prices rise, zero when they are in range and negative when they are lowered, LRS provides us the data on the price trend. Calculation                       sum(XY, n) - avg(Y, n)*sum(X, n)   Y= a + mX;      m=  --------------------------------        a= avg(Y, n) - m*avg(X, n)                   
Swing Tracer
Ely Alsedy
5 (1)
it depends on ATR period to get swing points to help make better trading decisions  blue dot and red dot is the default color scheme of course you can change it later if you'd like  you can change the following : ATR PERIOD  sending notifications number of times to send notifications  sending notifications to your smart phone that's it very simple to use just drag and drop and follow the trend 
The indicator show Higher timeframe candles for ICT technical analisys Higher time frames reduce the 'noise' inherent in lower time frames, providing a clearer, more accurate picture of the market's movements. By examining higher time frames, you can better identify trends, reversals, and key areas of support and resistance. The Higher Time Frame Candles indicator overlays higher time frame data directly onto your current chart. You can easily specify the higher time frame candles yo
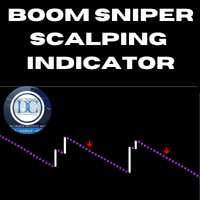
Boom Sniper Scalping Indicator for MQL5 The **Boom Sniper Scalping Indicator** is a highly accurate and reliable tool, specifically crafted for traders aiming to maximize profits in the Boom markets. Whether you're trading Boom 1000, Boom 900, Boom 600, Boom 500, or Boom 300 indices, this indicator provides precision signals to streamline your scalping strategy. With a focus on accuracy and efficiency, it is an indispensable asset for traders looking to capitalize on quick market movements.
The rubdfx divergence indicator is a technical analysis tool that compares a security's price movement. It is used to identify potential changes in the price trend of a security. The indicator can be applied to any type of chart, including bar charts and candlestick charts. The algorithm is based on MACD, which has been modified to detect multiple positive and negative divergences. Settings  ___settings___ * fastEMA * slowEMA * signalSMA *Alerts:   True/False     #Indicator Usage B
This indicator is the same as the popular Heiken Ashi Smoothed. The Heikin Ashi indicator for MetaTrader 5 already exists, but it has two disadvantages: It paints the candles not accurate. It's not possible to change the candle width. See also Heikin Ashi in MQL5 Code Base . In this version there are no such disadvantages.
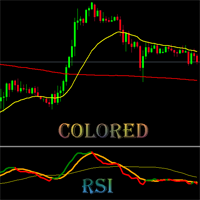
This is  Colored RSI Scalper Free MT5  -is a professional indicator based on the popular Relative Strength Index (RSI) indicator with Moving Average and you can use it in Forex, Crypto, Traditional, Indices, Commodities. Colors are made to make trend, and changing trend more easily. Back test it, and find what works best for you. This product is an oscillator with dynamic overbought and oversold levels, while in the standard RSI, these levels are static and do not change. This allows Colored RS
KT Weis Wave Volume MT5
KEENBASE SOFTWARE SOLUTIONS
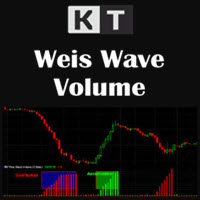
The KT Weis Wave Volume is a technical indicator based on the current market trend and description of the price movement's direction. The indicator is based on volume and displays the cumulative volumes for price increases and decreases in the price chart. In addition, the indicator window shows a histogram of green and rising red waves. The green color represents upward movement; the more the price rises, the larger the green volume. The red color represents a decreasing wave; the larger t
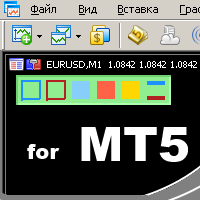
удобный инструмент для тех, кто использует технический анализ с использованием таких инструментов, как Трендовая линия и Прямоугольник. Имеется возможность настройки двух пустых прямоугольников, трех закрашенных и двух трендовых линий. Настройки индикатора крайне просты и делятся на пронумерованные блоки: С цифрами 1 и 2 вначале - настройки пустых прямоугольников (рамок); С цифрами 3, 4 и 5 - настройки закрашенных прямоугольников; С цифрами 6 и 7 - настройки трендовых линий. Объекты создаются оч
ATR dynamic levels
Evgenii Bazhenov
3.67 (3)
ATR dynamic level The indicator calculates the price range within which the asset price moved for the specified period of time, and also builds the boundaries of the calculated range for the current week and for today. The levels are calculated from the beginning of the opening of the week (weekly) and from the beginning of the opening of the day (daily). Features: 1) Support and resistance levels are always relevant, since these levels change along with the price movement. If the price has
Trend Scanner MT5
Alfiya Fazylova
5 (1)
Trend Scanner is a trend indicator that helps to determine the current and forecast market direction using an advanced algorithm. Thanks to flexible alert settings, the indicator will promptly warn you about a trend reversal. The indicator is intuitive and easy to use, and will be an excellent filter in your trending trading strategies. The lines of this indicator are also an excellent dynamic level for stop loss, and is used as one of the types of trailing stop in Trading Panel . To fine-tune t
BB Squeeze MT5
KEENBASE SOFTWARE SOLUTIONS
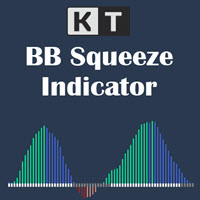
KT BB Squeeze measures the contraction and expansion of market volatility with a momentum oscillator, which can be used to decide a trading direction. It measures the squeeze in volatility by deducing the relationship between the Bollinger Bands and Keltner channels. Buy Trade: A white dot after the series of gray dots + Rising momentum above the zero line. Sell Trade: A white dot after the series of gray dots + Rising momentum below the zero line.  Markets tend to move from a period of low vol
KT MA Crossover MT5
KEENBASE SOFTWARE SOLUTIONS
KT MA Crossover draws the buy and sell arrows based on the crossover of chosen moving averages. Moreover, it also generates the appropriate alerts and displays the MFE (Most Favorable Excursion) for each successive signal. The moving average crossover is one of the primary strategies followed by traders around the world. Usually, it consists of a fast and slow moving average to find a buy and sell entry signal according to the crossover direction. Buy signal - when fast MA crosses above the slo
Buy CTS scalping indicator, provide buying and selling signals, automatic channeling and sending signals to mobile phones Using technical analysis and price action methods and modern methods, CTS indicator can draw price channels and recognize price trends with high accuracy and issue entry and exit signals according to them. Traders can easily fluctuate using this indicator in different time frames and in different markets. With the CTS indicator, you can signal in different ways. This indicat
Guppy Zones
Flavio Javier Jarabeck
4.84 (19)
If you have the opportunity to read the book " Trend Trading - A Seven-Step Approach to success " by Daryl Guppy, you will have a great deal of information about how to "read" the market. In his book Daryl show, among other things, how can we use a visual tool to measure the volatility and trend between Long and Short-term periods: The GMMA - Guppy Multiple Moving Averages . Instead of using his original idea of having 12 Exponential Moving Averages in your chart - which could be very CPU-dem
FREE
Find FVG
Maksim Tarutin
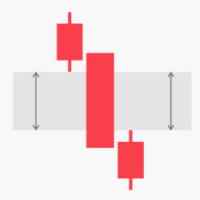
The Fair Value Gap (FVG) indicator is designed to help traders identify price imbalances in the market. It automatically identifies and visualizes areas where the price deviates significantly from its fair value, which can indicate potential trading opportunities. Automatic FVG detection: The indicator automatically finds and marks areas on the chart where price leaves “gaps” between candles, indicating possible market imbalances.
FREE
Dark Breakout MT5
Marco Solito
5 (3)
Dark Breakout   is an Indicator for intraday trading. This Indicator is based on Trend Following  strategy, providing an entry signal on the breakout. The signal is provided by the arrow, which confirms the breaking of the level. We can enter in good price with this Indicator, in order to follow the main trend on the current instrument. It is advised to use low spread ECN brokers. This Indicator does Not repaint and N ot lag . Recommended timeframes are M5, M15 and H1. Recommended working pairs
Ind5 InfoPad Information Panel
Vladislav Andruschenko
4.88 (8)
INFOPad ist eine Informationsanzeige, die Informationen zum ausgewählten Währungspaar im MetaTrader 5-Terminal erstellt. Es gibt 5 Funktionen dieses Indikators: Zeigt die wichtigsten und wichtigsten Informationen zum ausgewählten Symbol an: BID, Spread, Stop-Level, Swap, Tick-Wert, Provisionspreise; Zeigt die zukünftigen Ziele von SL-Ziel und TP-Ziel (Anzahl der Punkte des festgelegten Stop-Loss- und Take-Profit-Gewinns, Dollarbetrag); Es zeigt den erzielten Gewinn für die Zeiträume: Heute, Woc
FREE
This indicator contains Pivot Levels of: Traditional Fibonacci Woodie Classic Demark Camarilla  Calculation periods can be set to auto / Daily / Weekly / Monthly / Yearly.  Number of Levels are editable.  Options to hide level labels and price labels.  Pivots Points are price levels chartists can use to determine intraday support and resistance levels. Pivot Points use the previous days Open, High, and Low to calculate a Pivot Point for the current day. Using this Pivot Point as the base, three
AI Channel
Thalles Nascimento De Carvalho
4.2 (5)
Einleitung: Willkommen zur Präsentation des AI Channel Indikators, einem leistungsstarken Tool, das künstliche Intelligenz für die Analyse von Preisbereichen auf dem Finanzmarkt verwendet. In dieser Sitzung werden wir erforschen, wie dieser revolutionäre Indikator Anlegern und Händlern dabei helfen kann, fundiertere und strategischere Entscheidungen zu treffen. Fangen wir an! I. Was ist der AI Channel Indikator? AI Channel ist ein Indikator, der auf fortschrittlichen künstlichen Intelligenzalgor
FREE
25% off. Original price: $40 RSI Scanner is a multi symbol multi timeframe RSI dashboard that monitors Relative Strength Index indicator for price entering and exiting overbought and oversold in up to 28 symbols and 9 timeframes. Download Demo here  (Scans only M1, M5 and M10) Settings description   here MT4 version   here RSI Scanner features: Signals RSI entering and exiting the overbought and oversold zones. Monitors 28 customizable instruments and 9 timeframes at the same time. Supports
YOU CAN NOW DOWNLOAD FREE VERSIONS OF OUR PAID INDICATORS . IT'S OUR WAY OF GIVING BACK TO THE COMMUNITY ! >>>    GO HERE TO DOWNLOAD The   Volatility Ratio   was developed by Jack D. Schwager to identify trading range and signal potential breakouts. The volatility ratio is defined as the current day's true range divided by the true range over a certain number of days N (i.e. N periods). The following formula is used to calculate the volatility ratio: Volatility Ratio (VR) = Today's True Rang
FREE
MT5 Candlestick Pattern Alert Indicator: Enhance Trading Precision and Speed Overview The MT5 Candlestick Pattern Alert Indicator stands as a robust solution tailored to empower traders by swiftly detecting candlestick patterns and delivering timely alerts through various channels. This advanced tool facilitates efficient analysis of patterns, enabling traders to seize potential profitable trades promptly. Significance of Candlestick Patterns Candlestick patterns play a pivotal role in technical
FREE
LT Force
Thiago Duarte
5 (5)
For those who like trend the Force will be a very useful indicator. This is because it is based on the famouse ADX, which measure the strenght of a trend, but without its 3 confusing lines. Force has its very simple interpretation: if the histogram is above zero level the trend is up, otherwise it is down. You can use it to find divergences too, which is very profitable. Thanks to Andre Sens for the version 1.1 idea. If you have any doubt or suggestion, please, contact me. Enjoy! This is a fre
FREE
One Moving Average
Aurthur Musendame
4.75 (4)
This indicator was created based on posts from forex factory thread titled There is no Magic Moving Average - You need only one - by @andose2 a.k.a Andrei Florin. If you want to know about how to use this trading strategy please go and read  https://www.forexfactory.com/thread/691864-there-is-no-magic-moving-average-you. Note: Below are extracts some of the posts . Estabilish a trend, based on Market Cycles, then go   only long in the Markup Phase   and   only short in the Decline phase ,  
FREE
Simple ATR (Average True Range) Channel to find your Stop Loss and/or Take Profit. Indicator allows to draw a second multiplier if you need different values for SL and TP. Leave the second multiplier to 0 if not used. Settings + Length + Smoothing  + Multiplier #1 (default 1.5) + Multiplier #2 (set to 0 if not used) + High price + Low price + show price line + colors can be changed Please leave wishes in the comments. Reviews are also welcome.
FREE
Heikin Ashi Delta
Flavio Javier Jarabeck
5 (7)
For those who love to trade using the Heikin Ashi Candlesticks, here it is a powerful ally: Heikin Ashi Delta . This indicator was presented by Dan Valcu in his book about Heikin Ashi candlesticks called " Heikin Ashi - How To Trade Without Candlestick Patterns " - and by the way this is a very cool book, we totally recommend it. Even for those of you who don't trade using Heikin Ashi candlesticks could use this Leading Indicator anyway. It is more "nervous" than let's say a Stochastic, but coul
FREE
VR Ticks MT5
Vladimir Pastushak
4.33 (3)
VR Ticks   ist ein spezieller Indikator für Scalping-basierte Strategien. Dank dieses Indikators kann der Händler den Tick-Chart direkt auf dem Hauptchart des Finanzinstruments sehen. Mit einem Tick-Chart können Sie eine Position am Markt so genau wie möglich eingeben oder schließen. VR Ticks stellt Zeckendaten in Form von Linien dar, deren Farbe sich je nach Richtung ändert – so können Sie die Situation an Zecken visuell verstehen und beurteilen. Der Vorteil von Tick-Charts besteht darin, dass
FREE
RS Zone
Chayakorn Rakwongthai
RS Zone is an Indicator used to plot the support and resistance levels of each asset. and each time period as we determine The principle for calculating support and resistance levels is based on the price range (Range SR) to see if there are points where the price repeatedly reverses at that price level or not. The total pot will be equal to the Total SR that we set. Example If Range SR is equal to 120, the system will choose to look at data going back 120 candlesticks to find whether there is a
FREE
Premium Trend Entry Pro TZ Trade Logics präsentiert Ihnen die verbesserte Version des Premium-Trendeintrags Diese Version bietet Ihnen einen viel entspannteren Handelsstatus mit erweiterten Funktionen für die Trendfilterung und Premium-Signaleingabezeiten. Für uns ist nicht die Schaffung des Produkts wichtig! aber fortgesetzte Wartung und Schulung der Benutzer. Durch unsere engagierten Mittel, um uns zu erreichen, erhalten Sie eine genaue Anleitung zur Verwendung des Produkts und andere r
FREE
Trading Session Indicator Der Trading Session Indicator visualisiert die Hoch- und Tiefpunkte sowie die Start- und Endzeiten der Asia, London und New Yorker Handelssitzungen direkt auf Ihrem Chart. Funktionen: Visualisierung der Haupt-Handelssitzungen Hervorhebung von Hoch- und Tiefpunkten Anzeige der Start- und Endzeiten jeder Sitzung Anpassbare Sitzungszeiten Benutzerfreundlich und effizient Anpassbarkeit: Jede Handelssitzung (Asien, London, New York) kann individuell an die spezifischen Hande
FREE
MomoPoints ist ein Indikator, der Long und Short Entry / Add Punkte im Chart anzeigt. Basiertend auf Momentum und Trendstärke zeigen die MomoPoints Entrys / Adds mit guten Risk to Reward ratio. Einstellungen ---------------------------------- Design: Es können Farben, die Größe sowie das Wingdings (Grafik Symbol) des Signals eingestellt werden. Signal Einstellungen: Es können Moving Average Periode,  Trendstärke,  Abstand von Moving Average zu Preis und RSI Periode eingestellt werden.
FREE
Description:  Strategy based around Open-Close Crossovers. Setup: I have generally found that setting the strategy resolution to 3-4x that of the chart you are viewing tends to yield the best results, regardless of which MA option you may choose (if any) BUT can cause a lot of false positives - be aware of this. Don't aim for perfection. Just aim to get a reasonably snug fit with the O-C band, with good runs of green && red. Option to either use basic open && close series data or pick your pois
FREE
Trend Line ALert Sound
Marcelo Guimaraes de Lima
This indicator serves to give sound alerts when the price passes the manually placed line. A very useful tool, which allows you not to spend too much time sitting in front of the computer. Note that the alert issued will always refer to the current candle, you can use multiple lines on the past chart to analyze. This indicator will always receive better updates.
FREE
Colored TRIX
Flavio Javier Jarabeck
4.5 (2)
Developed by Jack Hutson in the 80's, the Triple Exponential Moving Average (a.k.a. TRIX ) is a Momentum technical indicator that shows the percentage of change in a moving average that has been smoothed exponentially 3 times. The smoothing process was put in place in order to filter out price movements that are considered insignificant for the analysis period chosen. We at Minions Labs found hard to follow the smoothness of the original TRIX line, so we colored the TRIX line with BUY and SELL t
FREE
Seer Trend And Target
Sergey Perechesov
4.6 (10)
Der Indikator zeigt jeden Tag einen Trend und Ziele für die aktuelle Situation. Der Indikator reduziert auch die Zahl der Verlustgeschäfte, um die richtige Definition der Marktbedingungen zu zählen. Für Analyse und Handel innerhalb des Tages entwickelt. Wie man benutzt: Die blaue Linie zeigt den Eröffnungspreis des Tages, der auf eine spezielle 4-Linie-Formel gesetzt ist, die Ziele für den Tag setzt. Sie können sich ansehen und den Trend öffnen. Die graue Linie ist das erste Ziel. Wenn sie
FREE
Highly configurable Trader Dynamic Index (TDI) indicator. Features: Highly customizable alert functions (at levels, crosses, direction changes via email, push, sound, popup) Multi timeframe ability (higher and lower timeframes also) Color customization (at levels, crosses, direction changes) Linear interpolation and histogram mode options Works on strategy tester in multi timeframe mode (at weekend without ticks also) Adjustable Levels Parameters: TDI Timeframe: You can set the lower/higher
FREE
Auto Fib Retracements
Ross Adam Langlands Nelson
4.2 (5)
Automatic Fibonacci Retracement Line Indicator. This indicator takes the current trend and if possible draws Fibonacci retracement lines from the swing until the current price. The Fibonacci levels used are: 0%, 23.6%, 38.2%, 50%, 61.8%, 76.4%, 100%. This indicator works for all charts over all timeframes. The Fibonacci levels are also recorded in buffers for use by other trading bots. Any comments, concerns or additional feature requirements are welcome and will be addressed promptly. 
FREE
The Volume Weighted Moving Average (VWMA) is calculated based on Prices and their related Volumes giving importance to those candles with more Volume. During periods of almost equal volume distributed along the observed period (commonly, in low volume periods) the VWMA will be graphically similar to a Simple Moving Average. Used along other moving averages a VWMA could be used as an alert, filter or whatever your imagination could think of... HOW TO "READ" THIS INDICATOR As any Moving Average.
FREE
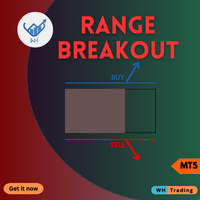
Erschließen Sie eine neue Dimension des Handels mit unserem hochmodernen MQL5-Indikator Range BreakOut MT5 Dieses leistungsstarke Tool wurde entwickelt, um Preisbewegungen zu erkennen und daraus Kapital zu schlagen, wenn sie aus etablierten Bereichen ausbrechen. Wir bieten Ihnen die Präzision und das Vertrauen, die Sie benötigen, um in der dynamischen Welt der Finanzmärkte erfolgreich zu sein. MT4-Version   :   WH Range BreakOut MT4 Merkmale: Präzise Entfernungserkennung. Breakout-Signa
MT4 Version Available Here:   https://www.mql5.com/en/market/product/43438   Telegram Channel & Group :  https://t.me/bluedigitsfx V.I.P Group Access:   Send Payment Proof to our Inbox Recommended Broker:   https://eb4.app/BDFXOsprey * Breakthrough Solution For  Reversal  Trading And Filtering With All Important Features Built Inside One Tool! BlueDigitsFx Spike And Strike Reversal is a mixed oscillator that mixes the readings of a number of indicators, which makes it potential to preci
Percentage Levels
Alexandre Borela
5 (7)
Wenn Sie dieses Projekt mögen, hinterlassen Sie eine 5-Sterne-Bewertung. Folgen Sie instagram: borelatech Da die Institutionen große Mengen tauschen, ist es für sie nicht ungewöhnlich, zu versuchen, ihre Position auf bestimmten Prozentebenen verteidigen. Diese Ebenen dienen als natürliche Unterstützung und Widerstand, die Sie verwenden können entweder um einen Handel zu betreten oder sich über mögliche Gefahren gegen Ihre Position bewusst zu sein. Ein Beispiel für einen gebräuchlichen Pr
FREE
Fair Value Gap Scanner
Usiola Oluwadamilol Olagundoye
The Fair Value Gap Detector is a MetaTrader 5 indicator designed to identify and draw rectangles on the chart wherever fair value gaps (FVGs) are detected. Fair value gaps occur when there is a significant disparity between the current price and the fair value of an asset. These gaps can provide valuable insights into potential trading opportunities, as they often indicate overbought or oversold conditions in the market. Key Features: FVG Detection: The indicator utilizes a proprietary algorith
FREE
Introducing the AI Keltner Channel , a cutting-edge Forex indicator that leverages machine learning to dynamically calculate Keltner Channels in real-time. Unlike traditional Keltner Channel indicators, which rely on static inputs, the AI Keltner Channel adapts continuously to ever-changing market conditions, providing traders with a more accurate and responsive view of price trends and volatility. Powered by advanced machine learning algorithms, the AI Keltner Channel analyzes historical and re
FREE
Trend Line1
Zhi Xian Hou
5 (4)
Indicator Introduction: The indicator comes from network ,It is more stable relative to RSI or CCI. You can set the indicator to send emails/notifications/alerts when the previous bar has an up or down arrow, you can specify the text of emails by inputing string into the parameter box of  "UpMessages/DownMessages". It can be used to analyze market trend and design new expert that is based on trend. If the indicator below the axis ,this is a buy zone. The trend indicator is suitable for M1 and ab
FREE

Der MetaTrader Market ermöglicht, Programme für die MetaTrader Plattform sicher zu kaufen. Sie können Demoversionen gewünschter Roboter und Indikatoren direkt im Terminal herunterladen und diese im Strategietester prüfen.

Testen Sie Programme in unterschiedlichen Modi vor dem Kauf, um eine Vorstellung vom Produkt zu bekommen, und bezahlen Sie das Produkt über das Zahlungssystem der MQL5.community.

Mit dem Zahlungssystem der MQL5.community kann man Produkte bezahlen und dank der Möglichkeit, das Produkt vor dem Kauf in verschiedenen Modi zu testen, können Kunden eine Vorstellung vom Produkt bekommen.