Neue technische Indikatoren für den MetaTrader 5 - 30

Gatotkaca Support Resistance Trendline Indicator is a simple indicator that detects support, resistance and trendlines. It will helps you find breakout momentum based on lines calculated by this indicator. This is conceptually based on fractals, but with customizable periods. Compatible for any timeframes. You can customize how this indicator work by setting up the period input.
FREE

В основе индикатора EasyBands лежит тот же принцип, что и при построении Bollinger Band. Однако, данная модификация индикатора использует вместо стандартного отклонения средний торговый диапазон (Average True Range). Соответственно, с данныи индикатором абсолютно аналогично можно использовать все стратегии, которые применяются с Bollinger Band. В данной версии индикатора используется двенадцать уровней и средняя линия (белый цвет). Индикация тренда выполнена в виде окраски свечей в зависимости
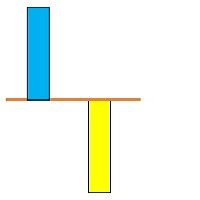
A technical Indicator Providing Price Convergence Signals along with value for experienced and professional traders. Easy to comprehend, Easy to understand.
This is a helping tool provides best signals. This indicator is designed based on the fundamentals of trade. A very good indicator you can customized its color. A best tool to find trade direction.
An adaptive indicator. It constantly adapts to the trade.
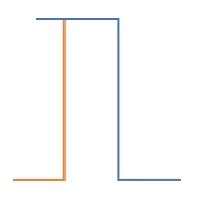
A value indicator for experienced and professional traders. It is helping tool to indicate the direction value gain. A best helping tool to trade value. This indicator is equipped with a colored line and a digital tool to indicate value numerically .
This indicator also helps to indicate value during trends. A study based on this indicator shows value of trade significantly changes during trends best tool to cash the trends.

Best helping tool for Professional and Experienced traders. A best Tool To find the trend. Instruction Manual: First Select your desired Symbol. Then attach this tool and wait till it identify the trend for you. Then it will be more feasible to trade.
Once again best tool to trade. Demo version is available you can fully test its functionality. More importantly there are always trend breaks Once Trend break is observed un-attach this tool and then re-attach to get the fresh trend. Precautions
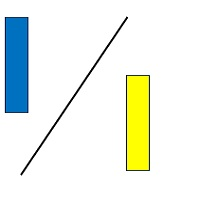
A basic tool for traders to trade percentile of the value. It indicates both values in the for of digits appeared on the left corner of the screen.
Instructions Manual : First choose your desired symbol and then select this tool. Please be remined that this tool is just a helping tool. its upon trader what he chooses. The function of this tool is just to provide a help in trading.

Three Triple Exponential Average oscillators merged into one. Fast period will pull on the slower period, and the slower will smooth out the faster and avoid early positions. You can use 2 fast and 1 slow, or Fibonacci range or 2 slow, 1 fast. NOW FREE. But please consider supporting me by buying my 2 for sale indicators.
You can use this as an entry indicator and exit indicator. Open when the tripleTRIX line crosses the zero line and close when it starts to reverse. When the peaks get bigger,

** All Symbols x All Timeframes scan just by pressing scanner button ** *** Contact me to send you instruction and add you in "123 scanner group" for sharing or seeing experiences with other users. After 17 years of experience in the markets and programming, Winner indicator is ready. I would like to share with you! Introduction The 123 Pattern Scanner indicator with a special enhanced algorithm is a very repetitive common pattern finder with a high success rate . Interestingly, this Winner in

Acceleration Points ist ein leistungsfähiges Tool zur Erkennung kritischer Preisbewegungspunkte, das auf der Idee basiert, die Beschleunigung von Preisschwankungen zu berechnen.
_________________________________
So verwenden Sie die Indikatorsignale:
Der Indikator erzeugt ein Signal, nachdem ein neuer Preisbalken erscheint. Es wird empfohlen, das gebildete Signal zu verwenden, nachdem der Preis des kritischen Punktes in der angegebenen Richtung durchbrochen wurde. Der Indikator zeichnet
FREE

Momentum Reversal ist ein leistungsfähiges Werkzeug, um mögliche Umkehrpunkte zu erkennen und Korrekturen zu starten, basierend auf einer Analyse der Intensität von Preisbewegungen und Barformationen.
_________________________________
So verwenden Sie die Indikatorsignale:
Der Indikator erzeugt ein Signal, nachdem ein neuer Preisbalken erscheint. Es wird empfohlen, das gebildete Signal zu verwenden, nachdem der Preis des kritischen Punktes in der angegebenen Richtung durchbrochen wurde. D
FREE

Correction Breakthrough ist ein leistungsfähiges Werkzeug, um mögliche Breakout-Punkte aus einem Korrektur- oder Handelskorridor zu erkennen, basierend auf der Analyse von Preisformationen und der Trägheit von Kursbewegungen.
_________________________________
So verwenden Sie die Indikatorsignale:
Der Indikator bildet während des aktuellen Preisbalkens ein Signal. Es wird empfohlen, das gebildete Signal nach dem Schließen der Signalleiste oberhalb/unterhalb des Signalpfeils zu verwenden.
FREE

Market Palette ist ein leistungsfähiges Filterwerkzeug für Handelsentscheidungen, das auf Trägheit und Beschleunigung von Preisschwankungen basiert.
_________________________________
So verwenden Sie die Indikatorsignale:
Der Indikator erzeugt Histogrammsignale in drei verschiedenen Farben. Wenn blaue Spalten angezeigt werden, wird empfohlen, nur lange Positionen zu halten, wenn rote Spalten angezeigt werden, nur kurze Positionen, wenn graue Spalten angezeigt werden, und keine Handelsakti
FREE

Points of Inertia ist ein leistungsfähiges Werkzeug zur Erkennung kritischer Preisbewegungspunkte, das auf der Idee basiert, die Trägheit von Preisschwankungen zu berechnen.
_________________________________
So verwenden Sie die Indikatorsignale:
Der Indikator erzeugt ein Signal, nachdem ein neuer Preisbalken erscheint. Es wird empfohlen, das gebildete Signal zu verwenden, nachdem der Preis des kritischen Punktes in der angegebenen Richtung durchbrochen wurde. Der Indikator zeichnet sein
FREE
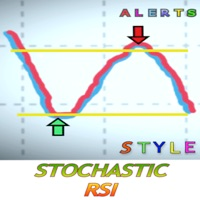
Was ist der stochastische RSI?
Der stochastische RSI (StochRSI) ist ein Indikator, der in der technischen Analyse verwendet wird. Er bewegt sich zwischen null und eins (bzw. null und 100 bei einigen Charting-Plattformen) und wird durch Anwendung der Stochastik-Oszillatorformel auf eine Reihe von Relative-Stärke-Index-Werten (RSI) und nicht auf Standardkursdaten erstellt. Diese Version enthält Warnungen, damit Sie keine wirklich guten Gelegenheiten verpassen. Sie legen den Parameter fest, wann

Market Profile 3 MetaTrader 5 indicator version 4.70— is a classic Market Profile implementation that can show the price density over time, outlining the most important price levels, value area, and control value of a given trading session. This indicator can be attached to timeframes between M1 and D1 and will show the Market Profile for daily, weekly, monthly, or even intraday sessions. Lower timeframes offer higher precision. Higher timeframes are recommended for better visibility. It is als
FREE
TRACKINGLEVELS (SUPPORTS AND RESISTANCES)
TrackingLevels is a useful indicator that saves considerable time when a trader starts analyzing a chart. This indicator draw on the chart all the resistances and supports that the market is creating. The resistance and support levels are very important, this levels define areas where there can be a considerable accumulation of sell or buy orders. These are a key areas that every trader must know and keep in mind all the time. This indicator helps the

The currency strength momentum has a lot of similarities with currency strength meter presented in the previous page, but the difference are much more pronounced. You can try putting both in the same chart and see the difference in results. Currency strength momentum measures strength of a currency based on (you guess it) it's momentum relative to other currencies, while currency strength meter measures the strength of a currency based on pips it has moved in a certain direction.
FREE

** All Symbols x All Timeframes scan just by pressing scanner button ** ***Contact me to send you instruction and add you in "RSI scanner group" for sharing or seeing experiences with other users. Introduction RSI divergence is a main technique used to determine trend reversing when it’s time to sell or buy because prices are likely to drop or pick in the charts. The RSI Divergence indicator can help you locate the top and bottom of the market. This indicator finds Regular divergence for pullba

This indicator combines RSI(14) and ADX(14) to find out the signal that price moves strongly. When it appears signal (represent by the yellow dot), and price is going down, let consider to open a SELL order. Otherwise, let consider to open a BUY order. In this case, the strength of moving is strong (normally after sideway period), so we can set TP by 3 times of SL .
FREE
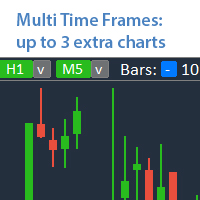
Analyze up to 3 additional charts of other timeframes , without switching the main chart. My #1 Utility : includes 65+ functions | Contact me if you have any questions The indicator opens in a separate window: The window can be moved to any place on the chart (using the [<M>] button). The window can also be minimized to save space ( [ <^>] button) In the window that appears, you can configure: The period of the 1st chart (left);
The period of the 2nd chart (center); The peri

Dabei handelt es sich um einen indikator für trends, der mittels eines rot-grünen realstranges die änderungen des börsenpreises widerspiegelt, wobei eine änderung der realfarbe auf einen möglicherweise umkehrbaren gang des kurses hindeutet, der bereits auf den markt überhand genommen hat. Die grüne linie zeigt marktkurse an, wenn sie im steigen sind, die rote linie zeigt marktkurse an, wenn sie fallen.

本指标 基于 Zigzag 基础上... 增加了: 1.增加了箭头指示,使图表更鲜明 2.增加了价格显示,使大家更清楚的看清价格. 3.增加了报警等设置,可以支持邮件发送 原指标特性: 1.基本的波段指标构型. 2.最近的2个ZIGZAG点不具有稳定性,随着行情而改变,(就是网友所说的未来函数) 3.原指标适合分析历史拐点,波段特性,对于价格波动有一定的指导性.
Zigzag的使用方法一 丈量一段行情的起点和终点 (1)用ZigZag标注的折点作为起点和终点之后,行情的走势方向就被确立了(空头趋势); (2)根据道氏理论的逻辑,行情会按照波峰浪谷的锯齿形运行,行情确立之后会走回撤行情,回撤的过程中ZigZag会再次形成折点,就是回撤点; (3)在回撤点选择机会进场,等待行情再次启动,止损可以放到回撤的高点。 一套交易系统基本的框架就建立起来了。 Zigzag的使用方法二 作为画趋势线的连接点 趋势线是很常见的技术指标,在技术分析中被广泛地使用。 但一直以来趋势线在实战中都存在一个BUG,那就是难以保证划线的一致性。 在图表上有很多的高低点,到底该连接哪一个呢?不同的书上画趋势线的方
FREE

This is a buyer and seller aggression indicator that analyzes the shape of each candle and project this data in a histogram form. There are 4 histograms in one. On the front we have two: Upper - Buyer force. Lower - Seller force. At the background we also have two histogram, both with same color. They measure the combined strenght of buyers and sellers. This histograms can be turned off in Input Parameters. It is also possible to have the real or tick volume to help on this force measurement. IN
FREE

Have you ever wondered which currency is the strongest at any particular time? Or which currency pair is trending the most. Well, the currency strength meter helps with just that. It compares USD , EUR , AUD , CHF , GBP , CAD and NZD depending on the timeline you have chosen in settings, and ranks them on the number of pips each has moved compared to the rest. N/B: All currency charts of the above pairs must have loaded. You can do this by highlighting all major and minor currencies in
FREE

Presentation
Another indicator that makes scalping on tick charts easier, it displays an Heiken Ashi graph in Ticks.
It allows to detect entry points and trend reversals. Recommended number of ticks in a candle : 5, 13 or 21.
Parameters Ticks in candle: Number of ticks in a candle (default 5), Displays Trend arrows : displays a trend arrow based on EMA8 and EMA20 crossing, Displays MM50, Displays MM100, Max Candle (CPU): number of candles max to manage, low value will save ressources of
FREE

Relative Volume or RVOL is an indicator that averages the volume of X amount of days, making it easy to compare sessions volumes.
The histogram only has 3 colors:
Green - Above average volume
Yellow - Average volume
Red - Below average volume
The default setting is 20 days, which corresponds more or less to a month of trading.
In this version is possible to choose between tick and real volumes (if you are using a broker which offers future contracts)
With the data obtaine
FREE

This indicator is very useful in observing the direction of the market. It allows users to enter multiple MA lines with specific display method. In addition, it is also possible to change the candle color same to color of the background of chart, so that we only focus on the MA lines. When a signal appears, represented by a red or green dot, we can consider opening a sell (red dot) or buy (green dot) order. Note: it need to set stoploss at the highest value of MA lines (with sell order) or lowe
FREE
Divergence is one best ways to trade the financial market as it is a leading indicator of price action that detect high probability reversal and continuation setups. The AlgoKing Divergence Detector is an RSI and Stochastics Indicator with Divergence Detection. Features Hidden Divergence for trend continuation. Standard or Normal Divergence for trend reversal. Screen Alerts. MetaQuotes Notifications. Email Notifications. RSI Indicator built in. Stochastics Indicator built in. Types of Divergen
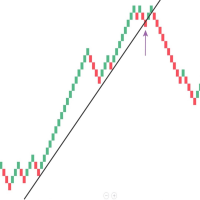
Mean Renko Bars are used for alternate price charting. Unlike the usual time framed chart – where every candle represents a fixed time interval – the goal of Renko chart is to display price movement in increments, called bricks. Best with the momentum strategies. Can make some Algo with this candel ---- ---- ---- ---- ---- ---- ---- ---- ---- ---- Support: primecapitalvn@ gmail. com

BPS BoS - Break of Structure
BoS - Fractal mode , MTF
BoS - Zigzag mode , MTF
Show HH and LL
Alerts - Popup , Push notification and eMail Option to create screenshot on alert Enable / Disable Indicator with a button on chart to select options
Choose corner of button location
It is not a system but a indicator to help identify break of structure points
MT 4 Version : https://www.mql5.com/en/market/product/78420?source=Site+Profile+Seller Other Indicators : https://www.mql5.com/en/use

Geschwindigkeitswiderstandslinien sind ein leistungsfähiges Werkzeug zur Bestimmung von Trend- und Widerstandslinien. Der Indikator baut Linien mit extremen Grafiken und speziellen mathematischen Formeln. Der Indikator kann verwendet werden, um die Trendrichtung und die Umkehrpunkte zu bestimmen.
<---------------------------->
Parameter des Indikators:
"Depth of search" - die Tiefe (in Bars) der Suche nach den Extremen des Graphen "Back step of search" - der Mindestabstand (in Bars) zwisc
FREE

Shift Trend is an indicator of the formation of entry signals, entry points. The indicator must be selected to work for a sufficiently short period of time. But who works in short ranges, then this indicator is well suited.
Options: Length1 - The first parameter. Length2 - Second parameter; PointActivity - Parameter controlling peak levels. PointMinDist - The parameter that sets the minimum distance. AvgLengthBar - Bar averaging.

Identification of support and resistance areas
A useful indicator for traders
completely free
Can be used in all symbols
Can be used in all time frames
It has three different trends: short term, medium term, long term
Settings:
Clr1,2: You can change the color of the lines
Type Trend: You can determine the trend
Message me for questions, criticism and suggestions
FREE
The new Royal Prince Master Non-Repaint Indicator MT5 has two control points ? What does this mean it allows you to use two different indicators to cross to see to find your signals, those two indicators also can be customized just like if you were to load them individually on a chart.
Want to see the indicator in action check the youtube video.
ALSO IT HAS ALERTS !!!!!
List of Different indicators to choose from :
1) Moving Average 2) Moving Average Convergence/Divergence 3) O

Overlay indicator on chart between 2 pairs
The Timeframe Overlay indicator displays the price action of timeframes on a single chart, allowing you to quickly assess different timeframes from a single chart. The advantage is to observe and follow the correlations of price movements in real time to help you find potential trades at a glance.
---- Symbol 1 ----
Symbol = EURUSD
Correlation Inverse = false
Display = true
Ratio
FREE

Volality Index scalper indicator Meant for Volality pairs such as Volality 10, 25, 50, 75 and 100 The indicator works on all timeframes from the 1 minute to the monthly timeframe the indicator is non repaint the indicator has 3 entry settings 1 color change on zero cross 2 color change on slope change 3 color change on signal line cross Orange line is your sell signal Blue line is your buy signal.

This indicator provides common shapes as drawing object options. The shapes are rotatable, resizable, draggable, and will keep their proportions (according to their handle trendline) across different chart scales. Multiple drawings are supported.
Shapes: Square Rhombus
Triangle (quadrilateral & isosceles) Circle (grid, overlapped grid, flexi grid, rotatable grid, concentric circles) Features: rays (all object edges will be rays) show/hide each individual drawing type, or all delete last drawn
FREE

AlgoKing Chandelier Exit Indicator (MT5)
The Chandelier Exit Indicator is a volatility based indicator that maximizes returns using the Average True Range (ATR) value and the highest high or lowest low of a period. Benefits Should be used as a trailing stop. Helps you exit a position when you have a respectable profit. Identifies a high probability of a trend reversal when the price moves against the prevailing trend by a distance equal to 3x the average volatility. Join the AlgoKing Lightning

Diagnosis of major and minor pivot
Trend detection
with many signals
Can be used in all symbols
Can be used in all time frames
Settings:
Back Show: The number of candles it displays
If you need any adjustments, or have any questions or suggestions, message me
How to trade:
Blue: sell signal
Red: buy signal
Blue and red at the same time: no signal
Exit signal: Opposite signal

Forecasting the future by combining trend and average price
with many signals
Can be used in all symbols
Can be used in all time frames
Settings:
BackShow: The number of candles displayed
Osi: Main setting, the larger the number, the longer the trend
If you need more settings, or have any questions or suggestions, message me
How to trade:
Blue: sell signal
Red: buy signal
Blue and red at the same time: no signal
Multi-Timeframe Chart Overlay Indicator
The Timeframe Overlay indicator displays price action for multiple timeframes on a single chart, allowing you to quickly assess different timeframes from a single chart. The advantage is to observe and follow the correlations of price movements in real time to help you find potential trades at a glance.
---- Symbol 1 ----
Symbol = EURUSD
Correlation Inverse = false
Display = true
Ratio

Ein sehr einfacher Indikator. Es zeigt die Richtung des Handels an und liefert Signale für beste Geschäfte. Das Signal bezieht sich hier auf einen Punkt auf dem Diagramm, an dem sich die Indikatorlinie in ihre Richtung dreht oder konvergiert. Dieser Indikator findet die Richtung des zugrunde liegenden Assets und zeigt die besten Szenarien von Trades an, wie in Screenshots beschrieben. Wo es für eine Instanz von Zeit gelaufen ist und zu Best-Deal-Szenarien konvergiert.
Ein guter, einfacher, lesbarer und praktischer Indikator. Es gibt begrenzte Signale zwischen Null und Eins. Für Anleger leicht verständlich. Es gibt Anlegern einen nahen und längeren Handelsausblick und hilft ihnen, gute Gelegenheiten zu finden. Der Indikator gibt ein Nullsignal bei Preisrückgängen und einen Signalwert von eins bei Preisaufschwüngen. Wieder eine neue Art von Indikator und Rangebound zwischen Null und Eins.
Eine neue Art von Indikator. Speziell für die Trenderkennung entwickelt.
Ein großartiges Instrument für Anleger, um zum richtigen und geeigneten Zeitpunkt für einen anständigen Handel zu investieren.
Sie können es Ihren potenziellen Kunden und Kunden zu ihrer Zufriedenheit präsentieren. Ein sehr praktisches und trendiges Werkzeug. Einfach zu lesen, zu verstehen und benutzerfreundlich.
Mit diesem Tool können Sie leicht die potenziellen Punkte für den Einstieg in den Handel und die niedrigen
FREE

Free version of the TickScalper indicator. The Tick Scalp indicator is a trading assistant for a scalping trader. Works in a separate window. Tracks the momentary activity of the market, shows the graph of the movement of ticks and the strength of bulls or bears. Sometimes it can anticipate the beginning of a strong movement before any other indicators. Helps the trader to make a decision to open the desired order. Designed to work on any instrument. Used timeframes from M1 to M15. Has simple a
FREE

!! FLASH SALE !! Over 80% off !! For ONE week only. Now only $47 - normally $297! >>> Ends on 30 June 2023 - Don't miss it!
Buy and Sell Arrows On The Chart According To Price Action Sends Alerts On MT5 To Your Phone To You Email
Does NOT repaint. Works on any pair, any timeframe.
10 Activations allowed so you are free from limitations. MT4 Version here . For spreads from a tiny 0.1 pips RAW/ECN Accounts, click here . Check out my Waka Esque EA signal here: >> High Ri
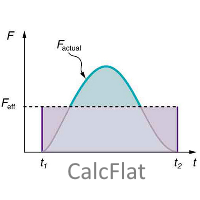
CalcFlat is a flat indicator.
At first glance, a simple indicator, but if you look at the screenshots for people who are not specialists, it may seem that the indicator is not very informative. But in fact, the indicator is very informationally active. It needs to be adjusted for each instrument and each timeframe. Very flexible in the settings there are two key settings, but they can significantly change the results of the display of the indicator. In addition to the main histogram, the indi

Auto Fibo Expansion is an indicator that projects the Fibonacci expansion levels above and below the opening price of the day. It does the calculation based on the previous day and projects the levels on the current day. It is very efficient to find "psychological" zones of support and resistance. Its appearance is all configurable and you can set up to 30 different levels. Enjoy! This is a free indicator, but it took hours to develop. If you want to pay me a coffee, I appreciate a lot <3 PayP
FREE

Do you like trade Technical Analysis like I do? Then you will like this indicator, because it automatically calculates the support and resistance of the asset in simultaneous timeframes, or the famous MTF (Multi Time Frame). In addition to support and resistance, it is possible to have alert signals when the price breaks or touches (or both). Its configuration is very simple. The visual is fully configurable. Enjoy it!
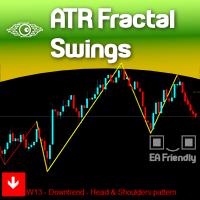
The concept of Fractals is everywhere in the respected Technical Analysis teaching and for a good reason: It Makes Sense! It is not a "self-fulfilling prophecy" like Fibonacci levels which we totally respect but we didn't explore yet, but this concept of Fractals can only be seen visually on your chart if we really SHOW that to you on your chart, right?
There are dozens of Zig-zag and Swing Legs indicators out there so you probably would be wondering: Why our indicator is different? Because we

Here is the boom and crash crazy Ma scalper a secretly coded color MA that is 1000% NON-REPAINT Works best on boom and crash 1000 Can be used on all timeframes from the 1 Minute timeframe to the Monthly timeframe The indicator is also a multi-time frame indicator you can select which timeframe to use The indicator is made for scalping purposes. as the trend changes the color of the indicator changes all well

HEIKEN PLUS is the only indicator you really need to be a successful trader , without in depth knowledge of the forex trading or any tools.
Also there is automatically trading EA available now: https://www.mql5.com/en/market/product/89517? with superb SL/TP management! and sky high profit targets !!!
Very suitable tool for new traders or advanced traders too. This is MT5 version. For MT4 version visit : https://www.mql5.com/en/market/product/85235?source=Site
HEIKEN+ is a combination o

Numa folha qualquer
Eu desenho um sol amarelo
E com cinco ou seis retas
É fácil fazer um castelo
Corro o lápis em torno da mão e me dou uma luva
E se faço chover com dois riscos, tenho um guarda-chuva
Se um pinguinho de tinta
Cai num pedacinho azul do papel
Num instante imagino uma linda gaivota a voar no céu
Vai voando, contornando
A imensa curva norte-sul
Vou com ela viajando
Havai, Pequim ou Istambul
Pinto um barco à vela
Branco navegando
É tanto céu e mar num beijo azul
Entr
FREE

Kerzenzähler Dieser Indikator zählt Kerzen und zeigt ihre Anzahl basierend auf einem längeren Zeitraum an Langer Zeitraum Sie können den täglichen Zeitrahmen als " Bigger Timeframe " auswählen und ihn auf dem Chart mit dem kleinsten Zeitrahmen ausführen. dass der Zähler die Balken gemäß dem Tages-Chart zählt. Wenn Sie den Zeitrahmen " H1 " als Parameter übergeben, weiß der Indikator, wie Balken im H1-Diagramm zu zählen sind, er muss ihn nur auf Diagrammen mit kleineren Zeitrahmen ausführen. Der
FREE

MASpeed ist ein universeller gleitender Durchschnitt mit einer Geschwindigkeitsanzeige. Punkte auf einer Linie erscheinen, wenn sich der Durchschnitt schneller als der Schwellenwert bewegt. Sie können den Schwellenwert in den Einstellungen festlegen. Auf der Grundlage dieses Indikators können Sie eine Vielzahl von Handelsstrategien erstellen. Der Indikator bietet enorme Möglichkeiten zur Anpassung des gleitenden Durchschnitts - 10 Arten von Glättung. 12 preisoptionen für den Aufbau. Es wurde die
FREE
Dieser Indikator basiert auf Spitzbogenformen. Solche Formen werden in der Aerodynamik und Raumfahrttechnik verwendet. Sogar Kugeln haben eine Art Spitzbogenform. Die Verwendung solcher Formen in einem technischen Indikator ermöglicht es, einen Kompromiss zwischen der Empfindlichkeit des Indikators und seiner Stabilität zu erreichen. Das gibt zusätzliche Möglichkeiten bei seiner Anwendung. Indikatorparameter: iType - der Typ der Spitzbogenform. iPeriod - Indikatorperiode. iFactor ist ein

Gleitender Durchschnitt des Entfernungspreises
Dies ist ein Indikator, der in Echtzeit den Abstand vom Preis zum gleitenden Durchschnitt berechnet.
Damit können Sie die maximale Abweichung des Preises vom gleitenden Durchschnitt in einem bestimmten, von Ihnen gewählten Zeitraum überwachen, beispielsweise die Distanz gemäß der maximalen Abweichung der letzten 30 Tage überwachen.
Es ist möglich, den Zeitraum und die Art des gleitenden Durchschnitts zu wählen.
Um es noch besser zu machen
FREE

Excellent tracking performance and minimal noise! This trend detection indicator that avoids whipsaws and uncertain market noise and is also agile enough to react to changes in trend.
It is also designed to adapt to dynamic markets.
Functions mainly as a filter to help you trade in the direction of the trend.
Features.
Simple and easy to use. Low load and easy to try out The excellent tracking performance and smooth lines that make it ideal for market analysis Can be used as a trend filter
FREE

Volality 75 Fractal Scalper Non-repaint The arrows appear on the current candle. momentum and trend based strategy Works on all timeframes from the 1 Minute to the Monthly timeframe Bollinger bands have been added to show the trend direction whether its bullish or bearish Blue fractal arrow is your buy entry Orange fractal arrow is your sell entry you can use the Vix 75 fractal scalper in combination with other indicators.
The indicator plots the Up and Down arrows on every price swing made by the classic Zigzag indicator. When Zigzag makes a new swing low, a green arrow is plotted. Likewise, a red arrow is plotted when Zigzag makes a new swing high.
Features
Compared to the classic ZigZag, it marks the swing points more effectively. It helps to identify the forming chart patterns in advance. It comes with a Multi-Timeframe scanner which shows the Zigzag direction on each timeframe. All Metatrader alerts includ

This indicator shows the bullish/bearish market regime using the no. of bars moved above and below the overbought/oversold region of RSI. The green histogram depicts the Bull power, while the red depicts the Bear power.
Features
It can be used to enter new trades or validates trades from other strategies or indicators. It comes with a multi-timeframe scanner that scans the bulls/bears power across all the time frames. It's a perfect choice to boost the confidence of new traders via validatin
The indicator measures the buying and selling force between the buyers and sellers in the form of a histogram/oscillator by using a BOP equation:
BOP = Moving Average of [close – open)/(high – low)]
Igor Levshin first introduced the Balance of power in the August 2001 issue of Technical Analysis of Stocks & Commodities magazine.
Features
Quickly find the buying and selling pressure among the traders. It comes with simple inputs and an interface. All Metatrader alerts included.
Appli
SSL stands for Semaphore Signal Level channel. It consists of two moving averages applied to high and low, respectively, to form a price following envelope. Buy Signal: When the price closes above the higher moving average. Sell Signal: When the price closes below the lower moving average.
Features It comes with a multi-timeframe scanner that scans for the new signals across all the timeframes. A straightforward personal implementation of the classic SSL effortlessly finds the trend directio

Back to the Future это индикатор который определяет направление тренда. Определяет четыре уровня для роста и падения 1-й уровень флета 2 -й уровень коррекции 3-й уровень продолжения тренда и 4-й уровень возможного разворота. Индикатор рисует трендовые линии краткострочного и долгострочного тренда. Так же индикатор определяет динамические сел и бай зоны в виде прямоугольников. От ближайшего максимума или минимума рисует фибо уровни для определения целей движения. В меню индикатора отключа

It's a modified, and improved version of the classic HMA developed initially by Alan Hull in 2005. It uses a combination of three weighted moving averages to reduce the lag. Long Entry: When HMA turns blue from red with an upward slope. Short Entry: When HMA turns red from blue with a downward slope.
Features It comes with a multi-timeframe scanner which scans for the new signals across all the timeframes. HMA reduces lags which usually come with the traditional moving averages. Effectively

The worktime indicator helps you identify the most important times to day to trade the currency pairs. It was created based on the ICT day trading free tutorials that are freely vailable on his youtube channel. You can use this indicator together with my other indicators that i have shared freely with you like the true day, custom periods, daily month, weekly open lines - they together complement each other very well.
Nuggets from this indicator: 1. Draws the asian session box showinng you th
FREE
The Higher timeframe candle tracker is used to get a glimpse of what the selected higher time frame candle is like. It plot the candle after the current price. It can come in handy for day traders and short term traders that often worry about how the current higher timeframe candle may look like. You can select the higher time frame or lower time frame from the options provided: By default the color for bears is red and for bulls is green. You are able to change the width of the candle, its wick
FREE

Trend Panel ist ein einfaches, praktisches Tool, das eine bestätigte Trendrichtung der Zeitrahmen M1 - D1 unter Verwendung von zehn vom Benutzer ausgewählten Paaren anzeigt.
Der Indikator ist so konzipiert, dass er jeder Strategie/Vorlage eine Richtungsbestätigung hinzufügt und dann auch als saubere interaktive Schnittstelle funktioniert, um den Chart schnell auf ein anderes Paar oder einen anderen Zeitrahmen zu ändern. Gruppenchat: https://www.mql5.com/en/users/conorstephenson Bitte kontakt
FREE

Dieser Indikator verwendet die sogenannten "bösen" Zahlen als Gewichtskoeffizienten. Ihr Gegenteil sind "abscheuliche" Zahlen, die auch in diesem Indikator dargestellt werden. Die Unterteilung von Zahlen in diese beiden Klassen ist mit dem Hamming-Gewicht verbunden, das durch die Anzahl der Einheiten in der binären Schreibweise einer bestimmten Zahl bestimmt wird. Die Verwendung dieser Zahlen als Gewichtungsfaktoren ergibt einen Trendfolgeindikator. Darüber hinaus geben abscheuliche Zahlen eine

WA_PV_BOX_EFFORT X ERGEBNIS für MT5 Der WAPV Box Effort x Result Indicator ist Teil der Package Indicators-Gruppe (Wyckoff Academy Wave Market). Der WAPV Box Effort x Result Indicator für MT5 hilft Ihnen beim Lesen von Preis und Volumen. Seine Lektüre besteht darin, bei der Identifizierung von Aufwand x Ergebnis zu helfen in Wellen, die durch den Graphen erzeugt werden. Der WAPV Box Effort x Result Indicator für MT5 bedeutet, wenn das Kästchen grün ist, dass das Volumen der Nachfrage entspricht,
Der MetaTrader Market ist eine einzigartige Plattform für den Verkauf von Robotern und technischen Indikatoren.
Das Merkblatt für Nutzer der MQL5.community informiert Sie über weitere Möglichkeiten: nur bei uns können Trader Handelssignale kopieren, Programme bei Freiberuflern bestellen, Zahlungen über das Handelssystem automatisch tätigen sowie das MQL5 Cloud Network nutzen.
Sie verpassen Handelsmöglichkeiten:
- Freie Handelsapplikationen
- Über 8.000 Signale zum Kopieren
- Wirtschaftsnachrichten für die Lage an den Finanzmärkte
Registrierung
Einloggen
Wenn Sie kein Benutzerkonto haben, registrieren Sie sich
Erlauben Sie die Verwendung von Cookies, um sich auf der Website MQL5.com anzumelden.
Bitte aktivieren Sie die notwendige Einstellung in Ihrem Browser, da Sie sich sonst nicht einloggen können.