Kostenpflichtige Handelsroboter und Indikatoren für den MetaTrader 4 - 87

Everlasting Grid Expert Advisor is a grid scalping robot and is able to work with any currency pair on M15 timeframe (currencies with lower spreads are preferred). It uses Moving Averages to find trend and place orders. If it is a false signal, the robot places a recovery grid orders to recover the losses. All the positions are closed when it reaches the target profit defined in settings.
Requirements Optimized to work on EURUSD M15. Minimum recommended deposit is $3000. An ECN broker with low

Der Crossover Action Expert Advisor ist ein fortschrittliches Tool zur Automatisierung einer der beliebtesten Handelsstrategien, der Moving Average Crossover Strategy . Mit seiner intuitiven Benutzeroberfläche und leistungsstarken Funktionen vereinfacht dieser Fachberater die Komplexität des manuellen Handels und führt Geschäfte automatisch auf der Grundlage von gleitenden Durchschnittsüberschneidungen aus. Eines der Hauptmerkmale dieses Fachberaters ist sein ordnungsgemäßes Risikomanage

The indicator has the following features Predictive Trend (Histogram) - it uses an advanced predictive probability and statistics calculation plus linear regression to know the possible trend. This must be used with at least 3 timeframes for a more accurate reading of the trend: D1, H4, H1. In some cases (subjective), you may want to use M5 for a more precise reading. Velocity (Dotted Line) - Green dotted line indicates a speed of price movement upward. Red dotted line indicates a speed of price
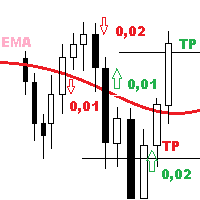
UniMartin is a universal Expert Advisor combining trend strategies, grid and martingale. The EA trades in the trend direction, making decisions based on the MA indicator (at least TrendBars amount of bars should closer for a trend to appear). If averaging is necessary, the minimum step is set for the EA. The decision on the need for averaging is made based on original methodology for determining the market volatility (the CoeffOfVolatMarket parameter can be changed from 0 to 10 with any intermed
The Expert Advisor calculates the divergence on the current and higher timeframes. In case the divergences coincide, the EA starts its operation. Deals have strict take profit and stop loss levels. Each deal is managed by trailing stop. The strategy involves the use of a tight stop-loss. Therefore, losing deals and/or series of losing deals are not uncommon. This EA is not suitable for those who have difficulties coping with losing deals. The EA is recommended for simultaneous use on the followi
MartinTrend trades in the market every day at certain times. To determine the trend direction, it uses a built-in original indicator on the specified number of bars of the current chart timeframe. After opening a trade, it either opens additional orders with decreased lot sizes, or averaging orders with an increase in the lot. It uses a risky martingale strategy with a constant coefficient of 2 both for decreasing the lot for additional orders and for increasing the lot for averaging. To reduce
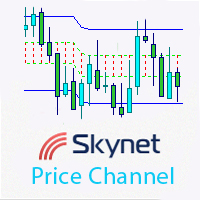
This indicator displays an equidistant price channel, identifies short-term trends and automatically finds the best levels for the upper and lower borders of the channel. It is optimized for major timeframes and currency pairs.
Advantages visualization of short-term trends automatic setting of upper and lower channel borders suitable for scalping strategies based on a rebound from the channel borders
Parameters smooth - border smoothing coefficient. The default value is 1; pricetype - use Op

This grid Expert Advisor uses signals based on breakout of waves by R.N. Elliott. The operation principle of the Expert Advisor lies not only in accumulating positions against the trend (as all grid EAs do), but also along the trend (the principle of turtles). The unique risk control system manages the entire process from opening the grid of order to closing it. The risk control system consists in determining the critical level of lot accumulation in one direction. When a critical event occurs,

The KFX PATTERN manual Expert Advisor is a price pattern based System. Manual stands for the fact that he does not open trades independently. Only shows the individual levels with the profit target. The individual strategies are based on those of Thomas Bulkowski's books. The following Patterns have been integrated: Three Falling Peaks. Three Rising Valleys. Diamond Pattern. High and Tight Flags. Cup with Handle Pattern. Horn Top. Horn Bottom. Earnings Flag. Three Line Strike. Falling Three Meth
This multifunctional Expert Advisor has been created in the form of a designer and is suitable both automatic and manual trading. Its main advantage is the ability to select and adjust the strategy for the current market conditions. To recover from the drawdown, the EA fully utilizes the feature of the currency market - the price cannot remain in a narrow channel for a long time. A breakout of the flat in one direction or another is inevitable. So, by placing orders in the breakout direction, yo

The KFX High and Tight Flag pattern Indicator is part of the KFX Pattern manual Expert Advisor. The indicator shows the entry level (breakout) with the profit target and the stop loss. The strategy is based on Thomas Bulkowski's book, Encyclopedia of Chart Patterns second edition. High and tight Flags are the best performing Chart Pattern in both Bull and Bear markets. They are perfect pattern for trend following. Suitable for every Currency pair, Options, Commodities, Stocks, Indicies and Timef

This indicator visualizes the intersection of two moving averages. (SМА, EMA, SMMA, LWMA). It has been created for visibility of signals and notification about intersections of Moving Average. Moving Average is simply the averaged value of the price for the selected timeframe (TF).
Therefore, the moving averages are used on a wide variety of timeframes, from 1 minute to a year and even decades.
Possible types of moving averages in the indicator SMA (Simple Moving Average); EMA (Exponential Mo

One of the main goals in the development of this Expert Advisor was ease of use. As a result, this EA has a minimum of parameters, which are easy to understand. At the same time, it is very flexible and customizable for almost for any instrument (currency pair).
The logic According to the given algorithm, the EA determines local support and resistance levels (at startup, the previous quotes are disregarded). When a candle closes beyond any level, a deal is opened in the opposite direction, exp

This indicator calculates the strength of the major currencies (EUR, USD, CAD, GBP, CHF, NZD, USD, JPY) and shows the top 4 strongest currency pairs that are currently in a high probability trend for the day or for the week.
Usage The indicator displays 8 currency pairs with a trend direction (e.g. "EURUSD-DOWN") and ranked according to strength, with 1 being ths strongest. There will be 4 pairs for intraday and 4 pairs for intraweek If a currency pair is present in the top 4 intraday, it is i
Aggressive intraday scalper is a mechanical system for intraday scalping, which displays trade opening and closing signals as arrows on the chart. When a signal emerges, the indicator sends email and push notifications. So, you don't have to stay by the monitor analyzing the market and waiting for a signal. Aggressive intraday scalper will do it for you. The system has been developed for those traders who do not have their own trading system and who would love to quickly start trading using the

This indicator shows the levels and signal dots of the Doji pattern. The indicator allows traders to easily determine possible location of a price rebound. Doji is a candlestick with Open and Close price equal, or almost equal. It should also have shadows of approximately the same size on both sides. Doji denotes the balance between buyers and sellers, or the absence of major players, or level testing. This pattern can mean both a reversal and a continuation of the trend.
Indicator Parameters

Magic Hedging is based on the hedging technique. The Expert Advisor tries to enter the market at the beginning of a trend. If the price moves in the unfavorable direction, Magic Hedging attempts to recover losing trades. It restores loss-making positions and tries to make them profitable by opening an opposite position with an increased lot. This opposite order can have a multiplied lot or a plus lot.
Requirements and recommendations Deposit min 10.000$ or optimal cent account Leverage 1:500 S

The Tequila Sunrise (TSR) makes “buy” trades on the USDMXN during morning times of high volumes. The EA uses a combination of the Stochastic Oscillator, Force Index, and a price action algorithm across different timeframes to determine whether or not it takes a trade each particular day. Instead of a take profit target, the EA uses an algorithm to determine when to close the trade. It is designed to run on the 5 minute charts on a daily basis.
Parameters Magic Number : This is a unique identif
The Roll indicator is designed for finding local extremes and determining the current trend. The indicator is based on the volume and volatility values. Indicator calculation can be modified by activating the Modification parameter and choosing one of the available calculation options from CalcMode . To be able to determine current trend using this indicator, you should increase the value of the OsPeriod parameter and decrease the values of DynamicLevelPeriod and ShiftDynamicLevel . The indicato
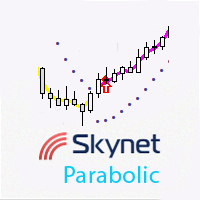
This indicator displays the entry points for buying and selling, with additional push notifications. It is based on the classic Parabolic SAR indicator, price smoothing model and certain mathematical methods for a greater variability in finding market entry points.
Advantages Fewer wrong entries compared to the use of classic breakout and trend confirmation indicators. Signals are not redrawn. A large number of customizable parameters. Visualization of the bullish and bearish trend. Used for i

Determining the current trend is one of the most important tasks for a trader regardless of their trading style. Linear Trend can help you with this task. Linear Trend is a trend determining indicator, which uses an original calculation algorithm. The indicator is suitable for any currency pair and timeframe. It does not change its readings. The product applies three methods selected by a certain parameter and an additional modification of results. Due to the variety of settings and filters, the

The indicator displays market entry arrows based on RSI, MFI, DeMarker, CCI and Multi Stochastic.
Inputs period — values of all indicators used. Enable_Alert — audio and text notifications on a trend change. Send_Notifications — push notifications to mobile devices. E-mail alert — email notifications. Make sure to configure email parameters in the terminal settings.
Features The indicator does not repaint. The indicator does not recalculate. The indicator works on all timeframes. The indicat
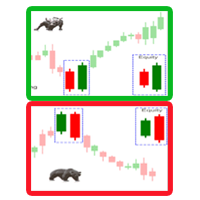
A trend reversal indicator based on the Candlestick Pattern. A candlestick pattern is a movement in prices shown graphically on a candlestick chart that trader can predict a particular market movement. Engulfing Pattern: A reversal pattern that can be bearish or bullish, depending upon whether it appears at the end of an uptrend (bearish engulfing pattern) or a downtrend (bullish engulfing pattern). The Engulfing Of Sparta indicator is an improved variant of the Candlestick Pattern, which shows

Sidus Der Indikator ist eine Handelsstrategie. Basierend auf 3 Standardindikatoren: zwei gleitenden Durchschnitten (MA) und einem Index relativ zur Stärke (RSI). Die Signale des Indikators sind das Überqueren der gleitenden Durchschnitte und die gleichzeitige Positionierung des RSI-Indikators relativ zum Niveau von 50. Liegt der schnelle Durchschnitt über dem langsamen gleitenden Durchschnitt und der RSI-Indikator über dem Niveau von 50, wird von Käufen ausgegangen. Liegt der Fast Moving Avera
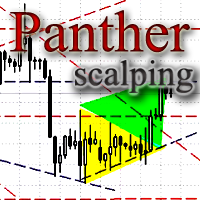
The Expert Advisor looks for technical analysis patterns formed on the higher (hourly) timeframe to start working on the 5-minute chart. Technical analysis patterns used: double top/double bottom, head/shoulders, flag, expanding/narrowing triangles. The Relative Vigor Index technical indicator is used as the filter for opening deals. It is based on the idea that on the bull market the closing price is, as a rule, higher, than the opening price. It is the other way round on the bear market. This

This is a simple indicator to show if global and local trend directions are the same. It uses two timeframes, a "local" timeframe and a higher order "global" timeframe. The indicator shows price action only and has no lag. It generates a square wave (green line), the output signal is above zero if the price tendency is bullish upward, and below zero for bearish downward tendency. The red line shows the tendency of a higher order timeframe (the global tendency). The idea is to trade long when pri

Der technische Indikator „Currency Strength 7“ ist ein leistungsstarkes Tool, das Händlern dabei hilft, die Stärke der sieben beliebtesten Währungen einzuschätzen. Durch die Analyse der Stärke von AUD, USD, EUR, GBP, JPY, CHF und CAD liefert dieser Indikator wertvolle Einblicke in die Währungsdynamik. Es stellt die Währungsstärke im Diagramm anhand von Linien dar, sodass Händler die relative Stärke verschiedener Währungen schnell beurteilen können. Eines der herausragenden Merkmale dieses In
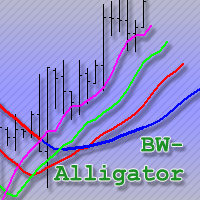
An improved version of the classic Alligator indicator by Bill Williams.
Description The Alligator technical indicator is a combination of moving averages (balance lines). Blue line (Alligator Jaw) is a 13-period smoothed moving average, shifted by 8 bars into the future; Red line (Alligator Teeth) is an 8-period smoothed moving average, shifted by 5 bars into the future; Green line (Alligator Lips) is a 5-period smoothed moving average, shifted by 3 bars into the future; Purple line (Fast Gat

The main goal of the indicator is to determine the most optimal points of entry and exit from a trade. The indicator consists of three parts. The first one is arrows displaying the most efficient market entry/exit points. The up arrow is a buy signal, the down arrow is a sell one. The indicator contains an analytical analysis algorithm that includes a set of standard indicator readings, as well as a custom algorithm. The second part is data in the upper right corner (works on М1-D1 timeframes) o

The Master Pivot indicator is a very interesting generator of static levels based on historical percentage variation. The levels are completely customizable changing the input numbers. Period can also be modified to select the preferred Time Frame. The color is flexible so you can change color easily, we recommend a red color upper and lower green for a contrarian style, conversely instead for a style follower trend. This indicator used in a confluent way offers some really interesting ideas.

This indicator displays the short-term trend direction and flat areas in the same way as the classic Heiken Ashi indicator, but it is not plotted using candles or a moving average, but rather the Skynet Moving Average indicator.
Advantages no delay, or a slight delay when using the 'smooth' parameter. customizable parameters for any price data and timeframes. visualization of the flat and the short-term trend. unlike the classic Heiken Ashi indicator, the frequency of candles changing from bul

The indicator displays potential entry points on a trend, displaying buy level, sell level and golden point which will determine where to get out of the trade or trail your stops. If an entry is detected, the indicator shows and Arrow, either pointing down for Short and up for Long positions. When the golden point is passed during a trade, it will start drawing potential points for trailing, is then up to you how to manage your trade. This indicator has been built for best results on H1 Time fra
Buy or rent it and request a copy of the Antimartingale EA for free Trendline based utility, you design your trendlines or horizontal lines, the EA opens trades for you Possibility to trade on break and/or bounce events Indipendent break and bounce settings Configurable market, stop and limit orders T1T2 Logic to lock profits and minimize losses Trailing Stop Loss Max Spread check Notifies you when your trendlines are crossed No strange trendline name or syntax, you decide the color of tr
The algorithm of this Expert Advisor determines the significant price levels, where the trend often turns into a flat or reverses. Stochastic Oscillator serves as an additional filter of overbought/oversold zones. The EA sets stop loss and take profit after opening an order. The underlying trailing strategy applies a trailing stop. The EA is recommended for simultaneously use on three trading instruments: EURUSD M5, GBPUSD M5, EURCHF M5. Settings:
Comment to order - comment to orders. MaxRisk -

xCalper Triad works as a Target scanner tool. Its algorithm calculates price level areas with high precision and instantly. By default, they are automatically identified and the trader normally sets visual parameters only. Explore a new perspective in price action analysis by adding Triad to your setup and surprise yourself.
Main Features Automatic & exclusive Target levels Daily candle representation in all intraday timeframes. Side panel information essential to all traders: Remaining time t
A trend indicator based on the Ichimoku Kinko Hyo and Candlestick. The Scanner Trend Indy is an improved variant of the Ichimoku Kinko Hyo and Candlestick, which shows the moment of trend following quite accurately. It is often used as a signal filter. Combination of two indicators makes a better use of these advantages: Ichimoku Kinko Hyo identifies the trend, while Candlestick determines the short-term movements and signals in the trend direction.
Messages/sounds (notifications and sound set

Fibo Reversals is an indicator which has carefully been put together to attempt to indicate a time period in which an ongoing trend is most probably exhausted and a new trend (actually a reversal trend) inadvertently begins. At this, it should be okay for the manual trader to be on the look out for good trading opportunities.
Input Settings Father Fibo – This Input Determines The Highest Price For The Chosen Input Period. Son Fibo - This Input Determines The Lowest Price For The Chosen Input

Nutze automatische Exits, setze Orders in Abwesenheit oder beschleunige das Trading. Das und vieles mehr kann der Trading Assistent. Einfach zu händeln und übersichtlich, bearbeitet er problemlos eine oder mehrere Orders.
Merkmale Terminierung von Pending- und Marketorder - hilfreich für zeitbasierende Strategien oder um eine Order vorzubereiten wenn der Markt geschlossen ist Automatisch Stop zum Break-Even Point für die Positionssicherung - diese kann somit unbeaufsichtig bleiben Selbstständi

The support and resistance levels are among the main components of the entire technical analysis. They are used both by professional traders and by beginners. Prices usually move within the price channels. The upper boundary of such a channel is called resistance, and the lower one is support. This indicator plots fractal support and resistance lines at the highest and lowest local price values (fractals).
Distinctive features Does not redraw. Clear and understandable signals. It is possible t

This Expert Advisor is based on the Money Flow Index (MFI) and using a trend-based trading strategy. The Money Flow Index used to evaluate oversold and overbought market conditions. MFI values of 80 and over indicate overbought conditions, meanwhile, values of 20 and below indicate oversold conditions. In addition, if the MFI is below ( Buy_MFIBelow ) and not above the overbought level , it indicates the buy signal. On the other hand, if MFI is above ( Sell_MFIAbove ) and not below the oversold

Algorithm of this system is based on Bill Williams' Alligator indicator . This represents the Jaw, the Teeth and the Lips of the Alligator. It was designed to help confirm that a trend is in effect and in what direction. As with all moving averages, the shortest one (green) moves first, followed by the middle (red) and then longer average (blue). Creator Bill Williams used 13, 8 and 5-period averages, brought forward 8, 5 and 3 periods, respectively. Colors are usually blue, red and green, respe
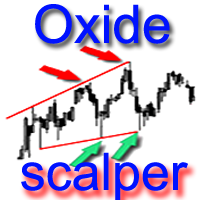
The algorithm of the Expert Advisor determines the angle of the "expanding triangle" pattern and starts working when the price touches one of the triangle's sides. The trades are filtered by the delay characteristic of the RSI indicator. After opening a deal, the EA sets the mandatory take profit and stop loss and manages the deal it with a tight trailing stop. The Max Spread parameter sets the maximum spread, exceeding which (by spread expansion) will prevent opening deals. The default settings

A trend indicator based on the Ichimoku Kinko Hyo and MACD. The ICloud Scalper Trend Indy is an improved variant of the Ichimoku Kinko Hyo and MACD, which shows the moment of trend following quite accurately. It is often used as a signal filter. Combination of two indicators makes a better use of these advantages: Ichimoku Kinko Hyo identifies the trend, while MACD determines the short-term movements and signals in the trend direction.
Messages/Sounds (Notifications and sound settings) ON/OFF
This indicator analyzes in parallel the moving average for multiple currencies and timeframes. It sends a notification when the trends are in alignment for all timeframes. To get better assessment of the trend strength, it shows as well a ratio between the number of pips reached from the current trend and the average of pips reached from the previous trends.
Features Loads automatically historical price data from broker server; Tracks all currency pairs for all timeframes in parallel; Configur

This indicator is using the Central Limit Theorem in combination with historical volatility and Fibonacci ratios in order to create unique type of chart tool called Projected Volatility Distribution. This tool allows you to perform highly accurate intraday technical analysis where in a split second you can detect overbought and oversold conditions as well as strong trends. In addition you have at your disposal multi-functional panel which shows signals in real time and gives you the ability to o

This trading system is based on criteria of various technical indicators . These include fractals , Alligator and ADX (measuring trend strength with average directional movement index) . This algorithm uses a hedging strategy in the zone of volatility. To explain it: if fractal to buy is above the Alligator's Teeth line, the pending Sell Stop order to open the position should be placed 1 point below the low bar, which formed a fractal. If the fractal to sell is below the Alligator's Teeth line,
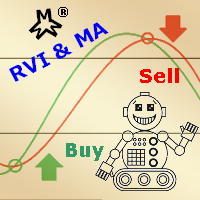
The strategy is based on RVI oscillation to check the prices trend and direction and check the moving avarages (Open Price and Low Price) to decide about the viability of opening any order. Market is very unpredictable due to economic news published every hour, but our EAs are really prepared for such hostility due to its protections. This Expert Advisor is provided with two kinds of indicators: an oscilator (RVI) in order to check the prices oscillation limit pattern and direction trend; two Mo
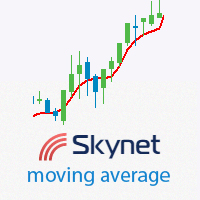
This indicator displays the trend direction, the averaged price value and flat areas. It is used to determine the averaged price value with little or no delay. During a flat, its line is often smooth, and it follows the trend during a descending or an ascending movement. The best charts for the indicator are the range\renko charts, which do not have rounded borders of price changes. Various types of moving averages and certain types of digital filters were used as a prototype. Compared to variou

Dieser technische Indikator identifiziert und analysiert automatisch Preisbewegungen anhand einer Vielzahl von Umkehrkerzenmustern im Diagramm. Es zeichnet praktischerweise Pfeilzeichen zusammen mit den entsprechenden Musternamen ein, sodass Sie die neuesten Umkehrkerzenmuster leicht erkennen können. Mit diesem Indikator können Sie Chartanalysen schnell identifizieren und mit zuvor identifizierten Kerzenmustern vergleichen. Der Indikator umfasst eine Reihe implementierter Candlestick-Muster,

The Expert Advisor trades using the Stochastic indicator with the specified parameters. A trade is opened at the crossover of the specified levels. The default levels are K = 11, D = 3, Sl = 3. The EA opens a trade when overbought and oversold levels specified by the trader are crossed. Trades are closed by Take Profit levels, which are hidden form the broker. If a wrong direction is chosen, the EA opens an averaging grid of orders. If there is no signal for opening a position by Stochastic indi

An original trading robot for Forex trading. It opens deals in two directions at the same time. When the first order is closed, the EA tries to bring the second one into profit and to close it. If the market price moves against the order, then the EA places a group of orders against the price movement and opens an additional order in proportion to the price movement with a certain coefficient. Orders are closed when the entire grid of orders reaches a total profit. It is recommended to trade cur

Real-time trend, pricing, and volume details in the corner of the current chart. This indicator displays useful trend, pricing, and volume information in the corner of the current chart. With this indicator, you get real-time market trend, pricing (Ask, Bid, spread, Open, High, Low, change from previous bar Close), and volume (current, High, average). After the indicator is executed, you will see this real-time data in the upper right-hand corner of the chart or an alert indicating that an error

Currencies Cleaner panel will give you an overview of all the most traded market's currencies in a single click. First of all the panel will refresh all your charts, opening them four times in all timeframes needed.
1 - CURRENCIES It uses a complex algorithm to study the movement of 17 different indicators. It means that the algorithm not only "reads" the actual value of an indicator, but also creates a probability of success using the position of this value on the indicator and the last movem
DSProFx TrendLine Expert Advisor is a semi-automatic Forex robot that can be used for scalping and day trade as well. It works based on Trend Line.
Concept, Timeframe and Pairs DSProFx TrendLine works in all time frame. Trades will be opened if the market price touch the Trend Line that is set for Buy or Sell based on line name . "B" for Buy order and "S" for Sell order. To open more than 1 orders, for example Buy orders : use "B1", "B2", "B3", etc. The trades will be closed by some options:
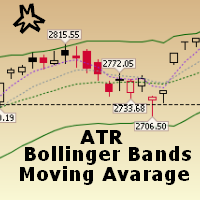
This EA strategy is result of professional experienced traders demand for trading technique and quality. It has three built-in indicators: ATR to measure oscillation, Bollinger Bands and Moving Avarage to measure Trends. It has some protections like Trailing Stop Loss to protect your profits an Spread limitator to protect your equity and finally an stopout level that you may define by an minimum equity percentage.
General Inputs Closes orders with any profit of value over in currency: this par

Generator Pro ermöglicht die Erstellung von Strategien, die aus mehreren virtuellen Strategien (von einer bis zu Hunderttausenden) auf der Grundlage der Mittelwertbildung bestehen. Jede virtuelle Strategie hat ihren eigenen Strategietyp (Trend, AntiTrend), virtuelle Einzahlung, virtuelle Positionen, Los. Der EA kontrolliert die Arbeit aller virtuellen Strategien, fasst alle Vorgänge zusammen und führt entsprechende Vorgänge auf dem Handelskonto durch. Betriebsmodi des Advisors
Ohne_Datei
Power Index Fx is a new generation indicator that allows an intelligent multi Timeframe analysis. The indicator is flexible and completely customizable. Its positioning in separate window makes it unobtrusive and extremely functional. Its formula of calculation makes it a fundamental tool for identifying possible moments of continuation in favor of Trend. Power Index Fx is a professional tool able to increase your operational potential.
Input Values DASHBOARD SETTINGS How many symbols to show

Heiken Ashi Smoothed Strategy is a very simple but powerful system to get forex market trend direction. This indicator is actually 2 indicators in 1 pack, Heiken Ashi and Heiken Ashi Smoothed Moving Average both included. Because HA (Heiken Ashi) and HAS (Heiken Ashi Smoothed) are calculated in the same one system event with necessary buffers and loop only, so it is the FAST, OPTIMIZED and EFFICIENT HA having the combined indicator of MetaTrader 4. You can choose to display HA and HAS in the sam

The indicator displays divergence and convergence on all instruments. It works on all timeframes. After finding divergence/convergence, the indicator draws a Buy or a Sell arrow according to the detected signal.
Settings Buy - show buy signals Sell - show sell signals Divergence - show divergence on the chart Convergence - show convergence on the chart KPeriod, DPeriod, Slowing - Stochastic settings drawPriceTrendLines - draw a line (of divergence/covergence) on a price chart drawIndicatorTre
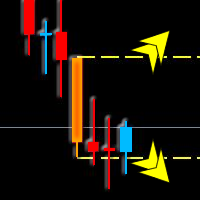
Masters Bars is an indicator that plots a line over High and Low of the last Master Bar. A Master Bar is defined as the decisive candle that exceeds the last decisive candle High-Low range. This helps traders to see if the chances for trend continuation improve or the chances for a trend reversal increase when Masters Bars range is broken. Masters Bars include an Alarm function that produces a sound, or even can send an email and/or push notification depending up what you have configured in your
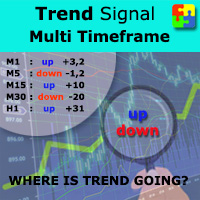
Do you want to always know in a quick glance where price is going? Are you tired of looking back and forth between different timeframes to understand that? This indicator might just be what you were looking for. Trend Signal Multitimeframe shows you if the current price is higher or lower than N. candles ago, on the various timeframes. It also displays how many pips higher or lower current price is compared to N. candles ago. Number N. is customizable The data is shown in a window that you can m

The Relative Strength Index (RSI) was developed by J. Welles Wilder and is a momentum oscillator that identifies overbought and oversold conditions. It is also a popular choice for many traders helping them find entries into the market.
How it Works The simplest way to use the Relative Strength Index is to wait for an overbought or oversold condition and then enter into a trade when the RSI indicates that price is resuming in the dominant direction of the trend. Buy signals : For the first con
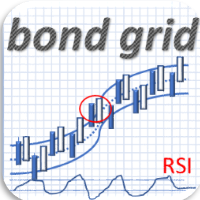
Bond is an Expert Advisor using custom indicators based on candles movements to identify reversal trends and Bollinger Bands. In case of “wrong” entries, the EA uses a grid of orders with increasing lot size (in an exponential way). The grid size is limited for more safety. Attention: this EA cannot be used with other EAs at the same time, for the same symbol and in the same account. This EA is designed to be used with different forex pairs and with some metals, commodities and indices.
Recomm

The objective of the Crypto-Box Indicator is to determine the most efficient entry in trends. . It works for all purposes, standing out in the main cryptocurrencies: BitCoin, LiteCoin, Ethereum and Emercoin. And in Currencies: EURUSD, USDJPY и GBPUSD. The indicator is designed to find the best conditions for financial instruments. Detects acceleration patterns in prices in areas of supports and resistances. The development team is constantly improving the functionality of the Indicator and we th
The Expert Advisor trades using the Stochastic indicator with the specified parameters. A trade is opened at the crossover of the specified levels. The default levels are K = 11, D = 3, Sl = 3. The EA opens a trade when overbought and oversold levels specified by the trader are crossed. Trades are closed by Take Profit levels, which are hidden form the broker. If a wrong direction is chosen, the EA opens an averaging grid of orders.
Expert parameters MAGICB - Long magic number; MAGICS - Short

Sign of victory is a new indicator based on three digital filters. The indicator plots three histograms in a separate window, and also draws an arrow on the price chart. Each histogram is a digital filter that converts quotes and decomposes them into trends: buy or sell. The examples of market entries using this indicator are shown on the screenshots using arrows. This indicator can help traders better assess the market situation.
Sign of victory features The indicator is perfect for scalping

I present you an Expert Advisor based on the Martingale system. The trading volume used for opening positions depends on the parameters Lot and Multiplier. Martingale system, which proportionally increases the trade volume according to set parameters, is applied when you open a trade. Please note that the EA features the ability to select the trading direction: Buy or Sell.
Recommendations: Currency pair: any; Timeframe: the EA is optimized for Н1, but any timeframe can be used. Other: the tra
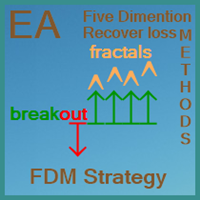
FDM Strategy is an Expert Advisor based on fractals and five dimension method. Five Dimensions expert system is developed based on a theory combining the Chaos Theory with the trading psychology and the effects that each has on the market movement. There is also an ADX (measuring trend strength with average directional movement index) used as a trading filter. Long and Short Trade Signals: If fractal to buy is above the Alligator's Teeth (red line), the pending Sell Stop order must be placed 1 p

This indicator shows main trend, entry zone and exit zone. This is a muti-timeframe indicator, so it is always repainting in the current period of the higher timeframe.
Features Colorful Histogram: it indicates the main trend, the tomato means the market is bearish,and the sky blue means the market is bullish. Inner Blue Bands: it is entry zone for entry market, the market is relatively safe for entry. Outer Yellow Bands: it is exit zone for exit market, the market is oversold or overbought.

This is an Expert Advisor with the elements of graphics trading. It performs trading operations using the "Rectangle" (or "Square") shape. The Expert Advisor automatically draws a square and opens a Buy or Sell orders when the price crosses its lower or upper bounds respectively. The shape can be drawn manually. For this purpose you should disable the auto drawing feature in the Expert Advisor settings. If the price moves in the wrong direction, the Expert Advisor sets up to four orders in accor
MetaTrader Market - der einzige Shop, in dem man Handelsroboter als Demoversion herunterladen und testen sowie anhand historischer Daten optimieren kann.
Lesen Sie die Beschreibung und Bewertungen anderer Kunden über das gewünschte Produkt, laden Sie es direkt ins Terminal herunter und erfahren Sie, wie man einen Handelsroboter vor dem Kauf testet. Nur bei uns können Sie ein Programm testen, ohne dafür zu bezahlen.
Sie verpassen Handelsmöglichkeiten:
- Freie Handelsapplikationen
- Über 8.000 Signale zum Kopieren
- Wirtschaftsnachrichten für die Lage an den Finanzmärkte
Registrierung
Einloggen
Wenn Sie kein Benutzerkonto haben, registrieren Sie sich
Erlauben Sie die Verwendung von Cookies, um sich auf der Website MQL5.com anzumelden.
Bitte aktivieren Sie die notwendige Einstellung in Ihrem Browser, da Sie sich sonst nicht einloggen können.