Handelsroboter und Indikatoren für den MetaTrader 4 - 24
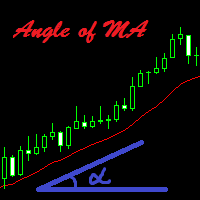
The indicator calculates the inclination angle of the Moving Average and displays the result on the screen. Users can select the start and end points to measure the inclination of the MA. It is also possible to set the angle value, and if the inclination angle exceeds the specified value, the indicator will play a sound alert and display a message on the screen.
Configurations Left_Shift_of_MA=1; - Shift of the MA to calculate the inclination angle (start point) Right_Shift_of_MA=0; - Shift of
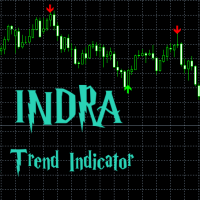
What is the INDRA Trend indicator? A INDRA Trend is a trend following indicator which give most accurate arrow signals of BUY and Sell based on the moving average , buying power and selling power in market, checking with other multiple indicators and providing the best possible time to get in to the market . This indicator is tested in multiple time frames as showed in screenshots it is also tested in multiple currency pairs , crypto and metal pairs such as USD/CAD EUR/JPY EUR/USD EUR/CHF US
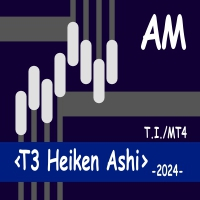
Implementation of the classic Heiken Ashi indicator using the T3 smoothing method. The indicator allows you to select the smoothing depth and the smoothing shift relative to the current price. The indicator also allows you to select the price at which the data will be smoothed, as well as the control price with which comparison is made. The proposed approach allows you to visualize the trend and simplify trading decisions.
FREE

Trend Monkey is an EA that integrates various strategies such as trend identification, grid, and hedging. After using it, I believe you will be able to start your journey of wealth. This is the free version, you can download the professional version. This EA trades based on trends, so trading is not very frequent, and you need to wait until a clear trend appears.
Feature Spread requirements are not particularly demanding, general platforms can run Follow trends, use trends to trade Using hedg
FREE

The indicator improves the idea implemented in the standard Bulls and Bears indicator. This indicator displays the difference between the High and Low for the current period of time and the values of the channel constructed at the maximum and minimum prices for a longer period. The growth of the indicator values above zero indicates that the High for the current period is greater than the average of the maximum prices for the period chosen as the indicator parameter. This situation in most c
FREE

FREE FOR A LIMITED TIME ONLY!!! The Ultimate Indicator For Trading Trend This indicator clearly shows you the strength of the market in one direction or the other, which means that you can trade knowing you are either with or against the market. When used in conjunction with the +3R principles you are sure to have some serious results. The +3R Principles Routine - This is when you trade and how often Rules - This is the rule you follow Risk:Reward - This is the percentage amount of your accoun
FREE

With the Trend and News indicator you will always be up to date!
Tells you in which direction it is safer to open positions 3 in 1: trends + news + news influence index
news for the selected period actual trends for five timeframes (M5, M15, H1, H4, D1 by default)
news impact index calculated by assessing the actual values of published news
News Displayed on the chart as vertical lines with a description in the form of a tooltip The text displays two news: the previous published and the ne
Most accurate BUY/SELL indicator on this market.
It works based on the result of multiple EMAs, with some specific averaging and algorithm . Output of an EMA is the input for another EMA.
Works on Forex, Commodities, Indicies, Stocks, Crypto, ... on all timeframes (but recommend 1H or 4H) and on every brooker.
If you want this and all my other products for FREE , create account here and then write me and I will send you all my actual and future product for FREE + VIP on my http://disc
The LWO is a tool that effectively indicates the end of trends. Being an oscillator, it has values between 0 and 100, defining the areas of hyper-sold and those of hyper-bought. Its effectiveness is due to the weighing of prices at the end of individual periods on a logarithmic scale; this allows you to have a perception of the will of the market.
The parameters
The indicator has only 2 settable values, period and smooth factor.
The period indicates how many bars the weighing is performed,
FREE

Implied Trader is a fully automatic, professional trading robot designed specifically for the foreign exchange market AUDCAD M30 timeframe. Parameter configuration is not necessary for EA. Only the size of the lot you intend to use needs to be chosen. 0.1 is the suggested lot size for a $2000 account. You can raise the lot size correspondingly if your account has more money. It has an intelligent algorithm that recognizes the trend. On the basis of the trend direction, the expert places orde
FREE
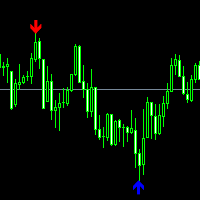
AMS Scalper
An excellent indicator for the entry point into the market; we use indicator signals only according to the trend.
Settings:
Range - 50 (range size for signal search.)
Maximum candles Back - 3 (after how many candles to set a signal)
P.S. For the signal to appear on the zero candle, set 0.
We recommend a trend indicator - Trend Arrow Super
Still have questions? do you need help?, I'm always happy to help, write to me in private messages or
In telegram

The FxSProMT indicator shows the current market trend and trend change.
Indicator Parameters Ind_Period - the number of previous bars used to calculate actual values. Number_Bars - the number of bars to display the indicator.. Too many bars may significantly slow down the operation of the trading terminal. Signal_Sound - sound alert to notify of trend change. The sound can be played multiple times until the signal is confirmed (the bar closes). Default is disabled. Signal_Alert - an alert to n
FREE

*OPTIMIZE THIS EA BEFORE TEST, MAKE SURE IT WORKS FOR YOU BEFORE PURCHASE Once upon a time, in the bustling streets of Wall Street, there existed a sophisticated algorithm known as the "MOMENTUM PRO" Trader. This digital entity was not just any ordinary piece of code; it was equipped with a repertoire of a feed forward neural network that gave it a keen insight into the ever-shifting dynamics of the financial markets.
At the core of its decision-making process lay the moving averages (MA) and

BreakHarmony Multi-Timeframe Breakout Indicator for MT4
The BreakHarmony Multi-Timeframe Breakout Indicator for MT4 is a highly advanced tool providing information on breakout points across different timeframes, aiding traders in decision-making and understanding market movements. [ Features and Manual | MT5 version | All Products ] The indicator tracks breakout points on price charts across 6 timeframes. Breakout prices are indicated with the closing price of the corresponding candl

Area 51 EA generiert Signale für verschiedene Strategien. Hat verschiedene Money-Management-Strategien und dynamische Losgrößenfunktion. Wenn eine Position eröffnet wird, ist sie mit einem Take Profit und einem Stop Loss ausgestattet. Wenn die Position rentabel wird, wird ein dynamischer Stop-Loss basierend auf den angegebenen Werten (TrailingStep und DistanceStep) festgelegt und ständig nachgeführt. Auf diese Weise können Sie immer Positionen mit Gewinn schließen.
Für die Verwendung des EA em
FREE

MACD Divergence Scanner is a multi-timeframe and multi-symbol dashboard and alert that checks all timeframes and symbols to find regular and hidden divergences between price chart and MACD indicator. This divergence scanner is integrated with support and resistance zones so you can check the MACD divergences in the most important areas of the chart to find trend reversals in the price chart. Download demo version (works on M 1,M5,M30,W1 timeframes) Full description of scanner parameters ->

YOU CAN NOW DOWNLOAD FREE VERSIONS OF OUR PAID INDICATORS . IT'S OUR WAY OF GIVING BACK TO THE COMMUNITY ! >>> GO HERE TO DOWNLOAD
Momentum channel is a simple momentum based system yet with a great degree of accuracy in detecting turning points. The market momentum are defined by Average True Range Channels . When price breaks these channels most times , it is an indication of a shift in market momentum and thus a possible new trend formation. The system can be traded on any time frame an
FREE

Necessary for traders: tools and indicators Waves automatically calculate indicators, channel trend trading Perfect trend-wave automatic calculation channel calculation , MT4 Perfect trend-wave automatic calculation channel calculation , MT5 Local Trading copying Easy And Fast Copy , MT4 Easy And Fast Copy , MT5 Local Trading copying For DEMO Easy And Fast Copy , MT4 DEMO Easy And Fast Copy , MT5 DEMO
The homeopathic indicator is also called the CCI indicator. The CCI indicator was propos
FREE

MACD Dashboard Panel This indicator helps you to scan symbols which are in the Market Watch window and filter out a trend according to MACD.
Moving Average Convergence Divergence (MACD) is a trend-following momentum indicator that shows the relationship between two moving averages of a security’s price. The MACD is calculated by subtracting the 26-period Exponential Moving Average (EMA) from the 12-period EMA.
The result of that calculation is the MACD line. A nine-day EMA of the MACD call
FREE

The indicator is a polyline (ZigZag segment) that tracks and connects the extreme points of the chart price that are at least a specified size apart from each other in points on the price scale.
The one and only setting is the minimum size (in points) of a ZigZag segment. The indicator displays levels to determine a possible trend reversal:
level "LevelForUp" - the breaking of this level determines the possible reversal of the trend up (to buy);
level " LevelForDown " - the breakin

EA TDI Scalper Pro
This is a price action trading robot, the EA will stick to the medium term trend and price to deliver trades. Orders are always protected by the user set stop loss points. With the capital management system, it will help that EA operates in accordance with its purpose. Telegram : https://t.me/trungtqIT
Timeframe is M15 And Up. Minimum account balance: $30. Features: Every trade is protected by stop-loss EA has the ability to trade multiple currency pairs at the same time

The Trend Venom EA is a fully automated Expert Advisor that trades based on Moving Average and RSI signals. The EA trades using market orders and uses averaging to safely turn otherwise negative trades positive. This EA works best on EURUSD using the M5 timeframe. A VPS is advisable when trading this system. Check the comments for back test results and optimized settings. Please note: I have made the decision to give this EA away and many more for free with limited support so that I can concentr
FREE
This indicator is a free version of Double Top Tracker . Unlike the full version, some functions are disabled and the parameters cannot be changed. This indicator analyzes in parallel price charts for multiple currency pairs on all timeframes and notifies you as soon as a double tops or double bottoms pattern has been identified. The alert occurs when the the second peak has been reached. Double Top is a trend reversal pattern which are made up of two consecutive peaks that are more and less eq
FREE

Combined indicators, based on moving averages and price momentum, help you to know when to break out your profit timely. It lets you to ride on major trend as long as possible but knowing when to break out smart and timely. The indicator displays major trend, volatile, reversal signals and last lowest and highest price. It's status updated on top right of your chart keeps you informed about pip-changes involved.
Parameters: FAST Period
Period of the fast moving average
SLOW Period
Period
FREE
This EA keeps an eye on drawn lines and alerts according specification. It is a semi-automatic robot, which does NOT draw or change any lines. A user can draw them manually or use tools like Trendline-Architect or Channel-Architect, which draw lines automatically. Objects of type OBJ_TREND, OBJ_CHANNEL, OBJ_TRENDBYANGLE, OBJ_REGRESSION, OBJ_STDDEVCHANNEL and OBJ_FIBOCHANNEL will be detected - others will be ignored. The lines or channels have to have valid coordinates and rayed to the right, oth
FREE
DepoControl – Full Control Over the Deposit Closers Expert Advisor controls the overall account status and closes ALL market orders on the account when certain conditions occur. The trading robot closes ALL orders on the account in the following cases (by profit): Close ALL orders by a total profit on the account in monetary terms . For example, suppose that the settings specify that positions should be closed when profit of 100 is reached. In this case, the Expert Advisor closes all mark
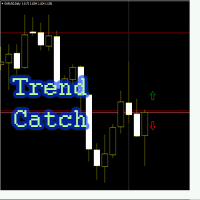
Советник "Trend_Catch" входит в рынок по средним скользящим и фракталам. Средние скользящие определяют направление тренда, фрактал - момент входа входа в рынок. В советнике прописан безубыток, трейлинг стоп, мантингейл по желанию Пользователя
Настройки советника: Close_by_Reverse_MA_Signal = false; закрыть ордер на покупку, если быстрая МА находится выше медленной, закрыть ордер на продажу, если быстрая МА находится ниже медленной, если параметр Invert_sig включен (инвертирован сигнал), сигнал
FREE

The indicator shows the Fibonaccia golden ratio levels and the price balance line Has three different sensitivity options Allows you to visually navigate what state the market is in and where trend reversals are possible Works on all timeframes, on any currency pairs, metals and cryptocurrencies Can be used when working with binary options Distinctive features Based on the golden Fibonacci value; Determines the balance line of price equilibrium Has three different sensitivity settings; Simple an
FREE

Fibonacci retracement is really one of the most reliable technical analysis tools used by traders. The main problem with using these levels in trading is that you need to wait until the end of the impulse movement to calculate the retracement levels, making difficult to take a position for limited retracement (0.236 or 0.382). Fibo Dynamic solves this problem. Once the impulse movement is identified the retracement levels are automatically updated allowing very dynamic trading in trends with onl
FREE

The StrikePin indicator is a technical, analytical tool designed to identify trend reversals and find optimal market entries. The StrikePin indicator is based on the pin bar pattern, which is the Price Action reversal pattern.
An entry signal, in a trending market, can offer a very high-probability entry and a good risk to reward scenario.
Be careful: the indicator is repainting since it is looking for highest high and lowest lows. You should avoid to use it in experts but you can use it
FREE

The swing continuation pattern happens in a trend direction after a short reversal / pull back . As the name suggests , these patterns occurs along the swing high and swing lows of a trend , this makes the patterns very low risk patterns with potential high rewards . The swing continuation indicator also combines Currency Meter as a filter for its execution. The idea is to go with both the price trend flow and currency trend flow. Which means the price action must be supported by the currency st
ADR ST patterns is a modification of the classical ADR indicator. This simple indicator corresponds to the parameters specified in the ST patterns Strategy ( https://stpatterns.com/ ). Structural Target patterns are the market itself, which is consistently divided into components. For the formation of ST patterns , no trend lines, geometric proportions of the model itself, trading volume, or open market interest are needed. They are easily recognized and built only on the basis of breaking thr
FREE
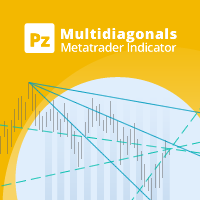
This indicator connects past price points drawing diagonals and trend lines, which converge in the future creating hidden reversal points. [ Installation Guide | Update Guide | Troubleshooting | FAQ | All Products ] Find hidden reversal points Spot convergence zones easily Dense criss-cross zones are reversal points Configurable amount of lines and price points Configurable colors
How to use the indicator The indicator draws several lines on the chart, and where many of these lines converge a
FREE

The Expert Advisor opens orders using Stochastic Oscillator . All parameters can be customized and optimized. The EA features three strategies for working with the oscillator: Open deals when the main indicator reaches oversold/overbought levels. Open deals when the main line forms a reversal pattern within oversold/overbought areas. Open deals when the main and signal lines intersect within oversold/overbought areas. The number of buy and sell orders opened simultaneously is set separately. Thi

Es ist ein Algorithmus, um Trendänderungen frühzeitig zu erkennen. Sie sollten mehrere Werte für den Multiplikatorparameter ausprobieren (1 <Wert <10 empfohlen). Auf den ersten Blick sehen Sie effektive Einträge. Dies ist in der Tat eine der Reihen, die Geleg Faktor ursprünglich hatte. Aber es wurde entfernt, weil es nicht mehr benötigt wurde. Die anderen Zeilen reichten für G.Faktors Effektivität aus, aber ich wollte diese noch teilen. Testen Sie es immer, bevor Sie es auf Ihrem Live-Konto verw
FREE

Introductory Price for Limited Time only. Red Aros (Red Arowana) offers two ways to trade automation : - Single Sniper Trade with your set of stop loss and take profit. - Grid based Trade Features covered in this EA : - Trades are triggered based on our complex calculated signal. - Works on any forex pairs ( except Metal, Commodities and Index). You can attach as many pairs : major and cross pairs. Trades will be filtered based on Time, Trend, Exposure, Number of Pairs, Max Trade and Max Gri
The indicator determines overbought/oversold zones on various timeframes. Arrows show market trend in various time sessions: if the market leaves the overbought zone, the arrow will indicate an ascending trend (arrow up), if the market leaves the oversold zone, the arrow will indicate a descending trend (arrow down). Situation on the timeframe, where the indicator is located, is displayed in the lower right window. Information on the market location (overbought or oversold zone), as well as the
FREE

Our Expert Advisor (EA) revolutionizes trading in the Forex market by integrating two powerful strategies - Scaling and Averaging - into a dynamic and adaptable framework. Designed for the MetaTrader4/5 platform, this EA employs innovative techniques to optimize trading outcomes in various market conditions. Metatrader5 Version | Auto Smart Pro MT4 Live Results | All Products | Contact | How to install MT4 Product
Scaling Strategy: The Scaling strategy capitalizes on trending market mov

[DESCRIPTION] A Simple Moving Average with period 20 that changes color to green when the price is above the moving average and to red when the price is below the moving average. A simple moving average (SMA) calculates the average of a selected range of prices (closing prices), by the number of periods in that range. The SMA is a technical indicator that can aid in determining if an asset price will continue or reverse a bull or bear trend [WARNING AND RECOMMENDATIONS] Trading Forex and
FREE

TILLSON MOVING AVERAGE Auch bekannt als TMA- oder T3-Indikator. Es ist ein gleitender Durchschnitt , der EMA und DEMA in seiner Formel verwendet und mit einer Binomialerweiterung 3. Grades berechnet wird . Vorteile; 1- fehlerhaften Signale , die in anderen gleitenden Durchschnitten angetroffen werden ( kontinuierliches Zick zag ) wurde so weit wie möglich reduziert. 2- verhinderte die Verzögerungen , die bei klassischen gleitenden Durchschnitten zu beobachten sind . 3- Sehr erf
FREE

hint: my basic indicators are used like that KingLevel combind with KingSequence will provides basic insights of the price action of the markets and KingSequenceSgn is just for the convienent for watching. And plus with Forex Trading mentor subsccription I will assist you to win the market at first later if it's great will be upgraded to King Forex trading mentor.
It just the main chart sign of the "KingSequence" indicator.
Here is the detals from the "KingSequence" indicator
Slide 1: Ti

Version History Date Version Changes 07/08/2022 1.00 Initial Release Description The Aroon indicator is a technical indicator that is used to identify trend changes in the price of an asset, as well as the strength of that trend. In essence, the indicator measures the time between highs and the time between lows over a time period. The idea is that strong uptrends will regularly see new highs, and strong downtrends will regularly see new lows. The indicator signals when this is happening, and
FREE

The " Comfort Zone Signal " indicator identifies a daily zone that, when broken, has a high probability of the market continuing the established trend .
Upon signal, the indicator calculates stop loss and take profit, which can be set by you.
You can also set the trend. If the price is above the MA, it looks only for long positions, if below, it looks only for short positions.
You can choose to ignore the moving average and display all signals.
Additionally, you have the risk percentage d
FREE
MT5 Version Available Here: Coming soon...
Telegram Channel & Group : https://t.me/bluedigitsfx
V.I.P Group Access: Send Payment Proof of any of our Paid Products to our Inbox
Recommended Broker: https://eb4.app/BDFXOsprey * The Most User Friendly Symbol Changer on Metatrader ! Features
Change Timeframes in 1 click of a button on 1 chart. Change Between All Currency Pairs in 1 Click of a button on 1 chart. Ability to Turn Boxes to Current Candle Colors. Easily Identify the Trend f
FREE

Introducing the Reversal and Breakout Signals
This innovative tool is crafted to enhance your chart analysis by identifying potential reversal and breakout opportunities directly on your charts. It's designed with both novice and experienced traders in mind, providing intuitive visual cues for better decision-making. Let's dive into the key features and how it operates:
### Key Features:
Dynamic Period Settings: Customize the sensitivity of the indicator with use
ARIN2: High Frequency Trading
A utomated R obot for I ncreasing N et worth by 2 factors: trading and rebates A versatile and unconventional anti-martingale EA that fills an overlooked niche in the EA domain. Advantages Set-and-forget, fully-automated A u tomatic Lot-sizing Generate profit regardless of market direction High-frequency increases volume and rebates Designed specifically for Flash Crashes, Black Swan events, price gaps, News Events Immune to slippage, latency, requotes, dis
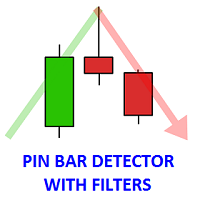
The indicator finds the Pin bars on the chart, perhaps, the most powerful Price Action pattern. The indicator has additional filters, and the user can: specify all parameters of the pin bar size as a percentage of the total candle size (minimum length of the large wick, maximum values of the short wick and body size). set the number of fractals for the last N bars, the Pin bar is based on, i.e. define the support/resistance levels. specify the required number of bearish/bullish bars before the P

Ichimoku Signals Dashboard To test the indicator please download demo version here. Find Ichimoku signals as easy as you can. Ichimoku is one of the most powerful trends recognition indicators. And it has valid signals for the trades. This indicator scans several symbols and time-frames by the Ichimoku to find all the signals that you want and show in a dashboard. It's easy to use, just drag it onto the chart. It's better to add Ichimoku indicator to chart before adding this indicator. Ichimo

The ICT Silver Bullet indicator is inspired from the lectures of "The Inner Circle Trader" (ICT) and highlights the Silver Bullet (SB) window which is a specific 1-hour interval where a Fair Value Gap (FVG) pattern can be formed. A detail document about ICT Silver Bullet here . There are 3 different Silver Bullet windows (New York local time):
The London Open Silver Bullet (3 AM — 4 AM ~ 03:00 — 04:00)
The AM Session Silver Bullet (10 AM — 11 AM ~ 10:00 — 11:00)
The PM Session Silver Bullet

AUTO3M Pro MT4 is a fully automatic Expert Advisor for Trend, Hedging, News filter Strategy Trade With Bollinger Bands And Stochastic Oscillator Bollinger Bands Are Used Mainly To Follow Trends. Stochastic Main Line And Signal Line Use For Open Pending Order Buy Or Sell Fibonacci Are Use Target Profit, support and resistance level price The advisor Auto3M Pro MT4 can work on a VPS. MT5 version : Auto3M Pro MT5 Features No martingale Hard stop loss and take profit for each position Flexible s

This scanner is monitoring the entire market for Ichimoku trade opportunities for all symbols and for all time frames. You don't have to look to all the charts, for all symbols and for all time frames. This scanner will alert you on your computer, or on your mobile, when a trade opportunity has been found. You never have to miss a trade opportunity! This indicator is designed to scan all pairs and symbols, for all selected time frames, to find a Tenkan and Kijun Cross or a breakout of the Ich

Introduction Excessive Momentum Indicator is the momentum indicator to measure the excessive momentum directly from raw price series. Hence, this is an extended price action and pattern trading. Excessive Momentum Indicator was originally developed by Young Ho Seo. This indicator demonstrates the concept of Equilibrium Fractal Wave and Practical Application at the same time. Excessive Momentum detects the market anomaly. Excessive momentum will give us a lot of clue about potential reversal and

The product combines the best features of the standard CCI oscillator with the adaptive digital filter. The indicator allows entering and exiting the market at the very beginning and end of a trend. The indicator generates high-probability signals while retaining high sensitivity. The indicator does not repaint on fully formed bars. Options: Ind_Price - price used for the indicator calculation; Ind_Period - indicator period. Application rules: A big red dot - a strong bearish trend, if the price
FREE

The indicator is designed to determine the pivot level for a group of candlesticks and the trend direction. no repainting calculation is done on an active candle if candlesticks are above the main line, the trend is upward if candlesticks are below the main line, the trend is downward breakdown of the main line signals a trend change or a price rebound two display modes, normal and with acceleration (ModeLite) an auxiliary line displays the resistance line
Configurations BarsHistory - how many
FREE

This indicator helps you to find overbought and oversold prices based on William %R. Input Description: Wperiod: Period for %R indicator. OverBoughtLevel: Define the overbought level for %R. Must in between 0 and -50. OverSoldLevel: Define the oversold level for %R. Must in between -50 and -100. middle_value: When true, indicator also draw the middle points between upper and lower line. shift: Set an additional offset to the indicator.
Several Notes: Set 0 and -100 as Overbought and Oversold le
FREE
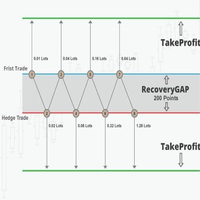
Hello all Expert works in Recovery Zone With the opening of a buy or sell deal at the expense of the general trend with the suspension of a pending deal in multiples With the control of the complications from the multiples box from LO1 to LO20 Control it according to the way you work With closing all together on the target with the arithmetic mean method Working on currency pairs, it is preferable to have a small spread Max Spread = 0.3 Broker link from here Deposit: 5000 USD lot :0.01 https://
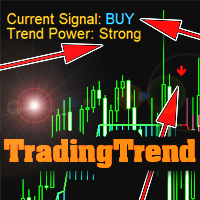
The indicator is not redrawn.
Can be used as a ready-made trading strategy.
Shows: Trend direction; Trend strength; Points of trend reversal or fading. Settings: Trend sensitivity (the lower, the more accurate) - operating sensitivity (the higher, the more accurate); Calculation method - calculation method; Info position - angle of location of the info label (or remove); Text Color - text color; Trend Color Buy - color of the BUY text; Trend Color Sell - SELL text color; Sound Alert - Pop-up

This simple indicator takes information from Ichimoku Kinko Hyo to establish strong and weak currencies to pair together for ideal trending situations. It also generates buy or sell signals based on the standard deviation of returns together with currency strength. A currency is said to be strong or weak depending on where the price is in relation to two factors: if the price is above the daily kumo and above the 26 day Kijun-sen, it is said to be strong. Likewise, when trading below the daily k
FREE

Smart Mone Liquidity Zone
Overview : Smart Mone Liquidity Zone is a sophisticated MetaTrader 4 indicator meticulously crafted to illuminate crucial liquidity zones on price charts, amplifying traders' capacity to discern optimal trading opportunities. Engineered by Yuri Congia, this indicator empowers traders with profound insights into market dynamics, enabling astute decision-making within various timeframes.
Limited-time Special Opportunity:
Seize the moment! Be among the first 10 (Pu
LEADING AND LAGGING INDICATORS DASHBOARD https://www.mql5.com/en/users/earobotkk/seller#products P/S: If you like this indicator, please rate it with 5 stars in the review section, this will increase its popularity so that other users will be benefited from using it.
This dashboard scans all time frames(M1,M5,M15,M30,H1,H4,D1,W1,MN1) and shows up trend and down trend for MACD, PSAR, RSI, STOCHASTIC, MOVING AVERAGE, BOLLINGER BANDS by changing the colours of the relevant boxes. It also shows c
FREE
AwS Algorithm whit Stocastic: It is a algorithm system that uses the stocastic signal as a reference to enter the market.
The system detects the important points and operates the trend o the pulback, you chosse the direction
You can download the demo and test it yourself.
Very stable growth curve as result of smart averaging techniques.
"Safety first" approach in development. Stress-tests on historical data f

Oder CKC.
Dieser Indikator funktioniert in Abhängigkeit von der klassischen Zehn-Tage-Regel des gleitenden Durchschnitts, die von Chester W. Keltner (1909–1998) beschrieben wurde. Alle Parameter sind standardmäßig auf die klassische Version des Keltner-Systems eingestellt, während der Benutzer sie nach Belieben ändern kann. Wichtige Informationen
CKC-Handbuch lesen: https://www.mql5.com/en/blogs/post/736577 CKC Expert Advisor Beispiel: https://www.mql5.com/en/blogs/post/734150
Über die Keltn

Uses an advanced grid algorithm with no martingale or limited Martingale (default) (version for MT5: GS grid5 ) . Defines and control the current trend; It switches himself its parameters in accordance with the current market conditions ;
Flexible customizable grid algorithm with or without martingale; Drawdown reduction algorithm (DD Reduction Algoritm); Hedge algorithm; Interactive trade control buttons; The ability to open / close orders manually; News filter to prevent trading during news

PLEASE HELP REVIEW/ SUPPORT/ SHARE THIS OTHER INDICATOR HERE https://www.mql5.com/en/market/product/51637 AS YOU DOWNLOAD THIS ONE FOR FREE. THANKS.
This Indicator is based on four moving averages and the PIVOT points. The indicator provides clarity to trading, especially in ranging markets when price is very slow and tight. You can trade intensively daily, every day with this indicator. You may decide to trade with this indicator alone and get the maximum out of the market. The indicator w
FREE
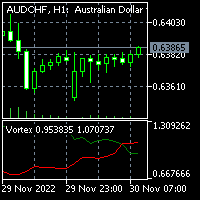
To download MT5 version please click here . - This is vortex indicator. - It is used to detect trend strength and direction. - It consists of two line(buffers). ==> VIM and VIP - There are three types of signals related to this indicator: 1. crossing VIM and VIP 2. threshold on distance between VIP and VIM 3. VIP above VIM vice versa. - This is a non-repaint indicator with light processing.
FREE

Auto ZZ SR Indicator
This indicator automatically draws trend lines using ZigZag top and bottom points. The more ZigZag tops/bottoms that are used, the greater the number of possible combinations. Therefore, the more possible trend lines can be drawn. And vice versa too. The fewer ZigZag tops/bottoms that are used, the lower the number of possible combinations. And therefore, the fewer the possible trend lines can be drawn. The indicator constantly updates the trend lines on the chart as the ma
FREE

FOTSI (Forex Overview True Strength Index) for MT4 FOTSI is an indicator that analyzes the relative strength of currencies in major Forex pairs. It aims to anticipate corrections in currency pairs following strong trends by identifying potential entry signals through overbought and oversold target areas. Theoretical Logic of Construction: Calculation of Individual Currency Momentum: FOTSI starts by calculating the momentum for each currency pair that includes a specific currency, then aggregates

The most crucial price level in any "Volume Profile" is the "Point of Control" . Is the price level with the highest traded volume. And mainly, is the level where the big guys start there their positions, so it's an accumulation/distribution level for smart money.
The idea of the indicator arose after the "MR Volume Profile Rectangles" indicator was made. When creating the "MR Volume Profile Rectangles" indicator, we spent a lot of time comparing the volumes with those from the volume profil

This indicator will show week and monthhigh low, very useful to understand the market sentiment. To trade within the range/ break out. Low- can act as support- can used for pull back or break out High- can act as resistance- can used for pull back or break out Breakout strategy refers to the day trading technique that provides traders with multiple opportunities to go either long or short . The main idea is to identify the trend in its most juicy state followed by a trending move.
FREE

Unveil the Secret to Trading with Joker's TrendMaster!
Ready to outperform the markets with a proven and reliable strategy? Look no further! Introducing Joker's TrendMaster, the revolutionary indicator crafted by Yuri Congia! With Joker's TrendMaster, you'll gain access to a powerful combination of advanced technical analysis and unique strategic insights.
Limited-time Special Opportunity: Seize the moment! Be among the first 10 (Purchasing 1/10) to seize this unique opportunity, and not
FREE
Der MetaTrader Market ist die beste Plattform für den Verkauf von Handelsroboter und technischen Indikatoren.
Sie brauchen nur ein gefragtes Programm für die MetaTrader Plattform schreiben und schön gestalten sowie eine Beschreibung hinzufügen. Wir helfen Ihnen, das Produkt im Market Service zu veröffentlichen, wo Millionen von MetaTrader Benutzern es kaufen können. Konzentrieren Sie sich auf dem Wesentlichen - schreiben Sie Programme für Autotrading.
Sie verpassen Handelsmöglichkeiten:
- Freie Handelsapplikationen
- Über 8.000 Signale zum Kopieren
- Wirtschaftsnachrichten für die Lage an den Finanzmärkte
Registrierung
Einloggen
Wenn Sie kein Benutzerkonto haben, registrieren Sie sich
Erlauben Sie die Verwendung von Cookies, um sich auf der Website MQL5.com anzumelden.
Bitte aktivieren Sie die notwendige Einstellung in Ihrem Browser, da Sie sich sonst nicht einloggen können.