Neue Handelsroboter und Indikatoren für den MetaTrader 4 - 275
I have been trading for some time now and always find it a difficulty remembering the timing of the various market opening hours at the other part of the world (especially, when it comes to daylight saving), but could not find any decent indicator online that could help. And it is for this reason that gives birth to this indicator, which I have spent much time, effort and thinking. As many already know that opening of a certain marketplace, depending on which currency pair, has an impact on the

H4 GBPUSD Trend Scalper is a trend signal scalper The EA trades according to the trend strategy using original built-in indicator for opening and closing orders. The external inputs for limiting trading on Fridays and Mondays are available. The purpose of the strategy is to use the current trend with the most benefit. According to the results of testing and working on demo and real accounts, the best results achieved by using the Н4 timeframe on the GBP/USD pair Works on MetaTrader 4 Build 971+
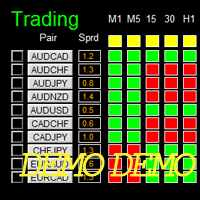
Dashboard Super CandleDemo is the demo version of Dashboard Super Candle, which have full functionalities of the paid version, except only candle of M5, M30 and H4 will be used for signal generation (full version has candle of all timeframe). To access the full version, please re-direct to this LINK .
Features Provide an intuitive way to generate trading signal, to manage trades, and to monitor trading positions. Customizable trading session: total 3 sessions can be set for autotrade. Custom
FREE
如果产品有任何问题或者您需要在此产品上添加功能,请联系我 Contact/message me if you encounter any issue using the product or need extra feature to add on the base version
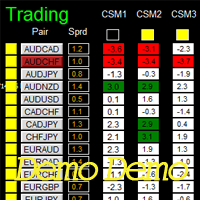
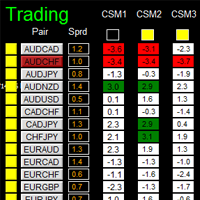
Dashboard Super Currency Strength Demo is the demo version of Dashboard Super Currency Strength, which have full functionalities of the paid version, except only 1 currency strength meter with timefrme of M30 and H1 will be used for signal generation (full version has 3 currency strength meters with full timeframe selection). Please re-direct to LINK for
FREE
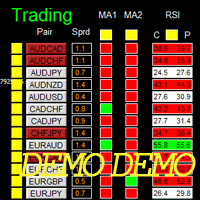
Dashboard Super MA RSI CCI Demo is the demo version of Dashboard Super MA RSI CCI, which have full functionalities of the paid version, except timeframe of MA1, MA2, RSI, and CCI has been fixed to be TF_MA1=M30, TF_MA2=H1, TF_RSI=M30, TF_CCI=M30 (full version has ability to adjust/select full range timeframe for MA1, MA2, RSI, and CCI). To access the full version, please re-direct to this LINK .
Entry Signal Refer to screenshot2 Make sure completing the following action items to make this da
FREE

Indicator based trading according to the price analysis of bars, the most popular among traders. The indicators calculated based on larger periods are used for identification of a stable trend on the market, and the ones calculated based on smaller periods are used for entering the market after a correction. The oscillators with overbought and oversold levels have a special place in indicator-based trading. The values of such indicators are subjected to wave structure - the higher waves (chart t
如果产品有任何问题或者您需要在此产品上添加功能,请联系我 Contact/message me if you encounter any issue using the product or need extra feature to add on the base version.
Dashboard Super Currency Strength is an intuitive, and handy graphic tool to help you to: Have 28 pairs under control with one dashboard. Monitor price movement, identify possible trend based on currency strength gap of two currency on 3 timeframe. Provide trading signals based on the CSM (currency Strength Meter) selected. Manage order automatically on

Constructor is a convenient tool for creating, (building strategies) testing and applying trading strategies and ideas, as well as testing and using separate indicators and their groups.
Constructor includes opening, closing, deal tracking, averaging and recovery modules, as well as various trading options with and without averaging and martingale. You are able to connect up to 10 different external indicators. Find the detailed instructions in the attached pdf file.
Trading settings
averag
FREE
如果产品有任何问题或者您需要在此产品上添加功能,请联系我 Contact/message me if you encounter any issue using the product or need extra feature to add on the base version.
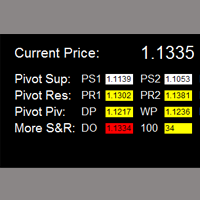
Critical Support and Resistance is an intuitive, and handy graphic tool to help you to monitor and manage critical support and resistance price point easily with one glance to know status of all important S&R. Price is likely to pullback or breakout at important support and/or resistance. This indicator is designed to help you monitor these critical sup

Unlimited Trade Copier Pro is a tool to copy trade remotely to multiple MT4, MT5 and cTrader accounts at different computers/locations over internet. This is an ideal solution for you if you are a signal provider and want to copy your trades to other receivers globally on your own rules. One provider can copy trades to multiple receivers and one receiver can get trade from multiple providers as well. The provider can even set the subscription expiry for each receiver, so that receiver will not b
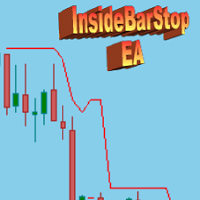
InsideBarStop ist eine exakte Implementierung der von Michael Voigt ("Das große Buch der Markttechnik") vorgeschlagenen Trailingstopp-Methode für den MetaTrader 4. Michael Voigt empfiehlt diesen nachgezogenen Stopp basierend auf Aussenkerzen und Innenkerzen für den Handel der Bewegung. Grundsätzlich wird nach einer Aussenkerze der Stopp nachgezogen, bei Innenkerzen der Stopp zurückgesetzt. InsideBarStop ist KEIN Expert Advisor, der vollautomatisch handelt und mehrere Trades eröffnet und schließt

Prometheus Smart Money is an indicator that combines both price & volume with calculations based on other custom indicators, smart volume and retail volume to create this leading indicator that gives you high probability moves to help you make a decision on what is MOST likely to happen in the market going forward Advantages You can use it in ALL financial markets including binary options on ALL asset classes or instruments. You can use it as a stand alone indicator or as a confirmation tool wit
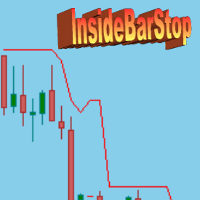
Dieser Indikator visualisiert den "Trailingstopp mit Innenstäben", den der bekannte deutsche Trader und Author Michael Voigt in "Das große Buch der Markttechnik" für den Bewegungshandel vorschlägt.
Der Trailingstopp wird als rote Linie im Chart angezeigt. Sie können den Trailingstopp zu Evaluierungszwecken an jeder beliebigen Kerze des Charts (Balken oder Kerzen) durch den Wert des Eingabeparameters "initialBarDateTime" starten
Sie können die Richtung des Trades mit dem Eingabeparameter
FREE

Tick Advisor is an intraday trading system that tries to profit during the price rollback. Martingale can be enabled, but you should be extremely careful (take profit often and at a proper time!). You can examine the Expert Advisor's trading statistics for different brokers and symbols in the MetaTrader 4 Trading Signals sections.
Parameters Risk management: enter volume - a volume for entry If the value is greater than 0 - number of lots, if less than 0 - percentage of available funds, if equ
如果产品有任何问题或者您需要在此产品上添加功能,请联系我 Contact/message me if you encounter any issue using the product or need extra feature to add on the base version.
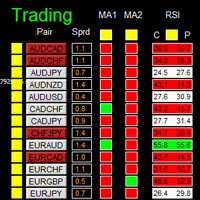
There is Demo version of this panel Dashboard Super MA RSI CCI Demo in my product list, pls try it out to get familiar with all functionalities free . Dashboard Super MA RSI CCI is an intuitive, and handy graphic tool to help you to: Have 28 pairs under control with one dashboard Monitor price movement, identify possible trend based on MA, RSI, and CCI

Keltner's colored channel indicator, also called STARC band, drawn in an additional chart window for any of the five basic indicators included into the MetaTrader 4 platform. The indicator uses the calculation technique of the three drawing options: basic, improved and modified . The first two were proposed by Keltner, the third one - by a successful trader L. Rakshe. You can search for your own optimal parameters of the indicator. It is also possible to color the upper, middle and lower bands,
The Renko (and Mean Renko) Engulfing Bar Indicator is a versatile trading indicator that plots Buy/Sell arrows and gives potential trade ideas including buy entry and stop loss levels. The indicator is designed to work on offline renko charts as well as Mean or Median Renko charts. It is recommended to use this indicator on a minimum of 20Pips fixed renko box or more. The indicator does not repaint. It prints the arrows after the bar close. The indicator's buy/sell arrows can be a powerful way t

Unlimited Binary Options Copier Remote is a powerful tool to copy binary options trades remotely between multiple accounts at different locations over internet. This is an ideal solution for signal provider, who want to share his binary options trades with the others globally on his own rules. One provider can copy trades to unlimited receivers and one receiver can get trade from unlimited providers as well. The provider can set the subscription expiry for each receiver, so that receiver will no
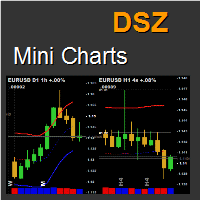
This indicator displays a bar chart for any time period and symbol. It allows to implement "top-down" investment approach. Charts have many features including unique statistical bands, rounded numbers, pivots, the elapsed time count, information about orders, change chart by clicking, saving and loading graphic objects and many others.
Key Futures Up to 9 chart per row. Unlimited number of instances. Symbol and timeframe freely adjustable for every chart. Moving Averages that have a unique met

Born to trade DAX CFD and now adapted to trade Forex . Best timeframes to use are H4 and higher . This masterpiece is extremely simple as it is. No martingale, no grids, no additional indicators, few parameters to optimize (Tolerance and Range). It has an integrated time filter which is useful to avoid some bad periods or to close any opened trades in some other periods.
Settings ShowInfo - show account info on chart. TradingOnSunday - enable or prevent trading during Sunday. MaxSpread_PAIRS -

Standard ZigZag with added alert, push notifications and email messages on breakout of the last formed HIGH - LOW! It does not consider the current extremum of the ZigZag, that is being redrawn!
Indicator Settings Depth - determines the size of the interval or the number of candles after the previous extremum of the indicator, on which it will not look for a new extremum Deviation - the number of points between the extremums (Lows or Highs) of two adjacent candlesticks to form a local bottom o
Addition to the standard Relative Strength Index (RSI) indicator, which allows to configure various notifications about the events related with the indicator. For those who don't know what this indicator is useful for, read here . This version is for Metatrader 4, version for Metatrader 5 is here . Currently implemented events: Crossing from top to bottom - of the upper signal level (default - 70) - sell signal. Crossing from bottom to top - of the upper signal level (default - 70) - sell signal
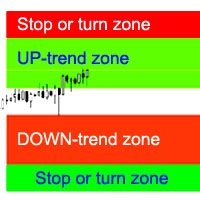
Der Indikator berechnet die wahrscheinlichsten Trendstopp-/Umkehrbereiche, zuversichtliche Trendbewegungsbereiche.
Die Berechnung berücksichtigt: die Rate der Preisänderung; der relative Abweichungswinkel des Diagramms; die durchschnittliche Amplitude der Preisbewegungen; der Preis, der seine "Komfortzone" verlässt; die Werte des ATR-Indikators. Der Indikator kann einen Alert generieren, wenn der Preis in einen Stop/Reversal-Bereich eintritt. Einstellungen Die gesamte Länge zeichnen? - Zeichn
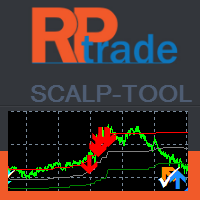
Scalp Tool ist ein sehr effizienter Gegentrendindikator.
Es ist so konzipiert, dass es von jedem verwendet werden kann, selbst der absolute Neuling im Handel kann es verwenden. Scalp Tool wird nicht neu gezeichnet. Indikationen werden von nahe zu nahe oder von nahe zu einem sichtbaren Niveau gegeben. Das Kopfhautwerkzeug kann allein verwendet werden, es sind keine weiteren Indikatoren erforderlich.
Scalp Tool zeigt an Wo Sie Ihre Trades eröffnen können. Wann sie geschlossen werden müssen.

The Expert Advisor uses a strategy based on breakthrough and two additional strategies based on sharp price changes. You can adjust the slope of the breakthrough, the distance between the breakthrough levels and the number of breakthrough levels. The Expert Advisor itself marks the levels that should be broken through. The EA includes two strategies based on sharp price changes: that is the EA opens pending Sell Stop and Buy Stop orders in case of a sudden price change in any direction and close
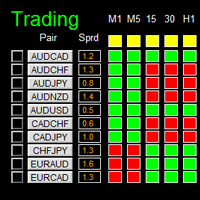
如果产品有任何问题或者您需要在此产品上添加功能,请联系我 Contact/message me if you encounter any issue using the product or need extra feature to add on the base version.
Dashboard Super Candle is an intuitive, and handy graphic tool to help you to: Have 28 pairs under control with one dashboard. Monitor candle direction, identify possible price movement and trend. Provide trading signals based on the candle direction selected by you. Automatically manage order once signal are generated. Have the ability to select which

The indicator displays Renko bars on the chart, plots two moving averages by them and generates buy/sell signals based on the conditions displayed in the screenshots and described below: the buy signal is formed if the fast moving average is above the slow moving average, from 4 to 10 consecutive bullish Renko bars are displayed, followed by no more than 2 bearish and one bullish Renko bars; the sell signal is formed if the fast moving average is below the slow moving average, from 4 to 10 conse
EMA Cross Alert is a signal indicator based on exponential moving average crossover. It will alert signal with audio or pop up on chart when 2 periods EMA cross above/below for Buy/Sell. It easy use. Help to your system trading. You can customize period of EMA for crossing alert signal, if you want. And You can ON/OFF audio alert. Indicator can use every currency pairs and every broker.
Features Period1: Short moving averages Period2: Long moving averages Audible_Alerts : ON/OFF audio alert on

Mean Reversion Supply Demand Indicator Mean Reversion Supply Demand is the indicator to detect the important supply demand zone in your chart. The concept of supply demand trading relies on the quantity mismatching between buying and selling volumes in the financial market. Typically, supply demand zone serves to predict the turning point. The wave pattern, for any supply demand zone to work as an successful trade, looks like the price must touch the base zone, move away and then return to zone
Pipfinite creates unique, high quality and affordable trading tools. Our tools may or may not work for you, so we strongly suggest to try the Demo Version for MT4 first. Please test the indicator prior to purchasing to determine if it works for you. We want your good reviews, so hurry up and test it for free...we hope you will find it useful.
Combo Channel Flow with Strength Meter Strategy: Increase probability by confirming signals with strength Watch Video: (Click Here)
Features Detects ch

This indicator is based on Market Profile methodology, which contains the Z-Zone , unlike the latter, allows visualization of multiple time frames on the same graph. This methodology has proven to be very effective for: Reduce the number of windows required to analyze or track a financial asset. Display important resistance areas (ROZ), support (SoZ) and average distribution (PoC) in different periods of time. Define areas to take profits as well locate technical stop loss. Analysis in the devel

The Navigator is a next-generation panel very easy to use. Apply this indicator on the chart to navigate very quickly through all the symbol and timeframes listed in input. The arrows manage the zoom and time frames. You can customize both the graphic colors and the list of symbols to display. A quick and easy tool that it will help to analyse the charts.
Input Values Show_TF_Panel (true/false) it permits to show/hide panel with TF and Arrows
32 symbols COLORS AND SIZE SETTINGS BUTTON_WIDTH B

Expert Advisor designed for news trading. The news are downloaded from the Forex Factory, Investing.com, myfxbook.com websites. Make sure to add the URL to the terminal settings. The EA should be attached to each currency chart. In the Symbol News field, set the currency symbol for searching news in the calendar. Example: if the EA is attached to the AUDUSD chart, set Symbol News to AUD; if USDCAD, Symbol News - CAD, XAUUSD Symbol News - USD, and so on. Change the magic number for each chart, an

This indicator studies price action as an aggregation of price and time vectors, and uses the average vector to determine the direction and strength of the market. This indicator highlights the short-term directionality and strength of the market, and can be used to capitalize from short-term price movements by trading breakouts or binary options. [ Installation Guide | Update Guide | Troubleshooting | FAQ | All Products ] Find market direction easily Confirm with breakouts or other indicators D
FREE
NearONE displays the average value of the price deviation in points for a specified period in a subwindow of a selected trading instrument.
Inputs : DRAWs - number of bars to display the indicator; NearPeriod - indicator period.
If NearPeriod is 0 , recommended periods are used for each chart timeframe.
If NearPeriod = 0: M1 timeframe - period = 60 ; M5 timeframe - period = 48 ; M15 timeframe - period = 96 ; M30 timeframe - period = 192 ; H1 timeframe - period = 96 ; H4 timeframe - period
FREE
Tipu Parabolic SAR Dashboard is based on the Tipu Parabolic SAR indicator. Please contact me here at MQL5 if you would like to use this panel for your custom signals. Tipu Parabolic SAR Dashboard is a multi-currency, multi-timeframe panel created to help traders in analyzing the markets quickly using the Parabolic SAR indicator signal. The dashboard panel is designed to help traders quickly change symbols and periods. If you are constantly missing trade opportunities while browsing through the

The Illusion EA uses the probability theory - after a series of consecutive virtual losses - i.e. right during a flat the EA already starts trading in the trend. In addition, the EA considers the ratio of bullish/bearish candles on the higher timeframes to determine the greatest probability of the price movement direction. Only 1 order can be opened at a time. In case of a loss the following order will be placed with an increased lot (the multiplication coefficient is set in the parameters). The
This multi-currency EA uses an adaptive grid strategy. It is designed for maximum effective real trading in today's market conditions. This trading robot analyzes the price action, price speed and direction. It does not require special conditions, does not depend on the trading account type, the broker, or the financial instrument. The function - total trailing stop of open position by equity in the deposit currency, points or as a percentage of profit allows to favorably close the order basket.

Multi-currency EA that works based on the economic calendar using an adaptive grid strategy. It is based on the price movement with no roll-backs. When the price moves a defined distance without changing a direction, the first trade is opened in the direction of the price movement. During the news release the EA closed untriggered pending orders and resumes its operation after the specified time runs out. The EA does not require special conditions, does not depend on the trading account type, th

The library is dedicated to help manage your trades, calculate lot, trailing, partial close and other functions
Orders CloseallSell CloseallBuy CloseallOpen DeletePending DeleteAll: Close All Market Orders and delete all pending orders. CheckOpenBuyOrders: return the count of buy orders. CheckOpenSellOrders: return the count of sell orders. CheckOpenOrders: return the count of market orders. ModifyOrder DeleteOrder CloseOrder OpenOrder
Lot Calculation Mode 0: Fixed Lot. Mode 1: Martingale Lo

Automatic lot calculation per stop level: calculates the lot considering the risk. It is possible to enter a percentage of the deposit and set the line to the planned stop level. As a result, the lot for entry will be calculated. Also, the TakeProfit level will be calculated taking into account the profit/loss ratio, and their profit/loss in the deposit currency. Thus, the final result of the trade can be seen, which is an integral part of successful trading.
Features The indicator displays th
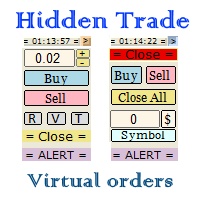
Small trading panel for managing orders and positions in 1 click for MetaTrader 4 Version for MetaTrader 5 here Set hidden TakeProfit, StopLoss and pending orders at lines placed on the chart Work on time on the news Backtesting manual strategies in the tester Placing virtual orders Playing a sound signal when the price reaches a level Automatic closing of all positions on the account or symbol by the total take profit in the deposit currency
Description Can be dragged to any part of the chart

Taranus is a multifunctional EA, a universal assistant to a trader, designed to work under the control of a trader. The EA has a large set of tools and can work: by indicators, by trading levels, by trend lines, by martingale strategy, trade on news. It has: several filters to determine the trend, a multi-level risk management system, money management, virtual stop loss, universal trailing stop, can work with any type of orders. Set files and a guide to the Taranus EA can be found in the "Commen

Enhance your trading precision with our revolutionary product, Trade Time Master Pro. This indicator provides unique insights into the duration of your active trades, offering a comprehensive view of their time in Days, Hours, Minutes, and Seconds. Indicator Features:
Time Display:
Indicator shows first 3 active trades (buy/sell trades) time duration in Days, Hours, Minutes, Seconds. Time duration means how long the order is active in the market, how long the order is running. Indicator shows

A simplistic indicator informing a user on RSI divergence by sending messages to mobile device and email. The indicator draws 2 vertical lines, marking two RSI extrema that formed the divergence. You get the alert, open the charts and make a decision. The indicator does not show past divergences, thus when you attach it to a chart for the first time you see nothing. Graphics and alerts will appear as soon as divergences do. Drop it in Tester to see how it works. Parameters: RSIPeriod - number of
By applying this expert onto any char window, you are able to force download the historical data upon all time-frame (PERIOD_M1, PERIOD_M5, PERIOD_M15, PERIOD_M30, PERIOD_H1, PERIOD_H4, PERIOD_D1, PERIOD_W1, PERIOD_MN1) of 28 major pairs. The 28 major pairs are the combination of the 8 major currencies.
8 major currencies "USD", "EUR", "GBP", "JPY", "AUD", "NZD", "CAD", "CHF"
28 pairs "AUDCAD","AUDCHF","AUDJPY","AUDNZD","AUDUSD","CADCHF","CADJPY" "CHFJPY","EURAUD","EURCAD","EURCHF","EURGBP",
FREE

The indicator displays information about:
the name of the currency pair and timeframe. current price bid. time before the close of the candle. the current difference between the ask and bid (spread). Trading volume stats can also be displayed.
Displayed data
Name, account number, and account currency. A deposit in the account currency. Balance at the current time and a percentage of the balance. Current profit and its percentage. Current transaction and the percentage of the total deposit.
FREE

Volume Levels is a very important indicator for exchange trading. Most of the trades were performed on those levels. This indicator displays the price level that had the most trade volumes over a certain period of time. Often, the price bounces from those levels in the future, and it can be successfully used in trading. This is a demo version that works only on the USD/JPY currency pair. To work on all currency pairs, install the full version: https://www.mql5.com/en/market/product/15888
Param
FREE

The EA detects strong movements using the Parabolic indicator and opens a trade. The Commodity Channel Index (CCI) is used as an auxiliary indicator. The CCI levels may depend on the ADX indicator values, which allows for better trading with different volatility. Also, the trades are opened depending on the RSI indicator values on a certain timeframe. Recommended timeframes: M5, M15, M30. Make sure to optimize the parameters of the EA for your account before trading.
Input Parameters Lots - lo
Der Indikator für Korrelation und Divergenz von Währungspaaren - alle Paare auf demselben Preisdiagramm. Zeigt alle Paare an, die im Terminal geöffnet sind.
MT5-Version
Vorteile Händler, die Handelsstrategien mit mehreren Währungen verwenden, können die Preisbewegung ausgewählter Paare auf demselben Preischart visuell beobachten, um die Parameter ihrer Bewegung zu vergleichen. Dies ist eine erweiterte und erweiterte Version des OverLay Chart Indikators
Es ist ein ziemlich effektiver A
Reanimator Halbautomatischer Handelsroboter. Zum Öffnen/Schließen von Positionen verwenden Sie die Tasten. Die weitere Verfolgung der Position erfolgt automatisch entsprechend der virtuellen Gewinnhöhe. Es wird auch ein System zur Mittelung unrentabler Positionen mit einem reduzierten / erhöhten Lot verwendet. Die Druckknopfsteuerung des Beraters im Strategietester funktioniert nicht, der Berater kann nur auf einem Demo- oder Echtkonto vollständig getestet werden. Im Strategietester kann der A

Free automatic Fibonacci is an indicator that automatically plots a Fibonacci retracement based on the number of bars you select on the BarsToScan setting in the indicator. The Fibonacci is automatically updated in real time as new highest and lowest values appears amongst the selected bars. You can select which level values to be displayed in the indicator settings. You can also select the color of the levels thus enabling the trader to be able to attach the indicator several times with differe
FREE
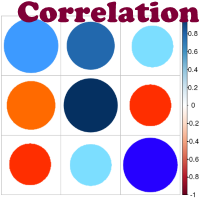
Advantage The analyzer provides an opportunity to examine correlation in history, for example, for the previous month excluding the current one, thus allowing you to evaluate symbol movement in history. It can be conveniently used in conjunction with LineSyncMirrorChart analyzer. Charts are synchronized by a market type: Forex, CFD, Futures, and Indices. The analyzer calculates the distance covered by the price on a specified period in points. The tool fits pairs and portfolio traders.
Descrip

The CCI FIBO trend indicator displays the real sentiment of the market. Does not redraw. The CCI FIBO indicator is based on the processed values of the standard CCI indicator. The indicator is able to display the slowing\reversal of the price during the trend movement (for exiting the position, and with some experience to display the opening in the opposite direction, for example, to use in scalping). It shows spikes in a flat. The idea of the indicator was that there are indicators that are goo
如果产品有任何问题或者您需要在此产品上添加功能,请联系我 Contact/message me if you encounter any issue using the product or need extra feature to add on the base version.
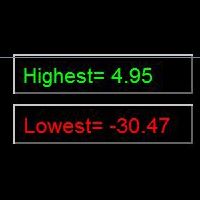
Indicator Floating Highest Lowest provides you an intuitive, and user-friendly method to monitor the floating highest (profit) and lowest (loss) that all your trades together ever arrive. For example, I opened 3 orders, which arrived at $4.71 floating profit when trade following trend. Later when the trend is against me, these 3 orders arrive $30 in los
FREE

The indicator displays a matrix of indicators across multiple timeframes with a sum total and optional alert. Custom indicators can also be added to the matrix, in a highly configurable way. The alert threshold can be set to say what percentage of indicators need to be in agreement for an alert to happen. The alerts can turned on/off via on chart tick boxes and can be set to notify to mobile or sent to email, in addition to pop-up. The product offers a great way to create an alert when multiple

The EA Gideon is an Expert Advisor that trades ON NEWS and ON EVENTS that have a strong influence on the market, but do not occur regularly! That is the EA opens Sell Stop and Buy Stop pending orders in case of a sudden price change in any direction and closes them automatically with the profit that you wish. And we all know how often the price changes when a "successful" news appears, how far it can go up or down. Also, this robot protects your deposit by placing SL with customizable parameters

The demo version of the Colored Candles indicator - calculates the parameters of each candle, as well as its volume. After that, it paints the candles depending on their strength and direction. Bullish candles are colored green and bearish candles - red. The greater the power of the bulls or the bears, the brighter the color. You can change the colors if you want. The indicator helps to analyze the price movement, as well as market entry points. The more accurate signals are formed on the higher
FREE
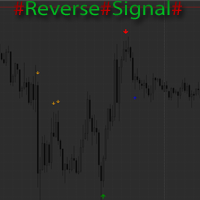
The indicator marks the estimated market reversals in the form of arrows. The indicator is able to detect 3 types of reversals. The primary reversal signal. It is a stronger and more important reversal. Denoted by the largest arrow. Alternative signal - additional signal without additional filters in contrast to the primary. Suitable for scalping on small timeframes. A mixture of the primary and alternate reversals, but with the addition of the trend filter. Also shows good results on small time
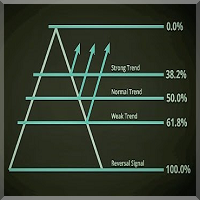
Einführung Der Fibonacci Level Professional Indikator ist ein großartiges Werkzeug für den täglichen Handel als Ergänzung zu anderen Indikatoren zur besseren Bestätigung von Handelseinstellungen und wo sich der Markt tendenziell bewegt. Dieser Indikator ist einfach einzurichten und funktioniert bei allen Währungspaaren und Zeitrahmen, M15-W1 wird empfohlen.
Zweck dieses Indikators ist es, die Fibonacci-Niveaus auf dem Chart anzuzeigen, die täglichen, oberen und unteren Linien. Als zusätzliche
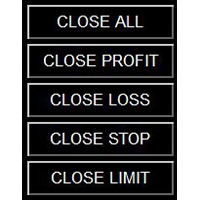
如果产品有任何问题或者您需要在此产品上添加功能,请联系我 Contact/message me if you encounter any issue using the product or need extra feature to add on the base version.
Close Button provides you an intuitive, effective, and handy way to close your orders based on their type. The utility provides seven close options: Close All: close all orders, including trading and pending ones. Close Profit: close all orders which are in profit. Close Loss: close all orders which are in loss. Close Stop: close all stop orders. Close
FREE

Elliott Wave Trend was designed for the scientific wave counting. This tool focuses to get rid of the vagueness of the classic Elliott Wave Counting using the guideline from the template and pattern approach. In doing so, firstly Elliott Wave Trend offers the template for your wave counting. Secondly, it offers Wave Structural Score to assist to identify accurate wave formation. It offers both impulse wave Structural Score and corrective wave Structure Score. Structural Score is the rating to sh

The Z-Compass is part of a suite of four indicators called the Z-Tools Black you can buy separately in the MetaTrader Market. The Z-Compass is one of the most important indicators, because it serves as a compass in the market and is composed of the following elements A histogram and zero line. The histogram is plotted with each candle and changes depending on the selected time frame. When the histogram is above the zero line, we say the trend or momentum is bullish and when it is below the zero

The Z-Beat Zone is part of a suite of four indicators called the Z-Tools Black you can buy separately in the MetaTrader Market. The Z-Beat Zone is displayed as two lines. The main line is called SlowK. The second line, called SlowD. The SlowK line is a solid gross line and the SlowD line is a solid slim line. There are several ways to interpret a Z-Beat Zone. Three popular methods include: Buy when the Z-Beta Zone (The SlowK line) falls below of the level (e.g., -40) and then rises above that le

The Z-Zone is part of a suite of four indicators called the Z-Tools Black you can buy separately in the MetaTrader Market. The Z-Zone is based on the Market Profile and includes three dynamic lines: At the top is the resistance of zone (that we´ll identify as RoZ ) In the center we find the average distribution of the area (that we´ll identify as PoC ) At the bottom is the support of zone (that we´ll identify as SoZ ) Together they make up what we call the value zone, meaning that the market mo

Two Dragon is an advanced indicator for identifying trends, which uses complex mathematical algorithms. It works in any timeframe and symbol. Indicator is designed with the possibility to customize all the parameters according to your requirements. Any feature can be enabled or disabled. When a Buy / Sell trend changes the indicator will notify using notification: Alert, Sound signal, Email, Push. МetaТrader 5 version: https://www.mql5.com/en/market/product/14906 Parameters Max_Bars_History —

As the proper trading using CCI indicators requires the trader to monitor multiple timeframes and CCI indicators with different periods. For example - monitor the trend using CCI with the period of 100 or 200 ( slow CCI period ) on the H4 timeframe, and make entries based on the CCI with the period of 13 ( fast CCI period ) on the H1 timeframe. To facilitate this task, the Delta CCi MTF7 indicator was created, which implements monitoring the changes of the price movement trends as well as marks
The Five Minutes Tester indicator is a simple tester for the Five Minutes trading system and the Five Minutes Expert EA based on binary options. Its objective is constructing a balance line on history data and calculation of statistics during CALL and PUT transactions performed by Five Minutes trading system. The tester requires at least 100 bars in history for the EURUSD instrument on the five-minute interval. But, in order to receive reliable statistical data, it requires the bars to be downlo
FREE

This panel is a part of the SupDem-Pro trading system and is used to search for the best opportunities for any available instruments. Which can be selected manually in the Market Watch (open it with CTRL + M). Using this trading panel in combination with ShvedSupDem-Pro_Zone allows to analyze multiple currency pairs with a single click. The panel allows to load any instruments from the Market Watch, from 6 major currency pairs up to all instruments (480).
The indicator parameters Button Width

Advanced and affordable momentum indicator that fade the fake move of market. It is smoothed because of special sophisticated exponential averaging calculation. It is also similar to special type of CCI with more tolerance to overbought or oversold conditions with built-in momentum indication. This indicator is able to empower your trading as a trend detector, CCI and market momentum scale measurement.
Features Smoothed to filter uncomfortable noises. Non-Lagging Exponential averaging. Line or
Der MetaTrader Market ist eine einzigartige Plattform für den Verkauf von Robotern und technischen Indikatoren.
Das Merkblatt für Nutzer der MQL5.community informiert Sie über weitere Möglichkeiten: nur bei uns können Trader Handelssignale kopieren, Programme bei Freiberuflern bestellen, Zahlungen über das Handelssystem automatisch tätigen sowie das MQL5 Cloud Network nutzen.
Sie verpassen Handelsmöglichkeiten:
- Freie Handelsapplikationen
- Über 8.000 Signale zum Kopieren
- Wirtschaftsnachrichten für die Lage an den Finanzmärkte
Registrierung
Einloggen
Wenn Sie kein Benutzerkonto haben, registrieren Sie sich
Erlauben Sie die Verwendung von Cookies, um sich auf der Website MQL5.com anzumelden.
Bitte aktivieren Sie die notwendige Einstellung in Ihrem Browser, da Sie sich sonst nicht einloggen können.