Neue Handelsroboter und Indikatoren für den MetaTrader 4 - 196

Excellent dashboard for analytics. The panel helps to analyze the values of the Momentum indicator and its signals.
With this panel you can: watch the current signal from Momentum on all timeframes; watch the current signal from Momentum for different symbols; watch the current Momentum value; several types of signals for analytics.
Values in a table cell: value of Momentum
Signal type: Momentum crosses "100" line Momentum upper/lower "100" line Momentum direction
Work option: all

Description
Range Detector is an indicator that identifies impulses in the market and displays their slope angles on the chart.
Recommendations
You can use this indicator to determine a trend and, accordingly, to determine the direction of opening a position or closing an opposite position.
Parameters
===== _INDICATOR_SETTINGS_ ===== - indicator settings
Maximum History Bars - maximum number of history bars for calculating the indicator. Average True Range Period - ATR indicator p

What is the Volume Weighted Average Price (VWAP)? The volume weighted average price (VWAP) is a trading benchmark used by traders that gives the average price an instrument has traded at throughout the day, based on both volume and price. It is important because it provides traders with insight into both the trend and value of the instrument.
What is the Difference between VWAP and AVWAP? While VWAP is having as starting point the beggining of the day,week,month etc. in the AVWAP you can plac
The Icarus Signals Continuation(TM) Indicator is a simple, but highly effective tool for identifying strong price trends, both long and short, across all time-frames and instrument types. The Icarus Continuation Indicator allows users to plot individual markers for each bar, when price has extended into a high-probability trend area, after a set level of extension. The Continuation Indicator allows users to fully optimise each of the unique Icarus settings to best fit a particular trading s

Ea with indicators ONE CANDLE ONLY 2 COPIES OUT OF 5 LEFT AT $ 99! After that, the price will be raised to $ 199.
LIVE SIGNAL and EA STRATEGY ⤵⤵⤵ https://www.mql5.com/en/users/supomo/seller#products
PARAMETER SETTING EA ⤵⤵⤵ https://www.mql5.com/en/blogs/post/744860
SETTING PARAMETERS EA ONE CANDLE VERSION:
@@, Setting_ONE CANDLE=If iClose [1] > iOpen [1] = Buy @@, EA_Indicators=1. ONE CANDLE VERSION @@, Hedging=false; @@, Use_MaxSpread=true; @@, MaxSpread=50; @@, MaxLot=1; @@, Minimal
Rsi Macd Expert Advisor uses combined signal from 2 indicators (Rsi / Macd). Minimum trading account 500. best pairs: GBPCAD / EURUSD / CADJPY / USDCHF / GBPUSD / GBPJPY / USDJPY best timeframe: 1H Setting can be define by the user: rsi levels / rsi period / macd period / risk /
there are no stop loss or take profit and the expert closes orders by the indicator signal.
developed, tested and optimized on " VantageMarkets " platform. Recommended broker > Vantage
FREE
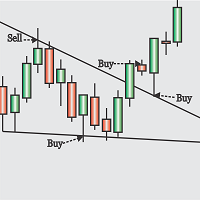
Obaforex TrendLine Trader is a tool developed to improve trading with trend lines. This tool is highly functional and yet extremely simple and safe to use. Simply draw trendlines and make them active for trading by renaming them based on what purpose you want them to serve. buy (to open a long trade based on the named line) sell (to open a short trade based on the named line) buytp (to close a buy trade at a price higher than current market price) buysl (to close a buy trade at a price lower t

The indicator is the advanced form of the MetaTrader 4 standard Fibonacci tool. It is unique and very reasonable for serious Fibonacci traders. Key Features Drawing of Fibonacci retracement and expansion levels in a few seconds by using hotkeys. Auto adjusting of retracement levels once the market makes new highs/lows. Ability to edit/remove any retracement & expansion levels on chart. Auto snap to exact high and low of bars while plotting on chart. Getting very clear charts even though many ret

PROMO PERIOD
5 COPIES SPECIAL PRICE
NEXT PRICE: 400,00
COPIES AVAILABLE: 2
EXTREME EA is a professional EA built on EURUSD pair behaviors on the FOREX market. Fully automated with the AUTO TRADE MODE and fully customable with the DOUBLE MONEY MANAGEMENT system. The AUTO TRADE MODE will use the best parameters, you need only to activate the strategy from the menu and choose your risk level. NECESSARY: YOU NEED TO ACTIVATE THE STRATEGY FROM EXPERT SETTINGS, CHECK FIRST SCREENSHOT NEC

All in One package includes the Oscillator Predictor , MACD Predictor , Thrust Scanner and Advanced Fibonacci indicators which are mandatory for applying Dinapoli trade plans.
Please visit below links for detailed explanations of indicators. Advanced Fibonacci Indicator => https://www.mql5.com/en/market/product/52834 Thrust Scanner Indicator => https://www.mql5.com/en/market/product/52830 Overbought /Oversold Predictor indicator => https://www.mql5.com/en/market/product/52621
Macd P

The indicator displays two Moving Average lines on the chart with parameters specified in the settings. It issues a signal in the form of arrows and a sound at the intersection of these Moving Average. In the indicator settings, you can set the period of fast Moving Average ( Fast MA Period ) and slow Moving Average ( Slow MA Period ). And also Shift, Applied Price, Method and Timeframe for two Moving Averages separately. Important:
The main difference from othe
FREE

Very special indicator of Joe Dinapoli which is a derivative from traditional MACD indicator. It shows the precise price, at which MACD will show line crossing and trend shifting. Also, this level is known one period ahead of time.You can constantly reassess your current position by looking at this studying a variety of timeframes. When you are in a trade, you have a feel for how much time you have for the trade to go your way by looking at the distance between the MACD Predictor line and the

Very special indicator of Joe Dinapoli which is a derivative of a Detrended Oscillator. Through a set of parametric equations, a predicting oscillator is created that forecasts, one period ahead of time, overbought and oversold conditions. The resulting predictor values are expressed as bands on the bar chart, both above and below the market. It may be mistaken as a Bollinger Band but has no resemblance to it whatsoever. The Predictor bands may be used in a variety of ways to aid in entering an
Public Signals using this EA:
https://www.mql5.com/en/signals/1016250 https://www.mql5.com/en/signals/1018964 It waits for the first executed order available and then opens a grid of pending stop orders in the same direction of the first one The first order that we usually call the master trade can be opened manually, on day and hour specified or via any other EA, indipendent from this one There is a dedicated Telegram Group with use cases and best settings here, feel free to join and as

What you can do with CandleStick CandleStick is a useful indicator for doing MTF analysis. This indicator displays the CandleStick of another time frame on the chart . By understanding the information in multiple time charts at the same time, it is easier to understand the overall market view. It is also a useful tool for validating and studying past quotes and trades. There are similar products made by others, but I designed and developed it so that it is easy for me to use.
Features of Candle

LMBFWatchlist is an interactive tool for Metatrader 4 that lets you create and manage watch lists directly on your Metatrader charts. Functionality includes: Add an unlimited number of watch lists with names of your choice Add different groups of watchlists for different time frames Add comments for symbols that always appear on the chart when that symbol is selected. Easily identify which symbols have comments against them. See watch lists instantly synchronise across all open charts that hav

Squat bar.
One of the signals of the "Trade Chaos" system of Bill Williams.
It is calculated based on the difference in price changes and tick volume.
Strengthens the signal of the "Bearish/Bullish Divergent Bar (First Wiseman)" if it coincides with it or is nearby.
Tested in comparison with the original program "Investor's Dream".
For more effective development of the system, read and see the materials of Bill Williams.
In the settings you can choose the color and width of bar. (Width: 3-if
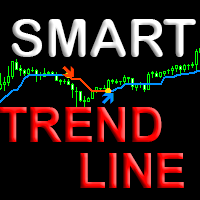
Indicator with an innovative algorithm for determining the direction of the trend. Shows the best results for determining the trend on any currency pairs, stocks, cryptocurrency without redrawing the result. It will help you immediately determine the profitability of the current pair and timeframe. Uses Price action patterns in conjunction with the author's unique algorithm. Suitable for both beginners and professionals for all types of trading. How to choose a profitable timeframe and optimize
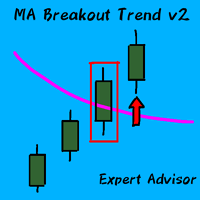
Hello guys! I want to share with you a very simple but effective expert advisor. As we know, simplicity is often the key to success :) NB: Set the quality of the video on YouTube at 720p The expert advisor is based on the breaking of a moving average, with the confirmation of the closed candle, and the possibility of adding a trend parameter that confirms the trend and avoiding false signals. Let's see the parameters:
TRADE PARAMETERS: Candle Shift Signal: this is the main parameter optimize.

Have you ever thought about how much money you pay to the broker in the form of a spread? If you calculate the size of the paid spread for all the transactions opened on your account, then the amount can be impressive. With active trading, the size of the paid environment may exceed the size of the deposit. You give your deposit to a broker. The spread can negate all the results of the trading system, as it eats up a significant part of the profit. Have you noticed that when you open a position,

Hello You can copy orders between terminals for any computer via Internet (MT4 to MT4) or (MT4 to MT5) or (MT5 to MT4) or (MT5 to MT5) it's fast Open orders Modification Stop Loss and Take Profit Close Orders This is EA (Master) put it in Experts folder you must buy (Copy orders for any computer via Internet Slave) EA too from this link if you want to copy to MT4
https://www.mql5.com/en/market/product/55097 if you want to copy to MT5
https://www.mql5.com/en/market/product/56414
Please w

Hello You can copy orders between terminals for any computer via Internet (MT4 to MT4) or (MT4 to MT5) or (MT5 to MT4) or (MT5 to MT5)
it's fast Open orders Modification Stop Loss and Take Profit Close Orders This is EA (slave) put it in Experts folder you must buy (Copy orders for any computer via Internet Master) EA too from this link if you want to copy from MT4
https://www.mql5.com/en/market/product/55096 if you want to copy from MT5
https://www.mql5.com/en/market/product/56397
Please w

The Knowledge of which Geometry aims is the knowledge of the Eternal - Plato Quant Stress Scanner is a Scientifically developed Stress detection algorithm along the geometrical lines on the price data which are quantified into Stress repulsion, fractures and clusters in a easily understandable signal form. Each signal are displayed in well-arranged with currency pairs in row-wise and timeframes in column-wise manner. Explanation of signal and plotting stress levels with trendlines are shown in
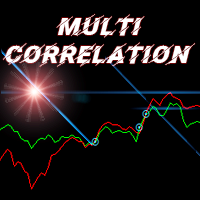
Indicator of correlation of two trading instruments.
Ideal for pair trading.
Example of use: if there is a significant divergence of correlated trading instruments, open two deals in the direction of each of them. Trades are closed when the correlation lines are crossed. Settings: First symbol (if empty - current) - The first trading instrument (if empty, the current one); Second tool (if empty - current) - Second trading instrument (if empty - current); Number of bars - Number of bars for ca

Draws Daily, Weekly and Monthly pivots and the respective supports and resistances levels (S1, S2, S3, R1, R2, R3). Ideal for placing stop losses and/or using as a break-out strategy. Features Unlike other pivot indicators in market you get very clean charts. Pivot levels are plotted irrespective of timeframe, on which you trade, i.e. M1, M5, M15, M30, H1,H4 or Daily timeframes. Pivot levels do not change when you change timeframe. Fully customizable options. If you are looking at Fibonacci
FREE

The indicator determines a special pattern of Joe Dinapoli. It gives very high probability buy and sell signals. Indicator does not repaint. Indicator Usage Buy Signal ''B'' Entry : Market buy order at signal bar close Stop : Low of signal bar Take Profit : First swing high Sell Signal ''S'' Entry : Market sell order at signal bar close Stop : High of signal bar Take Profit : First swing low Indicator Parameters Fast EMA : External Parameter (should be kept as default) Slow EMA: External Parame

The indicator scans for Dinapoli thrust pattern in multiple timeframes for a specific market. Key Features Indicator can be used for all markets It can scan for thrust pattern on W1, D1, H4, H1, M30, M15 and M5 timeframes Ability to choose number of bars required above/below displaced moving average to define thrust Able to move display label on chart by single click Parameters Minimum Bars: Least amount of bars to account for Thrust DMA Period: Moving average period DMA Shift: Number or bars re

Hello dear traders!
I present to your attention the ExincExp trading robot. The robot is based on the Price Action "Outside Bar" trading strategy.
The Expert Advisor is designed for the H1 timeframe, best suited for the EUR-USD pair. There will be not many trades, but filtering them very well, which will make only the most accurate market entries for you. The robot calculates and places stop-loss and take-profit on its own. Also, it is not based on any indicators, the EA takes all information

We know for sure that The Fibonacci sequence is a science used to calculate or estimate target distances.
How does this indicator work? 1. Tell the spread status 2. Tell me the current price 3. Indicate whether the candlestick status is bullish or bearish on each time frame. 4. Indicates the status of the past 2 candles 5. Tell Pivot Point 6. Tell the Fibonacci sequence. 7.The Fibonacci measurement can be set. 8. Pivot can be set backward. 9. Look at support and resistance.
Suitable for 1. Da
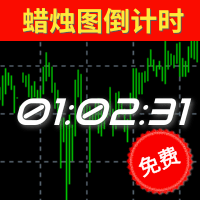
倒计时指标功能介绍 类别
解释
备注
预计结束倒计时 计算当前周期蜡烛图的结束时间(可应用于所有周期),其考虑了蜡烛图可能会因为日常休市而提前结束的情况; 如果该蜡烛图包含多个休市和开市的情况下,以最后的休市或者蜡烛图收盘时间为准。 值得特别注意的是:本指标并没有将平台额外公布的节假日休市、修改休市或者开市时间等因素纳入考虑范围,它仅仅是基于MT4所公开的交易时间做计算,无法100%确保本品种的收盘或者开盘时间无误 ,故使用者需提前明确该品种交易时间情况。
预计开盘倒计时 仅限于状态为"休市中"的提示,根据MT4上公开显示开市时间进行预估大约还有多久时间开盘; 和预计结束倒计时类似,并没有将额外公布的时间纳入考量。由于W1和MN1周期中包含多次的开盘和收盘,所以该两周期无休市提示。
【状态】 颜色 状态 备注 绿色 正常 一切正常 黄色 服务器无报价 服务器实际上传送到MT4并非是毫无中断的,可能是1分钟之内出现多次,甚至是连续较长的时间无报价,取决于您所处的网络延迟、服务器的情况等等。
本品种已有X秒无报价 MT4上并不是所有的品种的报价都是最新的,有可能某个品种长期无
FREE
TDR gbpusd is an Expert Advisor designed to trade on gbpusd and other forex currencies. Best time frame: 1h. Minimum trading account 3000. This EA trading both direction of a market at the same time and opens multiple positions. This EA have 2 main modes: safe mode(MaximumRisk=0.01) extreme mode(MaximumRisk=0.02) for 5000$ account. setting can be modify by user: MaximumRisk / ProfitFactorMain / ProfitFactorPower this EA operates only once per bar closing, fast methods of optimization are vali
FREE
Loop Pattern EA is an automatic long term strategy trader. Minimum trading account 10,000. Best performance on GBPUSD 1h. This EA calculates amount of candles back controllable by the user and applies certain function:
if (calculate_Green_Body()>calculate_Red_Body() && calculate_Green_High()<calculate_Red_Low() && newcandle()) { buy(); } ... There are no stoploss or takeprofit and the trades closes then the opposite signal arrives. this EA operates only once per bar
FREE
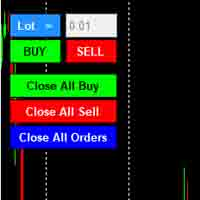
Note: This is EA only panel for manage Orders ------------------------- EA input inclde
- EA_Comment
------------------------
The panel include - Lot size input for BUY and SELL button
- Close ALL SELL orders (same symbol)
- Close ALL BUY orders (same symbol)
- Close ALL orders (same symbol)
-------------------------
You can use on any pair and any time frame
Thanks
FREE

Non-proprietary study of Joe Dinapoli used for trend analysis. The indicator gives trend signals when the fast line penetrates the slow line. These signals remain intact until another penetration occurs. The signal is confirmed at the close of the period. It is applicable for all timeframes. Inputs lnpPeriod: Period of moving average. lnpSmoothK: %K period. lnpSmoothD: %D period. *****************************************************************************
FREE

Non-proprietary study of Joe Dinapoli used for trend analysis. The indicator gives trend signals when the fast line penetrates the slow line. These signals remain intact until another penetration occurs. The signal is confirmed at the close of the period. It is applicable for all timeframes. Parameters Fast EMA: period of the fast moving average. Slow EMA: period of the slow moving average. Signal EMA: period of the signal line. ************************************
FREE

This Expert Advisor destined for trading especially EURUSD 1h pair. Minimum trading account 300. The EA uses 2 moving averages for entering the market. There are no Take Profit of Stop Loss, the orders are closed then the serten group of trades are in profit. Settings for optimization can be modify by the user: trade distance / lot / profit / fast ma period / slow ma period
developed, tested and optimized on " VantageMarkets " platform. Recommended broker > Vantage
FREE

Non-proprietary study of Joe Dinapoli used for overbought/oversold evaluation. Uses of Detrended Oscillator indicator Profit taking. Filter for market entry technics. Stop placement. Part of volatility breakout pattern. Determining major trend changes. Part of Dinapoli Stretch pattern. Inputs lnpPeriod: Perid of moving average Method: Calculation method ********************************************************************************* If you want to know market Overb
FREE

The indicator scans for stop grabber (special pattern of Joe Dinapoli which gives very high probability buy / sell signals and does not repaint ) signals in multiple timeframes for the all markets filtered and shows the results on Dashboard.
Key Features Dashboard can be used for all markets It can scan for stop grabber pattern on MN1, W1, D1, H4, H1, M30, M15 ,M5, M1 timeframes Parameters UseMarketWatch: Set true to copy all symbols available in market watch MarketWatchCount : Set the number

The Squat is a function of the range of a given price bar and the volume, or TIC volume, that occurs while that range is being created. The basic idea is that high volume and little price movement indicate substantial support or resistance. The idea behind the approach to this indicator is to first look for likely Fibonacci support and resistance and then see if Squat manifests when that point is reached. The indicator determines one of the high probability patterns of DiNapoli. It does not re

The indicator monitors the MACD trend in multiple timeframes for a specific market. No more shifting in between charts to check the trend direction while trading.
Key Features Indicator can be used for all markets Monitors every timeframe, from M1 to MN Able to move display label on chart by single click
Indicator Usage The dashboard appears to the left and upper part of the chart when attached. The shell encapsulating a timeframe goes red on a down trend, green on an up trend. If the default

The indicator monitors the Dinapoli MACD trend in multiple timeframes for the all markets filtered and shows the results on Dashboard.
Key Features Indicator can be used for all markets Monitors every timeframe, from 1 Min to Monthly
Parameters
UseMarketWatch: Set true to copy all symbols available in market watch MarketWatchCount : Set the number of symbols that you want to copy from the market watch list. CustomSymbols: Enter the custom symbols that you want to be available in dashboard. Ti

The indicator scans for Dinapoli thrust pattern in multiple timeframes for the all markets filtered and shows the results on Dashboard. Key Features Dashboard can be used for all markets It can scan for thrust pattern on MN1, W1, D1, H4, H1, M30, M15 ,M5, M1 timeframes Ability to choose number of bars required above/below displaced moving average to define thrust Parameters
UseMarketWatch: Set true to copy all symbols available in market watch MarketWatchCount : Set the number of symbols that
ConstantProX5 Expert Advisor is a fully automated forex trading robot designed to work on the most traded currency any pair. The strategy based on breaking through price levels and does not uses lagging indicators, each entry point is calculated using an advanced input filter based on the analysis of the movement of the price chart. Each order is secured by a fixed stop-loss while profits are carried out using a dynamic algorithm to capture the maximum profit. • Magic Order - is a special n

This EA has been developed, tested and traded live for XAUUSD (GOLD) H1 TF. Everything is ready for immediate use on real account. Very SIMPLE STRATEGY with only FEW PARAMETERS. Strategy is based on BREAKOUT of the HIGHEST/LOWEST channel after the consolidation. It uses STOP pending orders with FIXED STOP LOSS and TAKE PROFIT. In the strategy is used also time based exit. For every candle the pending orders are modified to adapt the market behavior. Everything is already set up for XAU

This indicator Super XT indicator.Indicator displays trend movement. Indicator calculates automatically line. Features
FiltPer - displays indicator period. Window - displays indicator trend (true/false).
Trend - displays indicator trend (true/false).
X - move the trend left and right. Y - move the trend up and down.
How to understand the status: If the Trend color is green, trend is up.
If the Trend color is red, trend is down.
////////////////////////////////////////////////////////

Mr Pip Trend indicator combines powerful price action analysis and sophisticated algorithmic data analysis to provide traders with high-accuracy chart analysis and support the decision-making process. You can use Mr Pip Trend Indicator to trade all the markets (all Forex pairs, all CFDs and Cryptocurrencies) on all timeframes! Mr Pip Trend Indicator provides chart analysis that is effective at detecting new trends but finds the exact sweet-spot between early and late entries. What is different
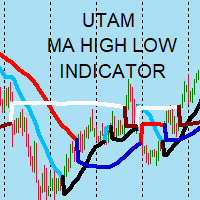
Nice Day! - A moving average candle indicates a high and low turn trend.
- MA_vonal_vastagsaga: MA_line_thickness. - MA_vonal_szine: MA_line_color. - MA_vonal_szine_long: MA_line_color_long. - MA_vonal_szine_short: MA_line_color_short. - mql5.com can also be used for my robots. Szép Napot! - Mozgó átlag gyertyájának magas (High) és alacsony (Low) fordulos trend jelzése. - mql5.com robotjaimhoz is használható.

Indicator developed with precision algorithm that seeks moments of strong trend in the markets. Reconciled with an algorithm that seeks high volume moments in the market. I recommend using timeframes M15 to H1. I also recommend an optimization to your liking for your best currency pairs. Any questions, do not hesitate to ask. Buy EA based on this indicator CLICKING HERE This is an excellent trigger indicator for your trading system. If you already operate a trend and want an indicator to show y

DataGrabber The database creator
DataGrabber store selected instrument history to .csv files. It's purpose is to automatically create extensive history database.
DataGrabber is added to the selected instrument chart window as an indicator. It periodically check presence of bar data on the server and presence of .csv files on client PC (local database). If missing files detected in local database, it's created, filled with data and added to the database.
Range of bar history in days beeing ch

The indicator allows you to trade binary options. The recommended time frame is М5 and the expiration time is 5 minutes. The indicator suitable for auto and manual trading. A possible signal is specified as a arrows above/under a candle. You should wait until the candle closes and entry the trade at new candle Arrows are not re-painted Trade sessions: Any Currency pairs: ( recommended) EUR/NZD Working time frame: M5 Expiration time: 5,10,15 minute Up buffer: 1, down buffer: 0 *** Use with b

This type of arrow indicator works without redrawing signals. The signal on the indicator is shown as arrows (in the direction of movement). It is very simple and effective to use in the Forex market. Type of trading: "Scalping" It is applicable and performs well in intraday trading, as well as long-term trading. Сигнал на индикаторе показан в виде стрелок ( по направлению движения).
Очень прост и эффективен в применении на рынке Форекс.
Вид торговли: " Скальпинг"
Применим и хорошо себя по

This is a price action trading robot, the EA will stick to the medium term trend and price to deliver trades. Orders are always protected by the user set stop loss points. With the capital management system, it will help that EA operates in accordance with its purpose. Telegram : https://t.me/trungtqIT Timeframe is H1. Minimum account balance: $100. Attention is Important: EA only test live on demo or real accounts. Backtest results are just random and inaccurate.
Features: Every trade is prote

+++++++++++++++++++++++++++++++++++++++++++++++++++++++++++++++++++++++++++++++++++++++++++++++ This Robot is fully automated and has been created for everyone. The Robot works also on cent accounts. =============================================================================================== You also have more trading options -fixed TP and SL -trailing -exit by opposite signal -Martingale
=> works on all Time Frames from 1Minute to 1Day => On the lower Frames there are too many small trade
This EA has been developed, tested and traded live for EURUSD H1 TF. Everything is ready for immediate use on real account. Very SIMPLE STRATEGY with only FEW PARAMETERS. Strategy is based on DAILY OPEN BREAKOUT. It enters if volatility raise after some time of consolidation . It uses STOP pending orders with ATR STOP LOSS. To catch the PROFITS there are BREAKEVEN and TRAILING STOP functions in the strategy. In the strategy is also used some TIME EXIT logic . For every candle the pending o

专注交易 XAUUSD ,其它x想好了再说。。。。。。。。。。。。。。。。。。。。。。。。。。。。。。。。。。。。。。。。。。。。。。。。。。。。。。。。。。。。。。。。。。。。。。。。。。。。。。。。。。。。。。。。。。。。。。。。。。。。。。。。。。。。。。。。。。。。。。。。。。。。。。。。。。。。。。。。。。。。。。。。。。。。。。。。。。。。。。。。。。。。 。。。。。。。。。。。。。。。。。。。。。。。。。。。。。。。。。。。。。。 。。。。。。。。。。。。。。。。。。。。。。。。。。。。。。。。。。。。。。。。。。 。。。。。。。。。。。。。。。。。。。。。。。。。。。。。。。。。。。。。。。。。。。。。 。。。。。。。。。。。。。。。。。。。

非常好用的工具8888888888888888888888888888888888888888888888888888888888888888888888888888888888888888888888888888888888888888888888888888888888888888888888888888888888888888888888888888888888888888888888888888888888888888888888888888888888888888888888888888888888888888888888888888888888888888888888888888888888888888
FREE

MT4 Alert to Telegram MT4 Alert to Telegram is tool, which sends selected trades to telegram channel. Tool sends trades when open and close with chart to telegram channel. Tool can send multiple charts and pairs from a single chart. Send information of all type of orders: Opened (including Pending Orders), and closed triggered.
functions - user can custom self-sending message text even in their native language - user can send own advertisement text periodically - attach expert in one chart an

EA Amg это комбинация нескольких торговых систем, основа советника это скальпирование, вместо стопа советник использует усреднение, советник является высокодоходным в связи с чем и высоко рискованным, алгоритм выхода из рынка позволяет переживать длинные безоткатные движения с небольшой коррекцией. Варианты защиты депозита встроенные в AMG 1) Параметр MaxTrades ограничивает колличество максимально открытых ордеров. 2) MaxLot Ограничивает максимальный лот в торгах советника. 3) DrowDoun процен

TorN ( Trend or Not ) has been made from ADX problem on fixed level. Only fixed level is hard to find trending or not. Now I find the better method to analyze ADX with MA . You can use this signal to confirm your trending strategy. (Or use it to find Sideway)
The best signal is signal line get higher than MA line and fixed level. ( Recommend to use level value same as ADX period or higher ) If signal line lower than MA line on Any level is mean weakening trend.
Please be aware that thi

This experts helps you with increasing your signal volume. Everytime the signal opens a trade, the experts creats a specific amount of copies of this trade. Evertime the signal closes a trade, the expert closes all the copies of the singal trade.
Input parameters: - amount_of_copies: The amount of copies the expert should create - interval_in_seconds: How often the expert should look for new orders to copy or closed orders, to close copies - lot_size_of_copies: The lot size of the new copies

Diese Anwendung exportiert alle abgeschlossenen Operationen in eine Textdatei, die durch <TAB>, Komma, Semikolon oder ein beliebiges vom Benutzer definiertes Zeichen getrennt ist, einschließlich der Kommentare und der magischen Nummer der Operationen, die einfach in EXCEL oder Google Spreadsheets exportiert werden können.
Die Dateien werden im Ordner "files" generiert, einzeln getrennt nach Monat mit dem Namen im Format: 999999-AAAA BBBB- [9-9999] wobei:
999999 = MT4-Handelskontonummer
AAAA

Präzises Nachtscalping & Smart Grid System True Range Pro steigt in der Nachtsitzung in den Markt ein und verwendet Indikatoren, die auf der Grundlage von maschinellem Lernen modifiziert wurden, um eine Position zu eröffnen. Ein dynamisches Orderraster kann angewendet werden, wenn sich der Preis gegen offene Positionen bewegt. Die spezielle Active Order-Option erhöht die Leistung erheblich, wenn die Anzahl der offenen Positionen steigt. Die Optionen Trailing Stop und Drawdown Stop können zum zus

This is an analogue of the Virtual Stop Loss / Take Profit
Features: automatic closing of trades by profit/loss points/money the number of deals and the total profit for the Symbol
Auto close deals by profit / loss (analogue of virtual StopLoss / TakeProfit): mode: Off; by profit / loss in points by profit / loss in the deposit currency Types of deals: Buy and sell only Buy only Sell set conditions for closing by profit per trade set conditions for closing at a loss per trade
Attention: thi

Lancelot HEETS
1. ist ein Expert Advisor der versucht kleine Kursschwankungen zu verarbeiten ( Scalping) 2. falls er den Take Profit nicht bekommt startet automatisch ein Wiederherstellung Algorithmus 3. Der EA startet von vorn Der "Lancelot HEETS" erzielt eine erstaunliche Leistung zu einem moderaten Risiko und ist gleichermaßen für Anfänger und fortgeschrittene Trader Geeignet.
Ein EA aus dem Hause Forex Soul

Features: fast opening / closing deals the number of deals and the total profit for the Symbol
Fast open deals: set the Lot volume set StopLoss / TakeProfit in points (if you set "0", then it is not used) set slippage set Magic (if necessary) set comment (if necessary)
Fast open features: fast open Buy fast open Sell fast close ALL open orders for the current Symbol
Attention: this utility works only on the current instrument this utility works on a VPS must enable Algo trading in the termi
FREE

A bot for trading in binary options for mql4.
He can do send message in mobile of phone.
He can do work in several long time-frame.
He can modify main analize.
He do displey panel of the bot and modify her you can.
He have do display of tick grafic in 15 min and more(time of timeframe).
He can modify a small main analize.
He can modify a dimension of smal main analize.
He can modify the advanced analize.
He can modify a small advanced analize.
He can modify a dimension of smal advanc

Features: fast opening / closing deals automatic closing of trades by profit / loss the number of deals and the total profit for the Symbol
Fast open deals: set the Lot volume set StopLoss / TakeProfit in points (if you set "0", then it is not used) set slippage set Magic (if necessary) set comment (if necessary)
Fast open features: fast open Buy fast open Sell fast close ALL open orders for the current Symbol
Auto close deals by profit / loss (analogue of virtual StopLoss / TakeProfit): mo

MACD Dashboard Panel This indicator helps you to scan symbols which are in the Market Watch window and filter out a trend according to MACD.
Moving Average Convergence Divergence (MACD) is a trend-following momentum indicator that shows the relationship between two moving averages of a security’s price. The MACD is calculated by subtracting the 26-period Exponential Moving Average (EMA) from the 12-period EMA.
The result of that calculation is the MACD line. A nine-day EMA of the MACD called
FREE
Please use the 15-minute USD/JPYchart ※Before using, the parameters Nomallots = lot quantity and Maxspread = spread filter are set to pass the product test, so please change to the appropriate values when you use it. The narrower the spread, the better the results, so we recommend using it with a broker with a narrow spread. <When did you finish? > ・When you reach a certain profit-taking value and loss-cutting value, we will settle. By default, Stop loss Buy 25 PIPS Sell 65 PIPS Take Profit B
It is a judgment tool that judges trends in 1 minute and supports discretionary trading.
Various usages 1. It is used to recognize the environmental advantage of buying or selling with the color of the line. If the line is red, it is advantageous to buy. If it is blue, it is advantageous to sell. Neither if there is no line. 2. Used as a guide for entry by signing the entry. Red arrow long Blue arrow short 3.Used as a guide for closing (Even if there is no entry sign, the close point will be s
Der MetaTrader Market ist die beste Plattform für den Verkauf von Handelsroboter und technischen Indikatoren.
Sie brauchen nur ein gefragtes Programm für die MetaTrader Plattform schreiben und schön gestalten sowie eine Beschreibung hinzufügen. Wir helfen Ihnen, das Produkt im Market Service zu veröffentlichen, wo Millionen von MetaTrader Benutzern es kaufen können. Konzentrieren Sie sich auf dem Wesentlichen - schreiben Sie Programme für Autotrading.
Sie verpassen Handelsmöglichkeiten:
- Freie Handelsapplikationen
- Über 8.000 Signale zum Kopieren
- Wirtschaftsnachrichten für die Lage an den Finanzmärkte
Registrierung
Einloggen
Wenn Sie kein Benutzerkonto haben, registrieren Sie sich
Erlauben Sie die Verwendung von Cookies, um sich auf der Website MQL5.com anzumelden.
Bitte aktivieren Sie die notwendige Einstellung in Ihrem Browser, da Sie sich sonst nicht einloggen können.