Neue Handelsroboter und Indikatoren für den MetaTrader 4 - 129

[75% OFF! - SALE ENDS SOON] - RevCan Trend Entry Point is a trend based trade alert indicator for serious traders. It does all the price and chart analysis all by itself, and whenever it finds any potential high quality trading opportunity(Buy or Sell) using its revolutionized price prediction algorithms, it sends instant trade alert directly on the chart, MT4 terminal and on the mobile device. The trade signals will be visible on the chart as Up and Down arrows, while the instant audible aler

Developed methods for trading collected in one indicator. In the form of arrows, it defines entries in the direction of the trend.
It has 2 types of arrows - trend and signal guides, informing about the potential movement in the direction of the trend.
Works without redrawing, ready for use on all symbols/tools.
The most suitable time frames to use are M15, M30, H1, H4.
How to use
The indicator finds the direction of the trend in the form of a signal arrow, a graphic rectangle stretches along
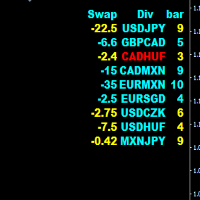
Divergence HiLo scaner is a good tool for market analysis. The indicator looks through all currency pairs and finds those that meet the selection conditions, where corrections or reversals to the main movements are supposed to begin. The indicator values are entered in the final table. 1 value is swap 2 Currency pair. 3 The number of bars after finding the selection conditions. The bar color blue is used for the buy signal. The bar color yellow is used for the sell signal. The color of the
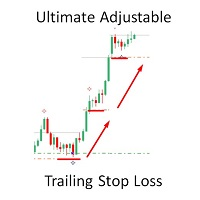
Get The Most Out Of Your Trades! Spreads from 0.1pip RAW/ECN Accounts, click here .
No More Sitting And Watching Your Trades All Day!
Have you ever … ??? Had a trade go into good profit only to turn round and lose? Had a trade where you could have got more profit because your Take Profit was too tight? Wondered how to get the most out of your trades in a trend? Of course! We all have!
Before, you had to sit and watch your trades … and trail by … A fixed amount of pips – easily done on MT4.
Expert Advisor Stop and Reverse Cut Switch Hedge based on Parabolic SAR indicator. There are two setting in EA: 1. Cut Switch 2. Hedging
Recommended settings: TimeFrames = H4 Risk = 0.1 Minimum Balance = 1.000 MaxToBep = 4
Main Parameter Description: - Hedging Mode False = Cut Switch True = Hedging - Max Martingale Level = Lot / Volume will reset after "n" Losses - Risk = Based % of Balance -MaxOP to BEP = Target BEP will be active if there is a certain number op open position - Percent BEP
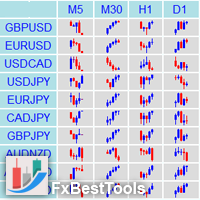
Definition : Market View is a dashboard (scanner) to view price graphs of all symbols and all timeframes at a glance. The utility is designed user friendly and added a wide range of customization options.
Main features of Market View : Visual settings window on the chart Customizable list of symbols and timeframes Different shapes : Real Candles, Schematic Candles, Arrows Customizable number of candles Changeable size of dashboard (scanner)
Highlight timeframes with gaps on candles Open approp

The utility allows you to open, monitor and manage open positions on the forex market and only on instruments in which it is possible to create triangulations or those instruments that share the same currency in the numerator or denominator:
ex: EURSUSD --- GBPUSD --- EURGBP The help of operational lines and valuable information on the panel allow the trader to manage trades more easily. Recommended for novice and experienced traders.
External variables
CrossSymbol = choose the cross on which

The EA opens two opposite orders, one of which is always closed with a profit , then the next pair of orders is placed. If the price goes in one direction, the adviser starts to increase profits, and losing trades increase the next lot, thereby closing all trades at the minimum profit. The Expert Advisor is well suited for overclocking a deposit on a cent account. Can be used on any pair.
Options: Max Spread - Spread limit for opening the first orders. Lot - initial lot. MaxLot - Maximum lot. P

Target Striking - One of the best binary options trading tools!
It is set up so powerfully that you can trade not only on currency pairs, but also on raw gold oil!
You can also try on cryptocurrency!
Ideal for trading on currency pairs, the percentage of reliable transactions is more than + 75%
The trading tool is already set for the best profit!
Only Target Striking can unlock the potential of the trading market for you!
With it, the signals are even and accurate without redrawing, a sig

CHART OBJECTS: Blue box : Bullish Order Blocks (OB) Red box : Bearish OB Orange box : Mitigated OB. Price bounce from this area the made a new high/low Light gray box : Price bounced from this area but did not made a new high/low Dark gray box : Broken OB. Filled boxes : TimeFrame 1 Order Blocks
Unfilled boxes : TimeFrame 2 Order Blocks
INDICATOR SETTINGS: Order Block Required Length: Required number of subsequent candles in the same direction to identify Order Block. Default value: 5 Imba

Only 5 copies of the EA left at $ 150 ! Next price --> $ 320
King Pro EA is an automated trading system that adapating itself on whatever the market conditions are. Mainly using averaging & EMA indicator results to train the EA which direction should it trade. Also it will apply early cut loss system when market strongly change direction and recover it on current trend.
Recommended currency pairs: GBPUSD Alternative currency pairs: EURUSD / XAUUSD Recommended timeframe: M30
See EA Liv

PRICING - Launch promotion: $98,00 - Next price: $148,00
MAIN FEATURES
- Index Master is a 100% automated system. - Not martingale! Not grid! No dangerous strategies are used! - Every orders has a StopLoss and a TakeProfit. - Recommended broker : low spread; low comission; not market maker: https://bit.ly/38hfs2D - Designed for US30 - USTEC and USD500 at timeframe M1. - Live signal : https://www.mql5.com/pt/signals/913370
SETUP
- No need set files . Just attach to the following cha

IMPORTANT; Price is subject to rise at any time from now! Do not miss this offer! Dear trader I am glad to introduce my new tool called Trend Analyser Dashboard to you. The design, style, and settings of this indicator have been made simple to make its users not take too much time in understanding the indicator itself. The purpose is to help traders in analysing the direction of the major trend and the status of the trend whether in weak trend or its strong trend. The indicator will also prov

This is a multi time frame demand and supply indicator for MT4 platform. You can use multi time frame demand and supply levels on smaller time frames. Additionally you can choose to kill every level has has been tested. you have narrow bands that is you can select the whole demand and supply level or just a narrow section Finally, you also get price range for the zones. Awesome
FREE

MAIN FEATURES
- Index Master is a 100% automated system. - Not martingale! Not Grid! Not Hedge! No dangerous strategies are used! - Every orders has a StopLoss and a TakeProfit. - This Expert will win and will lose but in the long run will produce a good profit with quite low temporary drawdown. - Recommended broker : low spread; low comission; not market maker: https://bit.ly/38hfs2D - No need set files . Just attach to the following charts and let it work. - Designed for US30 - USTEC and
FREE

Questo Expert Advisor è un professionale EA il quale sarà sempre aperto. Userà diversi indicatori, tra cui il parabolic Sar. Attualmente è possibile fissare il numero di lotti (0.20 di defoult); Non usa Martingala, non usa grid o altri sistemi rischiosi. Provalo in demo. Ottimi risultati su tante coppie di scambi. Consiglio di non usarlo su leva altissima.
FREE

GBP Scalper 02 is a simple EA that can work automatically to carry out trading activities. Like the previous version (GBP Scalper 01), this EA is kept simple and only requires Lot, TP, and SL settings to use.
As the name implies, this EA is only suitable for trading with the GBPUSD pair, and is designed to work optimally on the H4 time frame. GBP Scalper 02 is an upgrade from the previous version with the addition of various internal functions to enhance the EA's ability to earn profits and pr

''SKPredict'' Show you next prediction of Close/High/Low/ Open Level. This indicator Used mathematical calculations . It means, that based on the previous movement of the market, the price movement is expected to be in predicted Level. Also you can See, what Happened in previous Data and Predictions and use Buffers to write your EA. Also In ' Tendency indicator '' , as full package of Predictions that every Trader need, there is the Predict line to show you the future of Price.

Improve trading with this indicator. Find areas of buys or sells in Fibonacci retracement areas. Fulltrend is for scalping and making swing trades. Fib levels are added for take profits and stop losses. This works on any time frame and can be used by itself or together with other systems and indicators for filters. The indicator doesn't repaint. Alerts are added and can be true or false. No need to sit glued to the computer, just set on charts and listen or the alerts to come. Take a posi

Golden Bull ea mt4 is a EURUSD 1h trend EA developed by our team for 3 years.
EURUSD 1h EA is a typical trend EA that is fully automatic and stable with multiple indicators.
No scalping, no grid, no martingale, suitable for most brokers EURUSD 1h
Working pairs :EURUSD Recommended account type – any account type Minimum lever: 1:30 even 1:20 Working Timeframe: H1 Minimum deposit: $1000/lot 0.1 VPS is recommended Features:
Not a martingale, arbitrage, hedge or other dangerous methods of m

Keep missing the Imbalance or always Enter late?
Imbalance Sniper Entry EA is a bot that provides the perfect entry on Imbalance, the bot comes with a built in 1:2 Risk Reward, however the bot is not designed to run on its own, even though it can , it is best to keep an eye on it once awhile with the right indicators as support you can make sure it stays on track or take your profit before it turns.

Fibonacci retracements are trend lines drawn between two significant points, usually between absolute lows and absolute highs, plotted on a chart. Intersecting horizontal lines are placed at the Fibonacci levels. Fibonacci retracements are useful tools that help traders identify support and resistance levels. With the information gathered, they can place orders, identify stop-loss levels, and set price targets. Although useful, traders often use other indicators to make more accurate assessments

Unterstützungs- und Widerstandsstufen von svidoks
Dieses Dienstprogramm zeichnet Unterstützungs- und Widerstandszonen, auf die der Preis gut reagiert. Es hat auch einen Trendindikator, der auf der Grundlage von Unterstützungs- und Widerstandszonen arbeitet. Sie können mit dem Indikator-Berater sowohl manuell als auch automatisch arbeiten (es gibt auch ein externes Bedienfeld). Gruppe für Unterstützung, Sie können auch Ihre Wunschliste und Wünsche schreiben - Telegramm-Chat Unterstützt alle Wäh
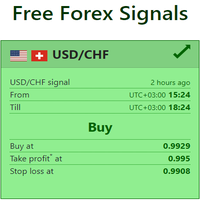
Live Forex Signals ist für den Handel mit den Signalen der Website konzipiert https://live-forex-signals.com/en und https://foresignal.com/en . Live Forex Signals for MetaTrader 5 https://www.mql5.com/ru/market/product/81448
Daten Username und Password wenn Sie ein Abonnement für Websites haben live-forex-signals.com/foresignal.com . dann sollten Sie diese Optionen mit Ihren Anmeldeinformationen ausfüllen. Wenn es kein Abonnement gibt, lassen Sie die Felder leer; Comment Kommentar zu of

Die Aufgabe des Versorgungsunternehmens besteht darin, die Arbeit anderer Berater zu allen Instrumenten zu analysieren, um einen Rückgang der Einlage zu verhindern. Bei Überschreitung der angegebenen Parameter kann „Equity Protection“ eine Position sperren, schließen und eine Benachrichtigung darüber senden. „Aktienschutz “ kann auf das aktuelle Symbol oder auf alle Symbole angewendet werden. Mit der integrierten Funktion können Sie ausstehende Positionen entfernen und auch andere Berater schlie

Handelsroboter auf dem MACD-Indikator Dies ist eine vereinfachte Version des Handelsroboters, er verwendet nur eine Einstiegsstrategie (die erweiterte Version hat mehr als 10 Strategien)
Vorteile für Experten:
Scalping, Martingale, Grid-Trading.
Sie können den Handel mit nur einer Order oder einem Orderraster einrichten. Ein hochgradig anpassbares Auftragsraster mit einem dynamischen, festen oder Multiplikatorschritt und einem Handelslot ermöglicht es Ihnen, den Expert Advisor an fast jedes

MACD-Oszillator mit fortschrittlicher Trendfilterung und Alarmanzeige. Es ermittelt den Trend, schwache Trends werden herausgefiltert und neue Stärke im Trend angezeigt. Der MACD-Oszillator funktioniert in jedem Zeitrahmen und auf allen Symbolen (Währungen, Indizes, Öl, Metalle, Aktien, Optionen, Offline-Renko-Charts). 1. Der Benutzer kann den MACD-Wert ändern, 2. Mindest-MACD-Level-Filter, 3. Wert dividieren filtert das Leistungsverhältnis heraus, mit dem eine Trendänderungsanzeige auf einem be

50% off. Original price: $60 Order Manager is a trade assistant and trade copier with a money manager that helps traders open, modify and close manual trades and also copy their trades between multiple accounts in the most simple way to help them focus more on their market analysis and open orders with just a few clicks.
Download Demo here (It only works on demo accounts) Full guide here MT5 version here
Order Manager features: Works on all instruments such as currency pairs, indexes, CFDs
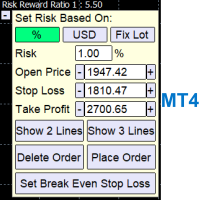
A Trading Assistant EA that can place order at user's desired open, stop loss, and take profit prices with automatically calculated lot size based on user's risk per trade
$30 for the next 25 downloaders, next price: $45 Try it out on demo account for free: Download Demo
Features: Smart Place Order : Automatically determine the Type of Order (Market/Stop/Limit & Buy/Sell) to be placed based on Open, and Stop Loss Price input, then execute it immediately Risk Manager : Set your risk of loss o
D1 Free Fibo Channels with support and resistences...
Become a constantly profitable 5-star forex trader!
We offer a few indicators to support you understand and analyse the market! With our strategies you will improve your trading system and bacome an expert...
We have indicators for trend direction, market direction and others.. for multi-time frames and that covers all majors or your favorite trading symbols! Some of them offer a customizable calculation parameters... or Graph features!
FREE
The EA uses scalping strategy at night, trading consists of three algorithms and each algorithm works in its own time interval. The EA uses many smart filters to adapt to almost any economic situation. Pending orders are used for the least slippage when trading scalping. The adviser is safe and does not require any settings from the user, just install it on the chart and you are ready. The EA sets a protective stop order, so the trader does not have to worry that the robot will allow significant

The automated expert advisor that builds a grid of orders based on my developed algorithm. The initial lot of order can be fixed or dynamically calculated, depending on the deposit balance and the risk parameter used. To prevent opening trades at a high spread value, the EA has a corresponding filter. You can specify the maximum allowable value in the settings. The internal algorithm of work and settings of the expert advisor for Short and Long trades are completely identical. Thus, the expert

I will support only my client. สำหรับลูกค้า Some Features: - Swing or ZigZag or Sideway trading - No News filter to high impact news, It will dash with Martingale with Position Percent from Lot size starter,
Increase / Decrease via amount of position on chart. - You can run it on sideway chart at current timeframe or H4-D1 timeframe. - If chart has trend don't worry with your small lot size starter and frequncy and your funding. - You can always consult with me on how to use it via chat.
Wa
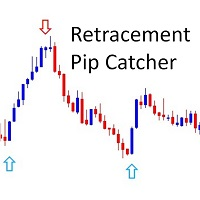
!! FLASH SALE !! Over 80% off !! For ONE week only. Now only $47 - normally $297! >>> Ends on 30 June 2023 - Don't miss it!
Buy and Sell Arrows when price is about to retrace. It Also Sends Alerts – On MT4 To Your Phone To Your Email
Does not repaint.
Works ony any pair, any timeframe.
10 Activations allowed so you are free from limitations
See an example of alerts from today (23 May 2020) using this and 2 more of my indicators here . MT5 Version here . Spreads from 0.1pip RAW
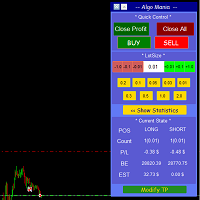
This is a trade manager specially for traders using martingale strategy and multiple trades at the same chart.
features: - easy and fast to set the lot size with mouse clicks. - Close all trades and close profit trades with a single click. - Show details on the running symbol: - number of trades (long - short) and total lots of each direction. - total profit/loss on this symbol separately and for both directions. - Break even point for both long and short. - Estimated profit if all the trades
FREE

Multipair Analyzer - An expert advisor which analyze market structure across multiple currency pairs.
Its a tool which uses purely price action structure based trading strategy. Based on the market structure, the EA finds the optimal place to enter and can either take trade or can alert the user to take a better look. Just by placing the EA one one chart, all the other currency pairs are automatically analyzed. Based on its analysis it provide multiple messages . These messages can be easil

The indicator helps to determine the potential for price movement within the day and on a trend. For calculations, the average price movement on the instrument is used. If you have a problem setting TP, the indicator allows you not to overestimate your expectations. For volatile instruments, the SL position can also be taken into account. If the entry was in the right place, the risk / reward ratio will prompt a profitable level for profit taking. There is a reset button at the bottom of the sc
FREE

Trend indicator Trend Esay MTF is an indicator that draws arrows directly on the price chart. Like every trend indicator, it works well with good price movement and worse in a flat. A feature of this indicator is the ability to send alerts both in the terminal and on a smartphone. The indicator menu contains the number of bars in the history of the indicator and period value for determining the trend. The "trend" function has been added to the indicator menu, which filters the indicator signals
FREE

For the correct operation of this Expert Advisor, a minimum trading spread is required. 15 points on the 5th sign is optimal. The smaller your spread, the better the trading will be. The Expert Advisor opens a buy or sell order only after a strong activity has been formed in the market. The basis of the strategy is an indicator for scalping - Scalping Dong. The robot has more than 60 settings so that you can efficiently manage your trading strategy. Recommendations: Trading on any trading pairs

Only 7 copies of the EA left at $ 150 ! Next price --> $ 320
Yolo EA is an automated trading system that adapating itself on whatever the market conditions are. It can follow strong trend / counter trend / neutral.
Recommended currency pairs: GBPUSD Recommended timeframe: M15 Recommended session: London Session (10.00-18.00 GMT+2)
Backtest (2020.06.04 - 2022.04.19) results showing that it can grow $1,423 account into $2,423 with maximal drawdown 12.33% only.
Notes: Can be used for any b

Pomo Panel is a simple panel to help trader using grid strategy. It is designed with grid strategy in mind.
Its features: Open standard transactions Set up pending transactions Delete all pending transactions Modify multiple Stop-Loss and Target-Profit Calculate Lots of all opened transactions Calculate average Open-Close, High-Low Close All Opened Orders
MT4に表示している同一通貨ペアのチャート上で、水平線や垂直線、トレンドラインなどのオブジェクトを同期します。 このインジケーターを使うと、1つの時間足で作成した水平線などのオブジェクトが、同一通貨ペアの他のチャートにも同じオブジェクトが作成されるようになります。また、作成後の移動、プロパティ変更、削除なども同期することができます。
チャートオブジェクトが同期されるケース
・チャートオブジェクトの作成 ・チャートオブジェクトのスタイル変更(色、太さなど) ・チャートオブジェクトの移動 ・チャートオブジェクトの削除
対応しているチャートオブジェクト
以下24のオブジェクトに対応しています。 ・水平線
・垂直線
・トレンドライン
・平行チャネル
・フィボナッチリトレースメント
・フィボナッチ・エクスパンション
・フィボナッチ・チャネル
・フィボナッチ・タイムゾーン
・フィボナッチ・ファン
・フィボナッチ・アーク
・角度によるトレンドライン
・アンドリューズ・ピットフォーク
・標準偏差チャネル
・線形回帰チャネル
・サイクルライン
・三角形
・長方形
・楕円
・ギャン・ライン

Parabolic SAR extreme When the Parabolic SAR value indicates an uptrend or downtrend, the EA will open a buy or sell trade respectively, given that all other criteria are met This EA allows you to set up to 21 separate Parabolic SAR criteria for the EA to work on There are 3 input parameter sets (SAR1, SAR2, and SAR3) Each set allows you to determine the parameters (such as the step and max step) for each set And within each set, you get to indicate up to 7 timeframe for the EA to operate in
FREE

[ MT5 Version ] Ultimate Alpha Trend MT4
Ultimate Alpha Trend is the first trend indicator, which combines volatility, volume, average price and momentum. The results is a highly versatile representation of trendy and sideways market conditions, highlighting, at the same time, significant supply and demand levels. The Ultimate Alpha Trend indicator can be used to find entry oportunities and to set SLs taking into consideration current market volatility, volume and momentum. Besides that, the ind
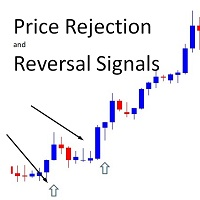
!! FLASH SALE !! Over 80% off !! For ONE week only. Now only $47 - normally $297! >>> Ends on 30 June 2023 - Don't miss it!
Buy And Sell Signal Arrows On The Chart When The Price Is About To Reverse. Also Sends Alerts – On MT4 To Your Phone To Your Email.
Does not repaint.
Works on any pair, any timeframe. (Just ajust the settings for your pair and timeframe.)
10 Activations allowed so you are free from limitations
MT5 version here . Spreads from 0.1pip RAW/ECN Accounts,

Imbalance / Fair Value Gap (FVG), this is a zone / gap created when the price move with force in a given direction. It identify a zone where the price could potentially go back. This gives perfect targets for your trades.
Imbalance is created from the high and low of 3 candles. When the wicks the of 1st and 3rd candle does not fully overlap the middle one.
This indicator will help you to easily spot mitigated/unmitigated imbalances in your chart.
NEW FEATURE Update: Multi-TimeFrame Feature
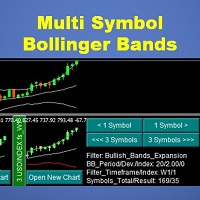
This indicator will display mini candlestick chart with Bollinger Bands indicator of the symbols that pass a filter criteria in the indicator subwindow from 1 to 10 symbols per subwindow. Feature:
Button to scroll 1 symbol, click to scroll the displaying symbols back and forth 1 symbol per click Button to scroll 1 page , click to scroll the displaying symbols back and forth 1 page(number of symbols per subwindow) per click Button to open new chart, click to force mt4 terminal to open a new char

This indicator is excellent for scalping on the M1 or M5 chart. Uses a special algorithm for the lines. No need to set up the indicator. Does not feature any alerts and is best used manually after visually confirming the line displays. NB: Make sure to download M1 history before testing and use.
How to use: Simply attach to M1 or M5 chart. Zoom chart out completely. Sell when all lines above the white line (PriceLine). Sniper line crosses above white line. Buy when all lines below the white lin

GBP Scalper 01 is a simple EA that can work automatically to carry out trading activities. This EA is made simply and requires only Lots, TP, and SL settings to use.
As the name implies, this EA is only suitable for use in trading with the GBPUSD pair, and is designed to work optimally on the H4 time frame.
For novice users the default setting of GBP Scalper 01 is enough to get optimal settings for EA.
FREE

This is a simple Bollinger Band EA This works by activating a trade whenever the input parameters are met, including the Bollinger Band parameters The Bollinger Band Parameters determines when a buy or sell trade is opened: If the price is outside the lower bounds of the activated bollinger bands, a buy trade is opened (given that all other criteria are met) If the price is outside the upper bounds of the activated bollinger bands, a selltrade is opened (given that all other criteria are met)
K
FREE

Advanced Moving Average Example of how the EA works: When the fast moving average line crosses over the slow moving average line, from below it to above it, this implies that the instrument is in an uptrend, hence a potential buy trade might be opened This EA allows you to set up to 21 separate moving average cross over criteria: There are 3 Moving Average Crossover input parameter sets Each set allows you to set the bars used for the Fast and Slow moving average line And it also allows you to
FREE

KT Fibrill EA is based on a distinct Fibonacci trading strategy that combines the Fibonacci ratios with a machine learning engine to exploit the market inefficiency using the stop orders. The EA always uses the pending orders to avoid the imprecise price direction.
Recommendations
Symbol: EURUSD Time-Frame: 1-Hour Backtest Data: 2007.01.01 to 2022.04.24 (15 years)
Features Successfully passed our ten internal robustness and stress tests. Destructive methodologies such as grid, martingale

Trade any Forex combine out there. Many prop firms offer challenge or instant funding combines. The biggest problem is controlling the loss. With this indicator you can get a visual system that can limit loss and teach discipline. This uses the MACD and the strategy is scalping. You can determine the risk and reward. Visually follow small trends for scalps. Trade during active sessions. It's just a simple system to instill discipline while limiting loss and scalping pips with the paramet

Holy Grail arrow is for scalping. The period you use will determine the trend. You can try different time frames and periods to see what works best for your strategy. Filters can be applied like a moving average or trendlines. The 1 minute works good for scalps and always trade during active periods and avoid consolidation times. Using other indicators to determine trends is recommended but this can also be a free flowing scalping system alone with tp and sl.
Inputs: Period = trend period

这是一个英镑头皮策略,固定止损,一次一单,测试最近3年平均年盈利百分之50到70左右,要求ECN账户 下单手数设置:每50美元,下单0.01手。参数调整:XDSS调整手数,ZSDS止损调整, 4.EA挂1日周期表即可。 EA特点1固定止损不抗单。 。 这是一个英镑头皮策略,固定止损,一次一单,测试最近3年平均年盈利百分之50到70左右,要求ECN账户 下单手数设置:每50美元,下单0.01手。参数调整:XDSS调整手数,ZSDS止损调整, 4.EA挂1日周期表即可。 EA特点1固定止损不抗单。 这是一个英镑头皮策略,固定止损,一次一单,测试最近3年平均年盈利百分之50到70左右,要求ECN账户 下单手数设置:每50美元,下单0.01手。参数调整:XDSS调整手数,ZSDS止损调整, 4.EA挂1日周期表即可。 EA特点1固定止损不抗单。

OPTIMIZE EA BEFORE TEST AND USE No EA turns hundreds into millions in a year or 2. This is a lie if presented this way. Trade Twenty Eight Forex Pairs. Use this EA to trade the pairs and time frames with tp and sl according to risk. This comes with advanced money management built in. It has break evens and take profits on 50% with sl and tp accordingly. 1 hour recommended but try on others for intraday or swing trading.
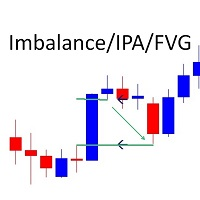
Marks Market Imbalance / Fair Value Gaps / Improper Price Action On The Chart . As traders continue to search for the best trading indicators to guide their investments, the I mbalance / I mproper P rice A ction / F air V alue G ap I ndicator has become increasingly popular. This indicator helps to identify opportunities for taking profit . The indicator begins by scanning the markets for imbalance-improper price action events, allowing traders to immediately see when markets
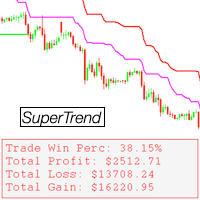
Super Trend Double Pro
- Includes the classic SuperTrend indicator x2 - Includes two indicators for much better market analysis - Comes with various settings - Comes with a display - Displays statistical win/loss information
The "Super Trend Double Pro" indicator provides the ability to combine two of the classic SuperTrend indicators into one, displaying two indicators with different settings on the same chart. The indicator comes with many customizable settings as well as a display which sh

The ' Renko Brick Arrows ' indicator was developed to showcase the traditional renko brick grid pricing on chart. An alternative to using an offline chart generator for renko grid prices, and a unique charting style to strategize.
Key Features Renko bricks are drawn over the chart without having to generate a new chart. Optional horizontal lines shows where the next arrows are supposed to appear. Both one and two step reversals are available to draw arrows for buy and sell.
Input Parameters Gr

GoldBluePrint is a fully automated trading system that uses advanced algorithms to analyse the gold market and generate trading signals. GoldBluePrint is designed to help traders maximize their profits while minimizing their risks. The system uses a combination of technical indicators and market analysis to identify high-probability trading opportunities. One of the key features of GoldBluePrint is its ability to adapt to changing market conditions. The system constantly monitors the gold mark

The Colored Volume is a simple, yet useful indicator that paints the color of the volume based on the price direction. If the price has increased, the volume will be shown in green. If the price has decreased, the volume will be shown in red. This indicator will make it super easy for traders to track volume bars based on price movements. (The settings of the volume bars including line width and color can be manually changed by the trader.)

SPECIAL BIG DISCOUNT! ->> Buy Forex GOLD Investor with -60% OFF! NOTE: Promo price: $197 (Regular Price: $497) - The offer ends soon! Forex GOLD Investor Live Performance: https://www.mql5.com/en/signals/2276118 Forex GOLD Investor is one of the best expert advisors developed to trade on GOLD(XAUUSD) in the forex market. Forex GOLD Investor consists of 2 trading systems . The first one is based on scalping trading strategy and the second system has time based dependency which opens up to 2 tr

IndiceFire ist ein professionelles automatisches Handelssystem, das für die MT4-Plattform und den Handel mit Indizes wie S&P500, US30-Indexpaaren entwickelt und optimiert wurde. .
Dieses System funktioniert unabhängig auf Ihrem Terminal, Sie können es auf Ihrem Computer oder auf einem VPS ausführen, da der Computer eingeschaltet sein muss, während der Roboter läuft.
Der Roboter analysiert den Markt 24 Stunden am Tag und eröffnet seine Trades im H4-Zeitrahmen auf S&P500. Dank dessen ist es eff

The Forex Master Pattern is an alternative form of technical analysis that provides a framework which will help you to find and follow the hidden price pattern that reveals the true intentions of financial markets. This algorithm here does a good job detecting the Phase 1 of the Forex Master Pattern cycle, which is the contraction point (or Value).
On Phase 2 we get higher timeframe activation (also called Expansion), which is where price oscillates above and below the average price defined

Dieser Indikator basiert auf der diskreten Hartley-Transformation. Mit dieser Transformation können Sie verschiedene Ansätze bei der Verarbeitung von Finanzzeitreihen anwenden. Eine Besonderheit dieses Indikators besteht darin, dass sich seine Messwerte nicht auf einen Punkt auf dem Diagramm beziehen, sondern auf alle Punkte des Indikatorzeitraums. Bei der Verarbeitung einer Zeitreihe können Sie mit dem Indikator verschiedene Elemente der Zeitreihe auswählen. Auf diesem Ansatz baut die erste Mö

Dieser Filter basiert auf Bessel-Polynomen. Sein Hauptvorteil ist eine kleine Zeitverzögerung. Ein weiteres Merkmal dieses Filters ist seine hohe Sensitivität gegenüber den neuesten Werten der Finanzzeitreihen. Aus diesem Grund hebt der Indikator aktive Preisbewegungen hervor und glättet gleichzeitig Rauschabweichungen. Neben der klassischen Variante wurden dem Indikator die Logarithmen der Bessel-Koeffizienten als Gewichtungsfunktion hinzugefügt. In diesem Fall erweist sich der Indikator als g

Handelsroboter auf dem Moving Average Indikator
Vorteile für Experten:
Scalping, Martingale, Grid-Trading.
Sie können den Handel mit nur einer Order oder einem Orderraster einrichten. Ein hochgradig anpassbares Auftragsraster mit einem dynamischen, festen oder Multiplikatorschritt und einem Handelslot ermöglicht es Ihnen, den Expert Advisor an fast jedes Handelsinstrument anzupassen.
Drawdown-Recovery-System, überlappende Verlustaufträge und Saldoschutz
Es ist kein Geheimnis, dass der G

Handelsroboter auf dem RSI-Indikator Dies ist eine vereinfachte Version des Handelsroboters, er verwendet nur eine Einstiegsstrategie (die erweiterte Version hat mehr als 10 Strategien)
Vorteile für Experten:
Scalping, Martingale, Grid-Trading.
Sie können den Handel mit nur einer Order oder einem Orderraster einrichten. Ein hochgradig anpassbares Auftragsraster mit einem dynamischen, festen oder Multiplikatorschritt und einem Handelslot ermöglicht es Ihnen, den Expert Advisor an fast jedes

Dieser EA legt ausstehende Trades basierend auf dem Parabolic-Indikator fest, während er die Messwerte der stochastischen und anderer Indikatoren analysiert, um keine ausstehenden Trades festzulegen, wenn der Markt nicht geeignet ist. In der Regel wird eine Marktumkehr gehandelt, wenn der parabolische Punkt durchbrochen wird. Darüber hinaus kann er Divergenzen beim MACD-Indikator finden (wenn CountBasrsDiv>0) und nur handeln, wenn es Divergenzen (und Konvergenzen) gibt. Es hat viele Einstellung
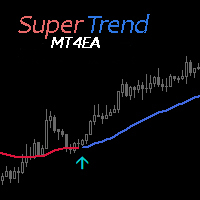
Expert Advisor based on high rated "Super Trend Indicator". indicators page > https://www.mql5.com/en/market/product/74549?source=Site +Profile+Seller
All trades covered by fixed Stop Loss, Take Profit & Trailing Stop. Minimum trading deposit 100 $ . Default settings for AUDUSD 30m. Expert can be run on multiple Symbols / Timeframes / Charts simultaneously - using different magics. No Grid. No Martingale. Works with high spread This EA operates only once per bar opening. Fast me
FREE
Der MetaTrader Market ist die beste Plattform für den Verkauf von Handelsroboter und technischen Indikatoren.
Sie brauchen nur ein gefragtes Programm für die MetaTrader Plattform schreiben und schön gestalten sowie eine Beschreibung hinzufügen. Wir helfen Ihnen, das Produkt im Market Service zu veröffentlichen, wo Millionen von MetaTrader Benutzern es kaufen können. Konzentrieren Sie sich auf dem Wesentlichen - schreiben Sie Programme für Autotrading.
Sie verpassen Handelsmöglichkeiten:
- Freie Handelsapplikationen
- Über 8.000 Signale zum Kopieren
- Wirtschaftsnachrichten für die Lage an den Finanzmärkte
Registrierung
Einloggen
Wenn Sie kein Benutzerkonto haben, registrieren Sie sich
Erlauben Sie die Verwendung von Cookies, um sich auf der Website MQL5.com anzumelden.
Bitte aktivieren Sie die notwendige Einstellung in Ihrem Browser, da Sie sich sonst nicht einloggen können.