Kostenpflichtige technische Indikatoren für den MetaTrader 4 - 74
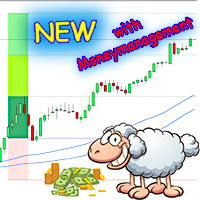
Die "Schäfchen" ins Trockene bringen.
Der blaue Kanal stellt den Fluss dar. Über diesen Fluss müssen die "Schäfchen" ins Trockene gebracht werden, um dann auf der Weide zu grasen. Wobei die "Schäfchen" die Kerzen sind und das "Grasen" der Profit.
Entry für Longtrades ist das High der ersten Kerze, die komplett über dem Kanal schließt. Für Shorts entsprechend umgedreht. Stopp Loss nach Gusto. Am besten liegt er unter dem letzten Tief.
Take Profit kann entweder nach CRV, nach fixen Punkten oder a

Toroid - The indicator reflects information in a visual form, it can be used both for pipsing on small periods and for long-term trading. It generates fairly frequent and accurate signals. The indicator can be used as the main one for determining the trend. The indicator can work both for entry points and as a filter. Uses two parameters for settings. The smart indicator algorithm detects the trend, filters out market noise and generates input signals. It is based on the signals of elementary in
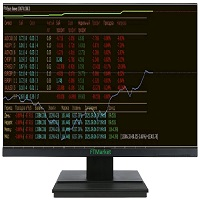
Are you looking for monitoring services to watch trading in the terminal?? You don't need it anymore!! Full monitoring is right in your terminal. There are a couple of strokes left and you can buy it both for real and for a demo test Параметры Parameters:
Max///Statistics Month///Statistics A week///Statistics Day///Statistics
For an open pair:
Symbol Number of orders To buy In villages Density separation Buy profit Sell profit Weekly profit Total profit Drawdown
There is also a built-in pa

Индикатор предназначен для переключения ТФ. Если у вас стоит советник который зависит от текущего ТФ, тогда это вещица вам необходима. Выставление ТФ происходит по количеству ордеров или по набранной лотности. К примеру, для ясности, если ваш советник начинает просаживаться, набирая сетку, то индикатор переключает ТФ автоматически, на увеличение ТФ и не даёт набирать лотность. Как только он закрыл сетку, происходит автопереключение на М1 и по новой. Так ваш советник торгует как скальпер и далее

Broomby Indicator is a trading tool that can be used both independently and in addition to other systems.
It is recommended to use in conjunction with instruments by trading levels. It can be a great filter for opening deals.
Broomby gives 2 types of signals: preliminary and basic. The main one is more filtered, but it depends on you which one suits you best.
It can be used in both trading and options.
Number of last bars - Latest Bars to Analyze Minimum Pips Distance - Pips filter. The hi
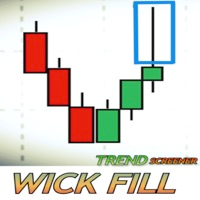
Was ist ein Docht im Handel? Wie funktioniert dieser Screener? Ein Docht in einer Kerze spiegelt eine Ablehnung im Preis wider. Dieser Screener versucht, Dochte zu identifizieren, die ein großes Potenzial haben, gefüllt zu werden. Dieser Screener konzentriert sich auf die Dochte, die im Trendmarkt auftreten.
Der Screener zeigt ein Dashboard an, das einen Gesamtüberblick über die potenziellen Dochte bietet, die live gehandelt werden. Es zeigt ALLE Paare/Instrumente nach Zeitrahmen geordnet an.
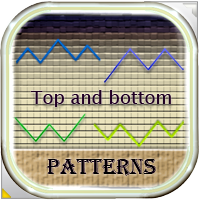
Dieser Indikator findet Umkehrmuster der technischen Analyse wie Double Bottom, Triple Bottom, Head & Shoulders und ihre entgegengesetzten Gegenstücke. Der Indikator zeigt sie auf dem Chart eines Währungspaares an und kann einem Händler signalisieren, ob sich kürzlich ein Muster gebildet hat. Auf diese Weise können Sie schnell eine mögliche Trendumkehr oder -korrektur erkennen, es reicht aus, dem Chart einen Indikator hinzuzufügen, danach können Sie verschiedene Zeitrahmen ändern, um solche Must

Dies ist ein originelles, agiles und ausgezeichnetes Trending-System. Egal, ob Sie ein Anfänger im Trading oder ein professioneller Trader sind, diese Indikatoren können Ihnen helfen, die neuesten Veränderungen der Markttrends schnell und zeitnah zu verfolgen. Es hat folgende Eigenschaften: Die Bedienung ist denkbar einfach, Plug-and-Play, und die Darstellung aller Trendanalyseergebnisse ist auf einen Blick übersichtlich; Keine Notwendigkeit, funktionale Parameter zu konfigurieren, Trendverfolg

Description Better version of MACD indicator which offer a complete visual trading strategy and realize an auto-optimization
KEY LINKS: How to Install – Frequent Questions - All Products How is this indicator useful? NEVER repaints. Detect best parameters of MACD indicator, based on profit factor during the specified period. This indicator can be used as a visual strategy, following the recommendations of entry, stop, and targets. Indicator features It can be used as a complete trading st

Die Trends, die Sie in den Charts sehen, sind nicht immer Trends, mit denen Sie Geld verdienen können. Es gibt zwei Arten von Trends: 1) wahre Trends , die durch fundamentale wirtschaftliche Gründe verursacht werden, die stabil sind und daher dem Händler einen zuverlässigen Gewinn bringen können; 2) falsche Trendabschnitte , die nur wie ein Trend aussehen und durch Ketten von zufälligen Ereignissen entstehen, die den Preis (hauptsächlich) in eine Richtung verschieben. Diese

You don't know what to trade? This is the one for you. Currency Strength (ROC Base) is the easiest way to identify strong and weak currencies. This indicator is a custom-made indicator you can use to determine the currency pairs that are currently trading strongly and the ones that are trading weakly.
This indicator shows the relative strength of 8 major currencies such as AUD, CAD, CHF, EUR, GBP, JPY, NZD, USD. I used a method call " Rate Of Change (ROC) " for calculate all currency in percent

Questo indicatore fractal ti invierà un messaggio telefonico (tramite app mt4) non è necessaria la configurazione dell'indicatore, basta impostare l'ID del tuo smartphone e potrai ricevere il messaggio BUY o SELL in tempo reale (affidabilità 80%)
per qualsiasi domanda o dubbio non esitate a contattarmi su mql5.com o telegram (link al gruppo disponibile in bio)
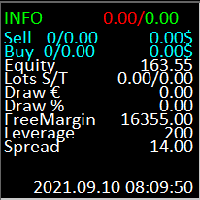
Индикатор информационная панель. 1 строка отображает текущий профит по счету(по всем валютным парам) весь заработанный профит по текущей валютной паре(где стоит индикатор). 2 строка отображает позиции на SELL ордера кол-во открытых ордеров/лотность открытых ордеров и текущий профит по ордерам SELL. 3 строка отображает позиции на BUY ордера кол-во открытых ордеров/лотность открытых ордеров и текущий профит по ордерам BUY/ 4 строка отображает EQUITY. 5 строка отображает лотность закрытых ордеров п
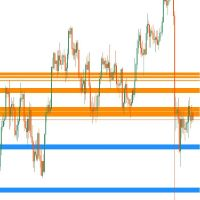
This MT4 indicator can show you Dynamic Support and Resistance Zone in current stage based on Current MA Price in 9 Timeframes, Price Lines or Price Zones for Multi (9) Timeframes according to the setting options as you need which you can set such as MA Period, MA Method, MA Shift, MA Price and you will see price lines all 9 timeframes or you can show Price Zones and also you can hide Minutes timeframes and several setting as you want and You can add several MA Periods in your chart such as 50,

*Non-Repainting Indicator "Mercy" is an arrow indicator that shows possible bounce set ups. It's best to Use The M5 and M1 charts for indices. M15 and M5 for forex pairs. I recommend turnkeyforex.com as a great broker and the one I personally use Live signal based on this indicator: Hurican TK -Push notifications to phone or computer -Great For Scalping -Great For Swing Trading -Arrow Appears at The "Close Of The Candle" -Works On Any Timeframe -Works On Any Mt4 Pair -Perfect For New Trader
Forex Signal Generator is a cutting edge technology for Trend Trading, and filtering all inbuilt in one tool. The Signal Generator analysis the market like a Pro by using its smart algorithms to detect the trend, filter out market noise and display on your chart with the : ENTRY, STOPLOSS AND TARGET PROFIT
Advantages You Get
Access to the proven reliable trend indicator based
Easy and effective trend detection.
Gives you the ability to filter out 'NOISE' from the market

"BUYUK SAVDOGAR" TM has developed this strategy to support anyone who trades binary options.
The "monoBAR" trading system is based on mathematical probability and consists of algorithms that can analyze the market situation with high accuracy.
This trading system consists of mathematical probability, which helps to determine the most accurate state of the price movement. The strategy algorithm helps to detect small impulse movements in a timely manner.
You can simultaneously analyze and rece

The General indicator helps to analyze the market on a selected time frame. He defines the mainstream. The Forex General trend indicator provides an opportunity to classify the direction of price movement by determining its strength. Solving this problem helps investors enter the market on time and make good profits.
It does not provide real-time signals, signals arrive late. But nevertheless, it is very effective. You need to read its signals as if it were a zigzag, the principle of receiving

O melhor indicador para o mercado forex, binárias, commodities! Não repinta ( não alterna o sinal, ocultando as percas) 100% transparente e muito eficaz. Ótimo indicador mesmo no período de notícias! Sempre aprimorando para ser o indicador mais poderoso do mercado! Com atualizações mensais... próxima atualização dia 30 de setembro de 2021 CONFIRA!!!!
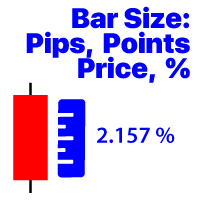
Zeigt die Änderung des zuletzt geschlossenen Balkens des ausgewählten Zeitrahmens an Preis Wert; Prozentwert (%); Pip; Marktpunkte; Meine #1 Assistant : enthält 36+ Funktionen | Kontaktieren Sie mich , wenn Sie Fragen haben Die Programmdatei muss im Verzeichnis " Indicators " abgelegt werden.
In den Einstellungen des Indikators können Sie konfigurieren: Schriftgröße; Textfarbe; Positionierung auf dem Diagramm: in der unteren linken oder unteren rechten Ecke; Ein - / Ausschalten der Anzeige der

This indicator call "ATR Trend" will display 2 lines on chart, make it easy to trade buy/sell. and also Stop Loss. This Indicator's formula base on standard ATR (Average True Range) function. and I combined it with "Dow Theory" concept. It has 4 parameters. - ATR : Period of ATR it self. - ATR Multiple : Multiple value to display on chart. - Price Mode : Used this price option for check on change to uptrend or downtrend [Open, High, Low, Close, High/Low, (High+Low) / 2, (High+Low+Close) / 3 ,

Fully featured Pivots and Levels indicator Pivots: Floor (normal), Woody, Camarilla, Fibonacci Levels: ATR, Historical Volatility with standard deviations, Close Price Volatility with standard deviations
Features: 4 +/- levels MTF, pivots/levels based on Daily, Weekly, 4hr or even 15min Hour and minute time offset
Texts with prices and pip distances to central pivot/level Inputs for Camarilla/Fibonacci/ATR/Volatility levels
Alerts, popup, push, email, sound, live or completed candles on level c

This tool scans the market looking for the correct entry. You can see and evaluate it yourself, perhaps it will suit you for a number of tasks related to forecasting price movements. It uses only price data and analytics to calculate entry points. Does not use auxiliary indicators. It has two parameters for customization.
Setting the indicator. Interval - price analysis interval. Subterfuge - analysis correction interval.
The Mockingbird indicator is more interesting on long trends. A filter is required to work in flat. The border of the trend / flat value is dynamic and depends on the indicator parameters. You yourself are able to adjust it. The indicator is easy to configure. Works on all timeframes and on all instruments.
Segment - Segment of the market for analysis. Length - The number of bars to be recalculated.

Description:
The Wall of Worry indicator allows you to assess market sentiment and possible reversals. The indicator represents three lines that are displayed in a separate window.
Black line (trend) - the amount of volumes in the candle body.
Red line (bears) - the amount of volumes in the upper shadow of the candlestick.
Blue line (bulls) - the amount of volumes in the lower shadow of the candle.
The idea is based on "Wall of Worry" - this is the periodic tendency of financial markets to

This support and resistance indicator gives u a)support level b)resistance level c)direction(trend) all in one.The indicator is based on the top 3 best levels there are!Red dots are sell direction and green dots are buy direction,if candles dont break these levels u get in after the 3rd dot,always use higher time frames from h1 up so its more clear where direction is going,also u can set the indicator to your time frame that u are lookin at.
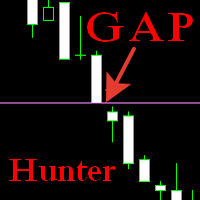
The indicator displays closed and unclosed gaps on a given timeframe and time range. By default, the display of closed gaps is disabled, the search timeframe is the current one. In the flat, it helps to track the direction of the position set by large market participants. In the trend, it shows the points of completion of the position by large market participants. Filters out false pivot points. Another point I wanted to explain, if the parameter Timeframe_for_Search is set to Current in the in
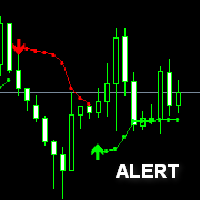
bollinger Stop Alert Indicator is one of the simplest trend-following indicators you may have ever experienced. Besides defining the market trends it also determines possible trend reversal points which are interpreted as trade signals. The bollinger stop can be applied to trade all kinds of forex currency pairs. bollinger Stop Alert Indicator suits all sorts of timeframe charts available within your forex MT4 trading platform thus supports both scalping and day trading. You can also easily cu
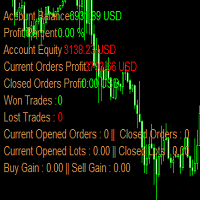
account_info_horizontal is a mt4 (MetaTrader 4) indicator and it can be used with any forex trading systems / strategies for additional confirmation of trading entries or exits.
Indicators add account information to chart. Profit, Balance, Equity, Free Margin, Margin and Margin Level %.
AccountInfo indicator can reveal all advanced features of MetaTrader 4 (above build 600). This indicator can clearly symbolize the main data of the current account (balance, equity, free margin, current Profi
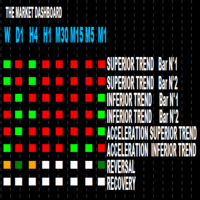
1. Access to all market in the same graphic You know exactly what happens in the market from the shortest timeframe(M1) to the biggest one (MONTH). You will see wether there is a reversal, recovery,acceleration, deceleration of the market. Therefore your decisions become more easy to take and as you are far from usual stress that traders are facing because of numerous analysis they have to do in order to enter or exit the market.
2. Features Every timeframe shows: SUPERIOR TREND BA

Real Trend Zigzag shows the real trend of a market, u nlike the default Zigzag indicator. It calculates the trend in real time and shows green lines for upwards trends, red lines for downward trends and blue lines for no trends. Regarding the old slogan "the trend is your friend" it helps you to decide if should open a buy or sell position. MT5 Version can be found here: https://www.mql5.com/en/market/product/72065 If you are looking for a multi timeframe zigzag, take a look at the PRO vers

Real Trend Zigzag PRO shows the real trend of a market, u nlike the default Zigzag indicator. It calculates the trend in real time and shows green lines for upwards trends, red lines for downward trends and blue lines for no trends. Regarding the old slogan "the trend is your friend" it helps you to decide if should open a buy or sell position. The PRO version is a multi timeframe zigzag (MTF). Means, it shows the trend of the current timeframe as well as the trend of a higher or lower time.
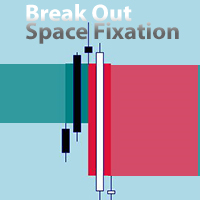
An EA version is being prepared. You can send a private message "notify about EA version".
EA will be versatile with many settings for trading on various indicators. The new EA will also allow trading on this indicator. For example, allowing signals after X signals/bars to X signals/bars in one direction, before changing direction. If Break Out happened before/after the signal of another indicator. Collect profit on each next signal above/below the previous one.
Send a private message "notify

Catch is a reversal indicator and is part of a special category of instruments. it not only analyzes the price movement, but also indicates the points of possible reversals. This facilitates fast and optimal opening of buy or sell orders (depending on the current situation). In this case, the historical data of the analyzed asset must be taken into account. It is the correct execution of such actions that largely helps traders to make the right decision in time and get a profit.

Technical - First of all, this is a trend indicator. Classic signal indicator. Fundamental analysis is based on data from the Economic Calendar, while technical analysis is based on indicators. It should be understood that any indicator is an algorithm that is displayed on the chart as icons. Inside it is a certain formula that calculates the information a trader needs based on past data.
Please note: the indicator does not predict the future! Even the best algorithms only summarize everything

I present to your attention my new Bacheha indicator. Which generates signals based on the calculation of a complex algorithm. This indicator displays signals in the form of arrows on the price chart. Signals are displayed only on a fully formed candlestick. After being displayed, the signal is not redrawn.
Volatility is taken into account when calculating values. It can be used to identify overbought or oversold zones in the market. Reaching such levels indicates that the market may soon reve

The Story indicator predicts the most likely short-term price movement based on complex mathematical calculations. The indicator is interactive and easily customizable. This is a universal indicator, the values of which are calculated based on complex mathematical calculations. The indicator generates arrows that characterize the current price dynamics. The product can be used as a trend indicator or oscillator.
Peculiarities Estimation of the current price movement; Calculation of the curre

What Is a Pivot Point? A pivot point is a technical analysis indicator, or calculations, used to determine the overall trend of the market over different time frames. The pivot point itself is simply the average of the intraday high and low, and the closing price from the previous trading day. On the subsequent day, trading above the pivot point is thought to indicate ongoing bullish sentiment, while trading below the pivot point indicates bearish sentimen
How to Use Pivot Points The very ess
Binary Options Assistant (BOA) ICE Signals Indicator provides signals based on gkNextLevel Binary Options Strategy. Indicators: 2 Bollinger Bands & Stochastic
Stop missing trades, stop jumping from chart to chart looking for trade set-ups and get all the signals on 1 chart! U se any of the BOA Signals Indicator with the Binary Options Assistant (BOA) Multi Currency Dashboard . All BOA Signal Indicator settings are adjustable to give you more strategy combinations. The signals can be seen v
Zur Glättung von Zeitreihen können verschiedene Fensterfunktionen verwendet werden. Fensterfunktionen können sich in ihren Eigenschaften stark voneinander unterscheiden - Grad der Glättung, Rauschunterdrückung usw. Mit diesem Indikator können Sie die Funktionen des Hauptfensters implementieren und ihre Leistung in Finanzzeitreihen bewerten. Indikatorparameter: iPeriod – Indikatorperiode. iPeriod >= 2 iCenter ist der Index der Referenz, wo sich die Mitte der Fensterfunktion befinden wird. St

Matrix is a Forex arrow indicator. Displays signals simply and clearly! The arrows show the direction of the transaction, and are colored accordingly, which can be seen in the screenshots. As you can see, trading with such an indicator is easy. I waited for an arrow to appear in the desired direction - I opened a deal. An arrow formed in the opposite direction - closed the deal. The indicator also displays the lines with the help of which the arrow signals are formed, taking into account the int

Platoon is an indicator designed to be able to detect a bottom or top similar to the Fractals indicator, but of course a different algorithm is used. In other words, you should not enter into a buy deal if the fractal is below. And you should not enter into a sell deal if the fractal is higher.
The indicator only denotes fractals on the chart without performing any additional calculations, therefore, theoretically, any trader can find these patterns by himself. But what is a fractal, how exact

Angry is a trend indicator, it indicates well the points of the beginning of the trend and its completion or reversal. This tool scans the market looking for the correct entry. Against the background of insignificant fluctuations, it is possible to identify a trend and indicate its direction. It uses only price data and analytics to calculate entry points. Does not use auxiliary indicators.
Angry captures moments of stable price movement direction. There are only three types of trend: Bullish

The Matios indicator visually unloads the price chart and saves analysis time: no signal - no deal, if an opposite signal appears, then the current deal should be closed. This is an arrow indicator for determining the trend.
According to the wave theory, Matios displays the course of the wave, while the oscillator can specify the entry point, that is, catch the price movement inside it, i.e. small “subwaves”. By correctly understanding the wave nature of price movements and using the Matios in

The Schindler indicator implements a trend trading strategy, filtering and all the necessary functions built into one tool! The principle of operation of the indicator is to automatically determine the current state of the market when placed on a chart, analyze historical data based on historical data and display instructions for further actions on the trader's screen. You need to understand that any arrow indicator is only a visual form of a signal. As a rule, such Forex indicators contain a wh
GannRS Trend Scalper GannRS is an advanced trading tool based on Gann Law and Supports and Resistances. designed to have an active trading at any time not lagging Indications are given at the beginning of a new candle
Please watch the full tutorial video.
How to use GannRS Very easy to set up... Put it on your chart Adjust inputs
Inputs Show Resistance and support : [bool] true = Shows R/S on chart false = does not show Show Levels :[bool] true = Shows levels on the chart false = does n

Super Trend Button Super Trend is a trading strategy according to which one should trade Forex or Stocks when its price trend goes up, and trend goes down, expecting price movements to continue. “The trend is your friend” agree? Features - Special Button : Quick hide/show Super Trend chart. ( Make your Chart more clean and clear easily) - Color : You have the option of customising your favourite colour of Up Trend or Down Trend . - Super Trend Periods : You have the option to c
Der iPump-Indikator ist ein vielseitiger Indikator, der die Vorteile von drei Kategorien von Indikatoren kombiniert.
gleichzeitige Trenderkennung auf mehreren TFs Definition von Widerstands- und Unterstützungszonen Bestimmung von überkauften und überverkauften Zonen Anzeigefunktionen:
Einen Trend definieren Diese Funktion wird für alle Trader notwendig sein, die die aktuelle Marktrichtung objektiv einschätzen und Subjektivität vermeiden möchten. In Sekundenbruchteilen können Sie die Richtung
A Chart Analytics Program and helps in asset analysis using the Fibonacci Complex.
The primary Fibonacci numbers used in trading are 61.8% and 38.2%. 8% is derived from dividing any number in the Fibonacci sequence by its previous one. F n / F n-1 2% is derived by squaring 61.8 and alternatively by dividing any number in the sequence by the number two places to its right. F n /F n+2 The second tier of Fibonacci numbers used in trading is 23.6%, 76.4%, and 78.6%. 6% is derived from dividing an
YOU ARE PUCHASING A FOREX INDICATOR THAT WAS CUSTOM BUILT IN 2021 THIS INDICATOR WILL HELP YOU FIND PRECISE ENTRIES FOR TRADES. SO HOW DOES IT WORK? 1) It looks for engulfing candlestick pattern. (It can tell if there is a bullish or bearish engulfing pattern which is a typically a reversal signal) 2) It will also look to see if price is near a short term extreme by using Bollinger Bands. 3) It combines the engulfing candle stick pattern along with Bollinger Bands to give signal 4) If price has

Description Better version of RSI indicator which offer a complete visual trading strategy and realize an auto-optimization Support: We create great tools for the entire trading community. Most of them are free. If you believe in what we do Support Us Here. KEY LINKS: How to Install – Frequent Questions - All Products How is this indicator useful? NEVER repaints. Detect best parameters of RSI indicator, based on profit factor during the specified period. This indicator can be used as
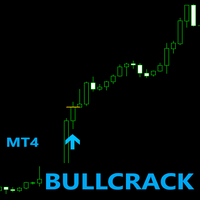
BULLCRACK MT4
*Non-Repainting Indicator/Analyzer Pick trades when it 20-30 confirmed a bull trend. No need to filter trades as every single signal has gone through multiple levels of confirmations. Strictly on buy trades . STRICKTLY FOR THE 15MINS TIMEFRAME!! Trades any pairs . *Push notifications to phone or computer * For Scalping * For Swing Trading *Arrow Appears at The "Close Of The Candle" *popup alerts* No much trades cause no random trades!
**very perfect for Expert and New Traders!
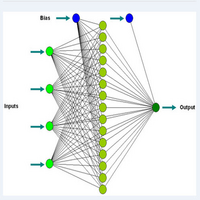
Aktualisieren! Den Ebenen 100 und 200 wurden Pfeile hinzugefügt.
Dieser Indikator ist genau für den Zugang zu Extremen und Unterstützungen für Kaufpositionen, hauptsächlich für 1-Minuten-Zeitrahmen. Andere Zeitrahmen können verwendet werden, aber die Ebenen sind unterschiedlich. Es ist ein besserer Oszillator und vergleicht sich mit anderen, um den Unterschied zu sehen.
Tageshandel mit neuronalen Netzwerkkonzepten. Dieser Indikator verwendet elementare Formen von Neuronetzwerken, um Kauf- und
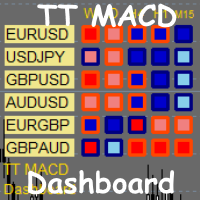
TT MACD Dashboard is multi-time frame and multi-currency market scanner. It is telling you the value of MACD and MACD histogram (a difference between MACD line and Signal line) in a form of small rectangle. If MACD value is above zero (MACD is bullish). Rectangle border color is bullish (Navy by default). If MACD value is below zero (MACD is bearish). Rectangle border color is bearish (OrangeRed by default). If MACD histogram is rising and above zero (Bullish histogram). Rectangle color is bull
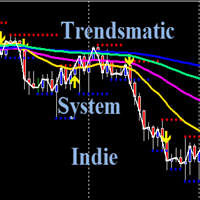
Trendsmatic System Indie Plus
Trendsmatic System Indie is an indicator that gives in-depth analysis of market trending on any currency pair as displayed
in the MT4's Market watch. It actually shows the states of the current candles and the trending positions on all higher
time-frames for a long term price trending movements.
This can give a trader a stupendous profits on a long term single trade with long stride trend movements in a specific
direction. It saves the trader some hassles of a
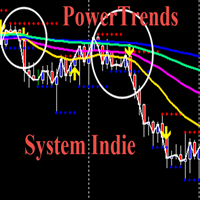
Power Trends System Indicator
Power Trends System Indicator is a custom indicator developed in line with a profitable trading system and it has been living up to its name.
It is a trending system carefully filtered to remove most of the downsides inherent in trend-following systems.
This is highly useful for those traders that are lazy to analyze the market but still want to make money from Forex market without stress.
The good news for any trader that comes across this system is that any t

An informational indicator that displays useful information on the chart, as well as notifies you about the occurrence of any event on the market.
Indicator shows:
Broker server time Trading symbol and TF Current profit in points, percent and in the deposit currency Time until the end of the current bar Current spread size
The indicator has an alert system that allows you to signal about any event on the chart:
Price move up or down Break of any level in any direction
Signals can come in t

Delta Channel is a trend indicator by which you can set take profit for buy and sell separately by adjusting the line for each of them. Entering the market by the EURUSD symbol must be done when the price deviates from the corresponding line by 30 points on the H1 timeframe, while the take profit should be set at the level indicated by the indicator (line level), at the same time we set a stop loss in points and an arbitrary trailing -stop pull it up.

Pivot Pro with Alert
Pivotpunkte bieten sehr gut Marken, die sehr oft vom Preis angelaufen werden. An diesen Marken entstehen Reaktionen des Preises. Sie können hervorragend als Zielzonen genutzt werden, oder auch als Einstiege. Durch die Alarmfunktion können mehrere Charts geöffnet werden und man findet die profitablen Einstiege sehr leicht. Kein verpassen von Entry´s durch Benachrichtigung aufs Handy. In der Übersicht lässt sich Markt mit Alarme überwachen. Diese Einstellungen können verändert
Binary Options Assistant (BOA) COLD Signals Indicator provides signals based on Amalia Trader Binary Options Strategy. Indicators: Keltner & Stochastic
Stop missing trades, stop jumping from chart to chart looking for trade set-ups and get all the signals on 1 chart! U se any of the BOA Signals Indicator with the Binary Options Assistant (BOA) Multi Currency Dashboard . All BOA Signal Indicator settings are adjustable to give you more strategy combinations. The signals can be seen visually an
Binary Options Assistant (BOA) BURN Signals Indicator provides signals based on Ana Trader Binary Options Strategy. Indicators: MACD & Stochastic
Stop missing trades, stop jumping from chart to chart looking for trade set-ups and get all the signals on 1 chart! U se any of the BOA Signals Indicator with the Binary Options Assistant (BOA) Multi Currency Dashboard . All BOA Signal Indicator settings are adjustable to give you more strategy combinations. The signals can be seen visually and hea
Binary Options Assistant (BOA) CHILL Signals Indicator provides signals based on Katie Tutorials Binary Options Strategy. Indicators: 3 Moving Averages & RSI Stop missing trades, stop jumping from chart to chart looking for trade set-ups and get all the signals on 1 chart! U se any of the BOA Signals Indicator with the Binary Options Assistant (BOA) Multi Currency Dashboard . All BOA Signal Indicator settings are adjustable to give you more strategy combinations. The signals can be seen visual

Tract - Channel indicator, by which you can place orders like a classic channel indicator. Trading can be carried out inside the channel when the price reaches its borders and turns in the opposite direction from them. In such cases, reversal strategies are used. The channel indicator is designed to work with support and resistance levels and help traders find opportunities to enter the market. Another way to trade a breakout - assumes a situation when the price, upon reaching one or another cha

Ein Trendindikator, der auf dem Ausbruch von Niveaus basiert.
Nur eine Einstellung ermöglicht eine sehr schnelle Anpassung an ein bestimmtes Symbol.
Dieser Indikator ist ein nicht nachlackierender Indikator.
Nur für Desktop-MT4-Plattform. Mobiler PUSH. Desktop-Warnung. Email Alarm. Zeigt Pfeile für die Eingabe bei geschlossener Leiste.
Funktioniert mit jedem MT4-Symbol und jedem Zeitrahmen.
Perfekt für neue Trader und erfahrene Trader.

Sting implements indicator technical analysis and allows you to determine the state of the market in the current period and make a decision on a deal based on certain signals. Sting is the result of mathematical calculations based on data on prices and trading volumes.
Sting creates signals to perform operations on strong trend movements; it is more expedient to use it for trading when the trend is weakening or sideways. It is used as an additional one, regardless of the phase of the trend mov

DAYTRADING nur für Aktien (CFDs).
Der Handel erfordert Arbeit. Es gibt keine Abkürzungen oder Indikatoren, die Ihnen alle Ein- und Ausgänge mitteilen. Profit kommt von der Geisteshaltung. Indikatoren sind Werkzeuge, die in Verbindung mit Geldmanagement und Erfolgspsychologie verwendet werden. Finden Sie Ungleichgewichte im Volumenprofil. Handelspreis-Volumen-Ungleichgewichte.
Viele Ungleichgewichte treten beim Schließen und Öffnen und bei Nachrichten auf. Sehen Sie sich die Käufer vs. Verkäuf
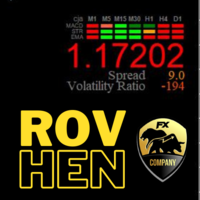
Es wurde dieser Indikator mit einem fortschrittlichen Handelsalgorithmus mit angemessenem Risikomanagement erstellt. Es verwendet ein wunderbares Design, um Ihnen Berichtsergebnisse für (MACD, STR & EMA) für mehrere Zeitrahmen (M1, M5, M15, M30, H1, H4, D1) anzuzeigen. Diese Technik hilft Ihnen, die Bewegungen des Handelsmarktes zu zeigen, die Sie zu einer Kauf- oder Verkaufsentscheidung führen. Es zeigt Ihnen die Währungsgeschwindigkeit. Es zeigt Ihnen das Volatilitätsverhältnis für die aktuell

About - Forex indicator. This trend indicator is used to determine the current trend in price movement, making it clear in which direction it is better to open a position: buy or sell. The About trend indicator is displayed on the chart and moves in parallel with the price. The Forex About trend indicator allows you to determine in time a change in the direction of price movement, thereby minimizing the likelihood of capital loss. In trading practice, various combinations of About and other ind

Channel indicator Control. A graphical tool that calculates the levels that form the channel and the moments of opening orders. Control has the ability to not only show tops and bottoms, fixing waves in the middle of its channel. This channel indicator is rather a cross between the ZigZag indicator and the real fractals.
One of the surest and most profitable online trading methods is mid-channel trading. In fact, this is the same trend, but it differs in a more pronounced fixation of highs and

The basic principle of working with trend indicators is to search for a market trend. The Sherlock indicator was created with this very purpose in mind. Many classics of trading in financial markets have developed their systems specifically to search for market trends. What is a trend? This is a certain direction of the quotes change. The trend can be up and down. In an uptrend, the price rises, and in a downtrend, accordingly, it falls. Basically, the Sherlock trend indicator does its job. The
MetaTrader Market - Handelsroboter und technische Indikatoren stehen Ihnen direkt im Kundenterminal zur Verfügung.
Das MQL5.community Zahlungssystem wurde für die Services der MetaTrader Plattform entwickelt und steht allen registrierten Nutzern der MQL5.com Webseite zur Verfügung. Man kann Geldmittel durch WebMoney, PayPal und Bankkarten einzahlen und sich auszahlen lassen.
Sie verpassen Handelsmöglichkeiten:
- Freie Handelsapplikationen
- Über 8.000 Signale zum Kopieren
- Wirtschaftsnachrichten für die Lage an den Finanzmärkte
Registrierung
Einloggen
Wenn Sie kein Benutzerkonto haben, registrieren Sie sich
Erlauben Sie die Verwendung von Cookies, um sich auf der Website MQL5.com anzumelden.
Bitte aktivieren Sie die notwendige Einstellung in Ihrem Browser, da Sie sich sonst nicht einloggen können.