Kostenpflichtige technische Indikatoren für den MetaTrader 4 - 6
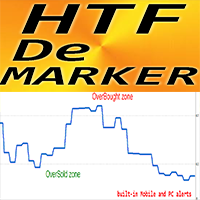
Forex Indicator HTF DeMarker for MT4 This indicator is a useful tool used by technical traders to find entry and exit points. H TF means - H igher Time Frame. DeMarker oscillator line indicates the current price position relative to previous highs and lows
DeMarker provides the most efficient regular divergence signals among other oscillators
OverBought zone is when the D eMarker is above 0.7 and OverSold one - when it is below 0.3
Indicator has built-in Mobile and PC alert
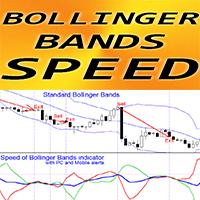
Forex Indicator " Bollinger Bands Speed" for MT4, No Repaint. Speed of Bollinger Bands - is a unique trend indicator The calculation of this indicator is based on equations from physics . Speed is the 1st derivative of standard Bollinger Bands Bollinger Bands speed indicator shows how fast BB middle line and BB borders change their directions By default: Blue line is the speed of BB middle line, Red line - speed of bottom border, Green one - speed of top border It is recom
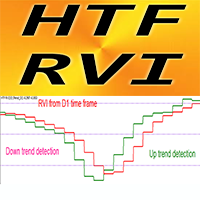
Forex Indicator HTF RVI Oscillator for MT4, No repaint Upgrade your trading methods with the professional HTF RVI Oscillator for MT4. H TF means - H igher Time Frame RVI is one of the best oscillators for trend change detection and entry from Oversold/Overbought areas This indicator is excellent for Multi-Time Frame trading systems with Price Action entries from OverSold/Bought areas . HTF RVI Indicator allows you to attach RVI from Higher time frame to your current chart
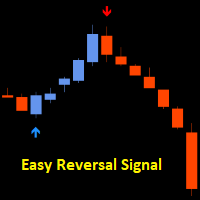
Easy Reversal Signal Indicator spots tops and bottom for catching new trends before they happen It shows entry signals with arrows Blue arrow = Buy entry Red Arrow = Sell entry Recommended timeframes are M1 and M5 but you can also use higher timeframes as well Best time to trade is London and New York session. I do not recommend trading the Asian session because due to the low volatility there can be more false signals. ENTRY RULES: The signals are non lagging and non repainting but you

Dark Support Resistance is an Indicator for intraday trading. This Indicator is programmed to identify Support and Resistance Lines , providing a high level of accuracy and reliability.
Key benefits
Easily visible lines Only the most important levels will be displayed Automated adjustment for each timeframe and instrument Easy to use even for beginners Never repaints, never backpaints, Not Lag 100% compatible with Expert Advisor development All types of alerts available: Pop-up, Email, Pus

Product detailed post: https://www.mql5.com/en/blogs/post/756962
Get free demo from the link in above post.
Features: - Multi Heiken Parameters
- Alerts & Highlights for Heiken Switch
- Heiken Alignment Alerts
- Multi-timeframe Alignment Alerts
- Multi Currency
Heiken Explained: Heiken Settings: All comma separated lists will be used for different heiken ashi's. Example: 5,40,188 will mean that MAPeriod1 in 1st heiken will be 5; In 2nd heiken will be 40 and in 3rd heiken ashi will be 1

ICT, SMC, Smart Money Concept, Support and Resistance, Trend Analysis, Price Action, Market Structure, Order Blocks, Breaker Blocks, Momentum Shift, Strong Imbalance, HH/LL/HL/LH, Fair Value Gap, FVG, Premium & Discount Zones, Fibonacci Retracement, OTE, Buyside Liquidity, Sellside Liquidity, Liquidity Voids, Market Sessions, NDOG, NWOG,Silver Bullet,ict template
Auf dem Finanzmarkt ist eine genaue Marktanalyse für Investoren von entscheidender Bedeutung. Um Investoren dabei zu helfen, Markttre
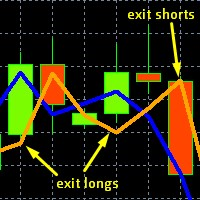
This is the original, simpler version of our core EURUSD algorithm (it calculates and displays 2 lines rather than 3), but it is still capable of detecting levels in the market where EURUSD will likely move to. These levels are indicated by unusual large gaps, formed by the two lines.
Detailed guidance is given to users. All in all it works on the very short term, and more importantly on the daily chart.
The differences between this and our top EURUSD indicator, is that this one only dis
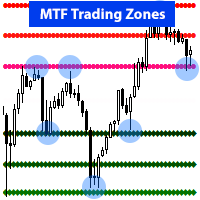
Not a traditional support resistance, or pivot point indicator. RevCan's " Early Reversal - MTF Trading Zones " is an Advanced tool that identifies potential market reversal points, or change of a trend at an early stage using MTF chart analysis. >> It analyzes multiple chart timeframes (MTF) to find these key price turnover zones where big banks and institutions are likely to place their trades, hence chances for you for high probability trade entry, Stop loss, and Take profit targets to maximi

Precision Trend Signals is an indicator that shows price reversal points on the chart using arrows. A green arrow indicates when the price will reverse upward, and a red arrow indicates when the price will reverse downward. The indicator can be used on any timeframes and any currency pairs. Trading Strategy with this Indicator: Green Arrow : When a green arrow appears, close any previously opened (if any) sell position and open a buy position. Red Arrow : When a red arrow appears, close any prev

Martin Armstrong Cycles employs an unconventional form of technical analysis on your charts aimed at capturing market angles, swift market movements, price reversals, and early trend shifts. I strongly advise all traders to integrate cyclical analysis into their charting methods, as it unveils the inherent rhythms of markets. Every element in the universe follows a cycle, and so does price!
Analytical Benefits of Cyclical Analysis
The angle of the cycle provides a roadmap for anticipating fu

Break Moment is a unique proprietary indicator with extensive capabilities and a variety of settings. It can be used as a signal generator or as an auxiliary tool. For the calculations, the price channel is determined. When it is broken, if all conditions of the additional filter are met, it displays a signal in the form of a histogram. Break Moment can be used to determine the main trend, as it has 2 filters for determining it in addition to everything else. If these filters are activated, the

Das Apollo Price Action System ist ein Indikator, der vollständig auf dem Price Action-Prinzip basiert. Der Indikator gibt ein Signal zum Kauf oder Verkauf, sobald die Bedingungen für den Markteintritt gemäß der Strategie des Indikators gebildet sind. Der Indikator kann als grundlegendes Handelssystem oder als Ergänzung zu Ihrem eigenen Handelssystem verwendet werden. Dieser Indikator ist sehr einfach zu bedienen. Sie müssen nur den Signalen folgen. Der Indikator zeigt Trendlinien auf dem Chart

Advanced Currency Strength Indicator
The Advanced Divergence Currency Strength Indicator. Not only it breaks down all 28 forex currency pairs and calculates the strength of individual currencies across all timeframes , but, You'll be analyzing the WHOLE forex market in 1 window (In just 1 minute) . This indicator is very powerful because it reveals the true movements of the market. It is highly recommended to analyze charts knowing the performance of individual currencies or the countries ec

Improved version of the free HMA Trend indicator (for MetaTrader 4) with statistical analysis. HMA Trend is a trend indicator based on the Hull Moving Average (HMA) with two periods. HMA with a slow period identifies the trend, while HMA with a fast period determines the short-term movements and signals in the trend direction.
The main differences from the free version: Ability to predict the probability of a trend reversal using analysis of history data. Plotting statistical charts for analyz

Oder M Oving A verage S upport R eständigkeit Bands.
Der MASR-Bänder-Indikator ist ein gleitender Durchschnitt, der von zwei Bändern umgeben ist, die als Unterstützungs- und Widerstandsniveaus zusammenarbeiten. Statistisch enthalten MASR-Bänder in 93% der Fälle Preiskerzen. So wird es in Schritten berechnet: 1. Der erste Schritt besteht darin, das höchste Hoch (HHV) und das niedrigste Tief (LLV) für einen Zeitraum von X zu berechnen.
2. Der zweite Schritt besteht darin, HHV durch LLV zu

Der TRANSACTION SPEED ist der hochwertigste Indikator, der anzeigt, wo und wann sich große Aufträge auf dem Markt ansammeln und welche Vorteile dies mit sich bringt. Er erkennt Trendänderungen in einem sehr frühen Stadium. Er ist gleichzeitig ein Indikator und ein Handelssystem. Das Konzept ist einzigartig und unglaublich profitabel.
Im Devisenhandel wird das Tick-Volumen irreführenderweise als Volumen bezeichnet. In Wirklichkeit handelt es sich um die Preisveränderung pro Zeiteinheit, was de

Did You Have A Profitable Trade But Suddenly Reversed? In a solid strategy, exiting a trade is equally important as entering.
Exit EDGE helps maximize your current trade profit and avoid turning winning trades to losers.
Never Miss An Exit Signal Again
Monitor all pairs and timeframes in just 1 chart www.mql5.com/en/blogs/post/726558
How To Trade You can close your open trades as soon as you receive a signal
Close your Buy orders if you receive an Exit Buy Signal. Close your Sell orde

Dies ist wahrscheinlich der vollständigste Indikator für die automatische Erkennung der harmonischen Preisbildung, den Sie für die MetaTrader-Plattform finden können. Es erkennt 19 verschiedene Muster, nimmt Fibonacci-Projektionen genauso ernst wie Sie, zeigt die potenzielle Umkehrzone (PRZ) an und findet geeignete Stop-Loss- und Take-Profit-Werte. [ Installationsanleitung | Update-Anleitung | Fehlerbehebung | FAQ | Alle Produkte ]
Es erkennt 19 verschiedene harmonische Preisbildungen
Dar

The indicator displays the following elements: Supply Zones, Demand Zones, Fair Value Gaps and sends alerts when a supply or demand zone is reached. The zone timeframe is set independently of the chart timeframe. For example, it is possible to set M5 zones on an H4 chart. The importance of zones can be adjusted using the zone strength parameter. Demand zones are displayed if at least one candle in the range of the zone is entirely above the zone. Similarly, supply zones are displayed if at least
Call/Put Ratio is one of the most well-known indicators of the market sentiment. The indicator has been developed by Martin Zweig. It is based on real volumes of the CBOE option market. As we know, a Call option gives its owner the right to buy the underlying asset at a predetermined price. A Put option gives the right to sell it. Thus, increasing volumes for Call options indicate the increasing demand. The growth of Put option volumes shows that supply starts exceeding demand. If we divide the
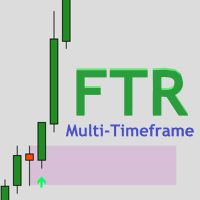
The FTR Multi-Timeframe indicator is a versatile tool that can add great value to your trading arsenal. This indicator is intended to be used to add confluence to your already existing trading strategy, such as, breakout & retest, supply and demand, patterns or continuation trading. FTR Multi-Timeframe is a continuation indicator. Rules are attached as a screenshot.
Settings for Demo/Strategy Tester: Set Server_Time_Filter to false in indicator settings ( IMPORTANT! ). Tick 'Show object desc

The Key level wedge indicator automatically draws rising wedge pattern and falling wedge pattern for you on the chart. This pattern is really good when used as a confirmation entry at key support & resistance, supply & demand and reversal zones.
Advantages
The Key level wedge block DOES NOT RE-PAINT, giving you confidence when a signal appears and also helps when looking back. The Key level wedge includes an on/off button on the chart to easily keep the charts clean after analysis by jus

Description
Money Zones is an indicator that determines accumulation/distribution zones in the market. Green zones make it possible to look for buy entry points or sell exit points. Red zones, on the contrary, define the opportunity for selling or closing buys. The indicator has the ability to define money zones for two timeframes simultaneously on the same chart.
How to use?
Use this indicator to identify market zones as support/resistance zones to determine the best conditions for marke

Supertrend indicator uses a combination of a moving average and average true range to detect the trend of a trading instrument.
Supertrend indicator for MetaTrader 5 easily shows the trend as a line following the price.
USAGE THIS INDICATOR If the closing prices are above Supertrend Line, there is a Bullish sentiment at that moment. The opposite is a Bearish sentiment. Three green lines - Strong Bullish sentiment. Three red lines - Bearish sentiment.
For BUY : - Three green lines and pr

The Multicurrency Trend Detector ( MTD ) indicator allows you to immediately and on one chart on a selected time interval (extending from a zero bar to a bar set in the settings by the value horizon) determine the presence, direction and strength of trends in all major currencies, as well as assess the reliability of these trends. This is achieved by calculating indices (non-relative purchasing power) of eight major currencies, namely: AUD, CAD, CHF, EUR, GBP, JPY, NZ

Introducing Auto Trendline Pro : Your Ultimate Trading Companion Are you tired of manually drawing trendlines on your forex charts? Do you wish for a tool that can simplify your trading while providing timely alerts? Look no further, because Auto Trendline Pro is here to revolutionize your trading experience. In the fast-paced world of forex trading, staying ahead of the curve is essential. Identifying trends, both upward and downward, can be a game-changer. This is where Auto Trendline Pro s

MultiCurrencyWPR (MCWPR) indicator applies conventional WPR formula to plain Forex currencies (that is their pure strengths extracted from Forex pairs), market indices, CFDs and other groups of tickers. It uses built-in instance of CCFpExtraValue to calculate relative strengths of selected tickers. Unlike standard WPR calculated for specific symbol, this indicator provides a global view of selected part of market and explains which instruments demonstrate maximal gain at the moment. It allows yo

" A NEW TRADING METHOD… AN AMAZING TRADING STRATEGY! " Buy ProTrading Arrow Indicator And You Will Get Forex Trend Commander Indicator for FREE!
Like any system, there are losing signals, but you can also lock in profit from market movement. It should not be forgotten that trading is not an event, but a process. This process has no end, i.e. it should never stop completely and completely. Planning the trading strategy takes some time, but it takes much longer to implement it in practice. Pr

After analyzing a numerous significant bear and bull markets, a peculiar principle has surfaced, dubbed the 5 Trend Lines Rule . It suggests that within a major bear or bull market, there are typically five false breakouts before the sixth breakout proves significant.
Parameters
Trend Line #1 Color: Magenta Trend Line #2 Color: Magenta Trend Line #3 Color: Magenta Trend Line #4 Color: Magenta Trend Line #5 Color: Magenta #1 Color: Yellow #2 Color: Yellow #3 Color: Yellow #4 Color: Ye

What if you could see trouble from far, just imagine having some ability to foresee danger. This indicator has the ability to see consolidations before they are clear to everyone else. In the market everything is always fun until the market starts consolidating and often times by the time people realise it it's often too late. This Indicator will spot consolidations very fast and let you know at the top right of the chart so that you can either avoid losses by stopping to trade using trend follo
Aktualisieren! Den Ebenen 100 und 200 wurden Pfeile hinzugefügt.
Dieser Indikator ist genau für den Zugang zu Extremen und Unterstützungen für Kaufpositionen, hauptsächlich für 1-Minuten-Zeitrahmen. Andere Zeitrahmen können verwendet werden, aber die Ebenen sind unterschiedlich. Es ist ein besserer Oszillator und vergleicht sich mit anderen, um den Unterschied zu sehen.
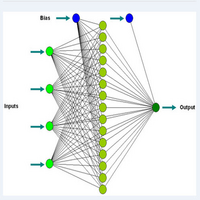
Tageshandel mit neuronalen Netzwerkkonzepten. Dieser Indikator verwendet elementare Formen von Neuronetzwerken, um Kauf-
G-Labs Market Maker Dashboard - Exclusive Seasonal Offer Elevate your trading with the original G-Labs Market Maker Dashboard, available for a limited time at just $40 USD. Ideal for starter traders, this dashboard has been enhanced with new features and now includes a comprehensive training video. Key Features: Ideal for Beginners: Tailored for newcomers, with recent enhancements for superior performance. Inclusive Training Video: Simplify your learning curve with our detailed training ma
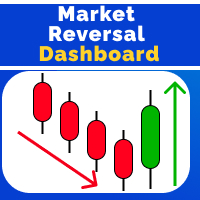
Market Reversal Catcher Dashboard indicator looks for market reversal points or major pullback. To do this, it analyzes previous price movements and using a flexible algorithm for estimating the probability of a reversal, also gives recommendations on entry points and sets recommended profit targets for positions opened on a signal. The dashboard is designed to sit on a chart on it's own and work in the background to send you alerts on your chosen pairs and timeframes. Dashboard does not requi

Wir stellen Ihnen Auto Trendline vor, den innovativen MT4-Indikator, der das
Zeichnen von Trendlinien in Ihren Diagrammen automatisiert. Verabschieden Sie sich von der mühsamen und zeitaufwändigen Aufgabe, Trendlinien manuell zu zeichnen,
und lassen Sie Auto Trendline die Arbeit für Sie erledigen!
*Kontaktieren Sie mich nach dem Kauf, um Ihnen Anweisungen und eine Schritt-für-Schritt-Anleitung zu senden.
Mit seinem fortschrittlichen Algorithmus erkennt und zeichnet Auto Trendline aut
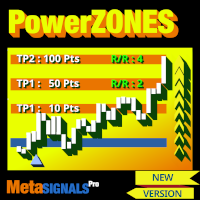
Strategischen Zonen 3, 4, 5, die der Markt testen wird. >> Automatisch TP1/TP2/TP3 in Punkten oder im Wert >> Überprüfen Sie sofort, ob Ihr Risiko-Ertrags-Verhältnis angemessen ist. Indikator, der nicht zurückverfolgt, nicht verzögert - ideal für den manuellen und automatisierten Trading - geeignet für alle Vermögenswerte und Zeiteinheiten Zeitlich begrenztes Angebot - dann zurück auf >> 149$ Nach dem Kauf, bitte kontaktieren Sie mich auf diesem Kanal für empfohlene Einstellungen MT5

Multicurrency and multitimeframe modification of the Fractals indicator. Displays the last two fractals — their sequence (and which one is broken), or the distance between them. You can specify any desired currencies and timeframes in the parameters. Also, the panel can send notifications on a fractal's breakout. By clicking on a cell with a period, this symbol and period will be opened. This is MTF Scanner. The key to hide the dashboard from the chart is "D" by default.
Parameters Calculati

Dieser Indikator untersucht die Preisstruktur von Fraktalen verschiedener Perioden, um mögliche Umkehrpunkte auf dem Markt zu ermitteln, und bietet Positionshändlern, die bereits über ein grundlegendes oder technisches Bewertungsmodell verfügen, einen zeitlichen Rahmen. Anders als sein jüngerer Bruder, Reversal Fractals , wird dieser Indikator aufgrund des ausgewählten Zeitraums keine Umkehrungen verpassen und Umkehrungsfractals im Zick-Zack-Verfahren finden. [ Installationsanleitung | Update-A
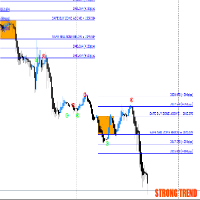
Introducing Breakout scalper system(BSS), an innovative and robust trading solution designed to elevate your trading experience to new heights. This sophisticated MetaTrader 4 compatible system is meticulously crafted to empower traders with precise buy and sell levels, strategic targets, and timely signals, all delivered with utmost accuracy and efficiency. Key Features: Buy and Sell Levels: Gain a competitive edge with carefully calculated buy and sell levels, providing you with clear entry an

Ein symmetrisches Dreiecks-Chartmuster stellt eine Phase der Kontraktion und Konsolidierung dar, bevor der Preis gezwungen ist, nach oben auszubrechen oder zusammenzubrechen. Ein Bruch von der unteren Trendlinie markiert den Beginn eines neuen Abwärtstrends, während ein Ausbruch von der oberen Trendlinie den Beginn eines neuen Aufwärtstrends anzeigt. Holen Sie sich das Dashboard, um alle Instrumente und Zeitrahmen, die Sie für symmetrische Dreiecksmuster handeln, auf einmal zu überwachen! https

WaveMaster Pro : Advanced Market Analysis Indicator for MetaTrader 4 Overview WaveMaster Pro is an advanced MetaTrader 4 (MT4) indicator engineered to enhance trading strategies by offering a sophisticated analysis of market trends and price movements. By integrating sector analysis, micro wave detection, and price projection capabilities, WaveMaster Pro provides traders with actionable insights for better decision-making. Whether you are a novice trader or a seasoned professional, this tool is

v. 1.0 This indicator can show with maximum accuracy up to 1 bar the presence of a Maximum/minimum on the chart, regardless of the timeframe. It has a flexible configuration. You can use either one value on all TF, or you can use your own value on each TF individually.
This indicator is already being improved and those who purchase it receive all updates for free.
Next, it is planned to display an indication of the strength of the pivot point at each extremum (in % or in color drawing). It

indicator is no repaint trend indicator. when red stars up to line that is probably end of long trades. when blue stars up to line that is probably end of down trades. indicator can use all pairs and lower than weekly charts, to use weekly chart need to at least 500 bars data on back.and lowering processing value 500. it is also suitable for 1m charts. indicator hold long way to go. there is not too many signals.

Connect Indicator is a tool used for connecting indicators between the MQL market and MT4. The connected indicators are made by our group and can be used for other applications, such as sending messages to the Line application or Telegram application. If you have any questions, please don't hesitate to ask us to receive support. Function and indicator buffer Buffer one is the high price of the previous candle. Buffer two is the high price of the previous candle. Usage To connect indicators to fu
Dieser Indikator scrollt mehrere Charts gleichzeitig, wenn Sie den Chart scrollen, an den der Indikator angehängt ist. Es ist nützlich für das Backtesting von Multi-Timeframe-Strategien, Multi-Pair-Strategien, die gleichzeitige Überwachung mehrerer Charts und den Rückblick, um zu sehen, wie sich mehrere Märkte gleichzeitig in der Vergangenheit entwickelt haben. Der Indikator ist leichtgewichtig und kann verwendet werden, um bis zu 99 Diagramme gleichzeitig zu verschieben.
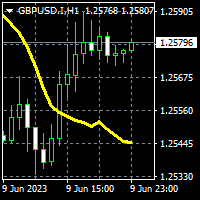
To get access to MT5 version please click here . This is the exact conversion from TradingView: "ZLSMA - Zero Lag LSMA" by "veryfid". This is a light-load processing indicator. This is a non-repaint indicator. Buffers are available for processing in EAs. All input fields are available. You can message in private chat for further changes you need. Thanks for downloading

Dieses Produkt dient zur Anzeige der Handelssitzungen von 15 Ländern basierend auf der Zeitzone Ihres Broker-Servers und verschiedenen Anzeigemodi basierend auf Ihren gewünschten Einstellungen, um eine Überlastung der Diagramme zu verhindern und die Möglichkeit zu bieten, eine Sitzung mit der vom Benutzer gewünschten Zeit festzulegen.
Auf dem Forex-Markt geht die Sonne nie unter, aber ihr Rhythmus tanzt im Takt der verschiedenen Handelssitzungen. Das Verständnis dieser Sitzungen, ihrer Übersc

All patterns from Encyclopedia of Chart Patterns by Thomas N. Bulkowski in one indicator. It draws an up or down arrow whenever a pattern is identified. Patterns are selected in the drop-down list of the Pattern variable (located at the beginning of the properties window). The indicator has numerous external parameters, some of them apply to all patterns, while others are selective. To see more information on the parameters used for the selected pattern, enable the ShowHelp variable (located at

Индикатор Price Bars and Chart Patterns основан на трех баровых паттернах: Double Key Reversal Bar Popgun Multiple Inside Bar Индикатор Price Bars and Chart Patterns выставляет значки на покупку - зеленый цвет, и на продажу - красный цвет. Значки выставляются согласно сформированным баровым моделям после их подтверждения. Индикатор Price Bars and Chart Patterns работает на всех тайм-фреймах.Входные параметры отсутствуют. Индикатор Price Bars and Chart Patterns самостоятельно проделывает р

Echter Angebots- und Nachfrageindikator - ermöglicht es Ihnen, die Position von Widerstands- und Unterstützungsniveaus in allen Zeitrahmen schnell zu bestimmen. Der Indikator wird für diejenigen nützlich sein, die technische Analysen in ihrem Handel verwenden. Der Indikator ist einfach zu verwenden, ziehen Sie ihn einfach per Drag-and-Drop auf den Chart und der Indikator zeigt Ihnen die wahrscheinlichsten Unterstützungs- und Widerstandsniveaus. Wenn Sie den Zeitrahmen wechseln, sehen Sie

Reversal Sniper is designed to find the extreme reversals of the price. Indicator collects data of Cycle Sniper Indicator.
NOTE: REVERSAL SNIPER Indicator is made for Cycle Sniper Users as an additional tool. However, it can be used by the traders who look for finding out strong reversal levels.
Indicator works on all timeframes and all instruments.
Reversal Sniper Checks: Harmonic Patterns RSI Zig Zag and Harmonic Swings Cycle Sniper Indicator's Buy / Sell Signals The complex algo i

The Renko indicator is a technical analysis tool used in the forex market to visualize price movements and trends by eliminating market "noise." Unlike traditional candlestick or bar charts, Renko is built based on price changes of a specified number of points, called the "brick size." When the price moves by this amount of points, a new "brick" is added to the chart. This indicator ignores time and volume, focusing exclusively on price changes. The main features of the Renko indicator include:

Ultimate Pinbar Scanner (Multi Pair And Multi Time Frame) : ---LIMITED TIME OFFER: NEXT 25 CLIENTS ONLY ---46% OFF REGULAR PRICE AND 2 FREE BONUSES ---SEE BELOW FOR FULL DETAILS A strong pinbar is clear evidence that the institutions are rejecting a particular price level.
And the more well defined the pinbar, the higher the probability that the institutions will
soon be taking prices in the opposite direction.
Pinbar patterns are widely used by institutional traders around the world.

Price Predictor is an indicator that shows precise price reversals taking into account a higher time frame and a lower time frame candle patterns calculations it is great for scalping and swing trading . Buy and sell arrows are shown on the chart as for entry signals. BIG Arrows indicates the trend - SMALL Arrows signal a trade (BUY/SELL) - A Green BIG UP Arrow with a support green line indicates a Bull Market : wait for buy signal - A Green SMALL Up Arrow after a BIG green arrow is

The indicator (Current Strength) is represented in a separate window by Blue and Pink histogram . The parameter NPeriod represents the number of bars on which we calculate the variation of forces, the recommended value is 5. The Blue histogram measures the buyers force , while the Pink histogram measures the sellers force . The change in color signifies the change in strength which leads t he price . Each drop (especially below 52.8) after touching levels 96.3 or 1.236 must be condidered
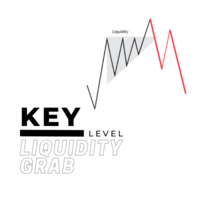
For a bullish move to occur for example, there should be alot of buying power. but you cannot buy if there is no sell on the other side, so the big players usually tend to manipulate the market in order to create available positions on the other side and be able to open their positions and one of the ways is by creating a fake breakout/ a liquidity grab. Before majority of big reversal moves and trends are formed, a liquidty grab would have occured in order to have enough orders to push for the

VOLLSTÄNDIGE FOREX-MARKTANSICHT Dashboard-Anzeige
Dies ist ein benutzerdefinierter Indikator, der erstellt wurde, um Händlern einen vollständigen Überblick darüber zu geben, was auf dem Markt vor sich geht. Es verwendet Echtzeitdaten, um auf den Markt zuzugreifen und alle Informationen anzuzeigen, die für einen erfolgreichen Handel erforderlich sind.
INSTALLATION:
Bevor Sie diesen Indikator an Ihren Fenster-Chart anhängen, gehen Sie zum Market Watch Panel Ihres MT4 und AUSBLENDEN Sie al

Der Indikator findet die Niveaus des maximalen und minimalen Preisvolumens (Marktprofil) auf dem Arbeitsbalkendiagramm für die angegebene Anzahl von Balken. Verbundprofil. Die Höhe des Histogramms ist vollautomatisch und passt sich an jedes Werkzeug und jeden Zeitrahmen an. Der Algorithmus des Autors wird verwendet und wiederholt bekannte Analoga nicht. Die Höhe der beiden Histogramme ist ungefähr gleich der durchschnittlichen Höhe der Kerze. Smart Alert (Smart alert) hilft Ihnen, den Preis i

Suggested timeframes to trading :M1-M5 - M15-M30 -H1 wait london and newyork markert open after wait best then select the best strong index and weakest index by sniper. histogram is indicated by one arrow at a time. The signal in the end direction of weak and strong all red and green mean trending index,natural market is displayed only in white SL Sniper Indicator can be used for short term long and scalping. It is better to confirm entry signals with high low price action. currency is gaining
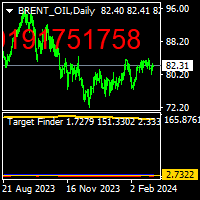
THISE INDICATOR NOT WORK ON FREE DEMO. there is a protocol to work it. target finder indicator is a forecast the find probably targets.up and down. to use thise indicator, there is a protocol,i explain below. first load indicator you will see blue and red lines. on the left side look to the higher value of line ,and draw horizantal line on top it. and on the right side see the LEVEL NUMBER.
Finding UP TARGET h=put that level number m=1 b=1 pres ok. you will see on the screen ,on top right ,r
This indicator shows you the angle of the moving average according to your settings in a separate window. It also shows the angle written on the chart, which can also be adjusted. The main features and input variables provided include: MAPeriod: This is the period for your moving average. The default MAPeriod is 5. LookBack: This is a very important variable. It allows you to set the look back bar, from which the angle will be measured. For example, if your LookBack is 5, then indicator will cal

DERZEIT 20% RABATT!
Die beste Lösung für jeden Newbie oder Expert Trader!
Dieser Indikator ist ein erschwingliches Handelsinstrument, da wir eine Reihe von proprietären Funktionen zusammen mit einer neuen Formel integriert haben.
Der Advanced Accumulated Currency Volume Indicator ist spezialisiert auf die 28 wichtigsten Forex-Paare und funktioniert auf allen Zeitrahmen. Es handelt sich um eine neue Formel, die auf einem einzigen Chart das gesamte Währungsvolumen (C-Volumen) von AUD, CAD,

Universal Swing Arrows ist ein pfeilbasierter Indikator, der entwickelt wurde, um Swing-Trading-Signale bereitzustellen. Es kann für jedes Handelspaar und jeden Handelszeitrahmen verwendet werden. DIE PFEILE ERSCHEINEN AUF DER AKTUELLEN (0) KERZE. DIE SIGNALE NICHT NEU LACKIEREN! Der Indikator kann als eigenständiges Handelssystem oder als Teil Ihrer persönlichen Handelsstrategie verwendet werden. Der Pfeil des Indikators ist nicht nur ein Signal, sondern auch Ihr mögliches Stop-Loss-Level. Der
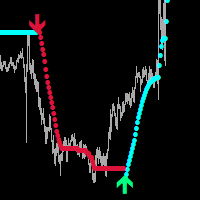
Global Parabolic MT4
Indicator for scalping on M1-M5.
A very good indicator for your trading system, it can be used as a standalone
trading system, I recommend using it together with - System Trend Pro
The indicator does not repaint and does not change its data.
Settings:
Change the FILTER parameter for accurate market entries.
Any questions? Need help?, I am always happy to help, write me in private messages or
In telegram

Der Forex TPA Indikator deckt die wahren Aktionen der Marktmacher auf, immer dann wenn sie passieren. "Kämpfe nicht gegen die Marktmacher an, sondern folge ihnen", ist wohl der beste Rat, den ein Trader bekommen kann. Der TPA Indikator zeigt jedesmal seine Signale an wenn die Bullen definitiv stärker sind als die Bären und umgekehrt. Dieser Indikator wurde VON Tradern FÜR Trader gemacht und ist 100% NICHT NACHZEICHNEND! Signale werden STRENG am Schluss einer Kerze generiert. Das sagen unsere Ku

The indicator automatically builds Support/Resistance levels (Zones) from different timeframes on one chart.
Support-resistance levels are horizontal lines. As a rule, the market does not respond to a specific price level, but to a price range around the level, because demand and supply of market participants are not formed clearly on the line, but are “spread out” at a certain distance from the level.
This indicator determines and draws precisely such a price range within which strong pos

Grey worm This indicator is a group of indicators combined
Volatility and saturation give us buying and selling and many more things
Use this indicator with your technical analysis or strategy
Do not use it alone and it will give you very good results
It is valid to work on all pairs, metals and instruments
If you have any question, I will be happy to answer it
Please do not forget to rate the good and the positive comment

Anzeige der Sonarmechanik. Kontaktieren Sie mich nach dem Kauf, um die SonarHistogram-Leistungsbilanzanzeige kostenlos zu erhalten! Der Sonar Mechanic-Indikator ist ein wirklich funktionierender Indikator, denn er arbeitet mit drei Algorithmen des Autors, die Trend- und Gegentrendsignale für den Markteintritt korrekt identifizieren. Der Indikator funktioniert für alle Vermögenswerte und Zeitrahmen. Indikatoren-Leitfaden: https://www.mql5.com/en/blogs/post/750128 Bei Gold und Währungspaar

Introduction Harmonic Patterns are best used to predict potential turning point. Traditionally, Harmonic Pattern was identified manually connecting peaks and troughs points in the chart. Manual harmonic pattern detection is painfully tedious and not suitable for everyone. You are often exposed under subjective pattern identification with manual pattern detection. To avoid these limitations, Harmonic Pattern Plus was designed to automate your harmonic pattern detection process. The functionality

A Swing Failure Pattern ( SFP ) is a trade setup in which big traders hunt stop-losses above a key swing high or below a key swing low for the purpose of generating the liquidity needed to push price in the opposite direction. When price 1) pierces above a key swing high but then 2) closes back below that swing high, we have a potential bearish SFP . Bearish SFPs offer opportunities for short trades. When price 1) dumps below a key swing low but then 2) closes back above that swing low, we have
MetaTrader Market - der einzige Shop, in dem man Handelsroboter als Demoversion herunterladen und testen sowie anhand historischer Daten optimieren kann.
Lesen Sie die Beschreibung und Bewertungen anderer Kunden über das gewünschte Produkt, laden Sie es direkt ins Terminal herunter und erfahren Sie, wie man einen Handelsroboter vor dem Kauf testet. Nur bei uns können Sie ein Programm testen, ohne dafür zu bezahlen.
Sie verpassen Handelsmöglichkeiten:
- Freie Handelsapplikationen
- Über 8.000 Signale zum Kopieren
- Wirtschaftsnachrichten für die Lage an den Finanzmärkte
Registrierung
Einloggen
Wenn Sie kein Benutzerkonto haben, registrieren Sie sich
Erlauben Sie die Verwendung von Cookies, um sich auf der Website MQL5.com anzumelden.
Bitte aktivieren Sie die notwendige Einstellung in Ihrem Browser, da Sie sich sonst nicht einloggen können.