Kostenpflichtige technische Indikatoren für den MetaTrader 4 - 44

Der technische Indikator „Currency Heat Wave Ultimate“ ist ein wertvolles Tool, das Händlern Echtzeiteinblicke in die Stärke wichtiger Währungen bietet. Mit der Analyse von 28 Währungspaaren bietet es einen umfassenden Überblick über die Währungsstärke direkt auf dem Chart und ist damit äußerst komfortabel zu bedienen. Durch den dynamischen Farbwechsel können Händler die Positionen von Währungen schnell erkennen und fundierte Entscheidungen treffen. Eines der bemerkenswerten Merkmale von Cur

Индикатор RegressionXP рассчитывает два типа регрессии и вычисляет среднеквадратичную девиацию цены на данном диапазоне. Важна прямая золотая линия (регрессия первой степени), показывающая направление и состояние текущего тренда на выбранном таймфрейме. Чем больше угол с горизонталью, тем сильнее тренд. Таким образом, мы имеем возможность делать выводы относительно состояния валютной пары по текущему расположению цены относительно линии регрессии. На расстоянии от золотой линии проходят параллел

The TrendLSMA indicator is very reliable because it is based on moving averages. The TrendLSMA feature is the presence of a signal for entry / exit - the indicator line indicates in a certain color the signals "buy" or "sell". The accuracy of this signal is very high, 95% success rate for 5% failures. TrendLSMA is also suitable for exiting a position. The indicator almost completely captures the trend, but during flat it is necessary to use filters. When entering a position, you will always work

Scalpinez ist ein komplettes Scalping-System. Der Indikator selbst analysiert den Markt und gibt dem Händler klare Signale für das Öffnen und Schließen von Aufträgen. Derselbe Indikator gibt Empfehlungen zur Größe von TakeProfit. StopLoss - Rücksignal. Das heißt, wenn wir eine offene Verkaufsorder haben und TakeProfit noch nicht hatte, scheint ein blauer Pfeil zu kaufen - wir schließen die Verkaufsorder.
Das Arbeiten mit dem Scalpinez -Indikator reduziert sich daher auf die Befolgung seiner An

Pisces TheProfitZone
"Pisces TheProfitZone MT4 Indicator Powered byFxGangster" This indicator will calculate new support and resistant zone everyday, and that give us a trading zone such as thats telling us TP and SL, So it still telling us for where should the price will go reach?
Fore Example. Uptrend : If Price can stay upper a Line and price close higher above a Line, then the price will continue go up to reach next Line. Downtrend : If Price can't pass to stay upper a Line and the pr

Индикатор DivergenceMRDM ситуацию, когда направление движения цены и технических индикаторов не совпадает. Что можно воспринимать как точки для входа в рынок, точки потенциального разворота рынка. Чаще всего проявляется сигнал при достижении индикатором зоны перекупленности или перепроданности. Один из четырех индикаторов: MACD , RSI , ADX , Momentum . Готовая торговая система. Индикатор не перерисовывается и не запаздывает 95% сделок прибыльные. Работает на всех валютных парах и на всех таймфр

Losser is one of the implementations of the indicator to protect the position from loss. Similar implementations exist, it is not a complicated algorithm. The principle is very simple, practical and effective - they are implemented in this indicator, which will help traders protect their deposit from loss. The indicator uses a series of moving averages, which, with a given Length step, form the resulting lines that are displayed on the price chart as blue and red lines. These lines are the level

ZeroPoint signals a change in the moving average angle, the LevelZero parameter sets the zero point circle, there are limits from -LevelZero to LevelZero including will be considered the zero point, it can be indicated in red on the histogram.
Options: LevelZero - zero point [-LevelZero, LevelZero]; Length - the length of the moving average; Start - the starting point for calculating the angle; End - is the end point for calculating the angle; MetodMA - averaging method; AppliedPri

The premium loudness indicator draws on the chart of a currency pair based on data on the price level in the back period in the input parameters of the indicator in the form of a histogram. The width of the histogram at this level means, conditionally, the number of transactions conducted on it If the broker provides real volume data, Cannot be received For example, the range H1 can be specified as H1, H4, D1, W1, MN1. For M1, it is recommended to use periodic settings for M5 values.

the zigzag indicator draws lines on the chart from the highest point to the lowest
There are built-in fibonacci levels
built-in sound alert
the indicator highlights trends on small timeframes with a thin line and trends highlights with a coarse line
Fibonacci levels can be turned on and off in the settings settings are very simple and clear
the same sound alert can be turned on and off, you can change the colors of the lines.

Premium Volume Lite The Premium Volume Lite indicator plots the distribution of deals according to price levels in the form of a histogram on a chart of a currency pair. The width of the histogram at this level means, conditionally, the number of transactions carried out on it. If the broker provides data on real volume, the indicator can show the distribution over it. Ranges can be equal only to standard timeframes not lower than the current one. о periods value is current then the indicator wi

The Invisible Sniper arrow indicator is built on the use of candlestick analysis. The indicator finds the “Absorption” reversal candlestick patterns on the price chart and, depending on the figure, bullish or bearish absorption, gives a signal to enter in the form of blue arrows to buy, red to sell. in the indicator Invisible Sniper implemented sound and text alert..

ArcTrend - The indicator should be used to enter the market, it looks like two moving averages, but this is only a first impression. The algorithm for calculating the indicator is completely different and quite complex. When using the indicator, use either the feet or the filter in the flat. Do not use take profit to close, it is much better to use a trailing stop. Indicator without parameters.

Big Scalper Pro комбинированный осциллятор, отображающий на ценовом графике Сигналы на вход отображаются в виде стрелок соответствующего цвета, а также дублируются текстовым сообщением. есть звуковые и текстовые алерты push уведомления уведомления на email все это можно включить и выключить в настройках индикатора настройки период это период г л авного индикатора в период это период дополнительного индикатора волатильности
Технический индикатор Forex ForexMarshalsTrend - это уникальный, эксклюзивный и прорывной финансовый инструмент, основанный на сложном математическом алгоритме колебаний стоимости конвертации цены, который способен прогнозировать дальнейшие изменения цены. Индикатор относится к группе трендовых индикаторов. Он предоставляет возможность принимать правильные решения о своевременном входе или выходе из рынка и в своих настройках указывает, следует ли открывать длинную или короткую позицию для получ
Dawn In Trading indicator is a new ray of light in trading! This indicator has been tested on a real chart in real trading; All statistics about this indicator from real trading on the market! From the screenshots you can see the profitability of quality and the number of signals of this tool, you can also check it in the tester! As soon as a blue arrow appears, open a deal to increase, when a red arrow appears, open a deal to fall!
Signals appear when you open a new candle and do not redraw,

Подкрашивает аномально большие тиковые объёмы в красный цвет. Имеет следующие настройки: "Процент" по умолчанию "70" (Процент на который аномальный объём должен быть больше предыдущего) "Уровень" по умолчанию "500" (Количество тиков, больше которого будем брать во внимание аномальный объём) Внимание! Данный индикатор был разработан для мелких таймфреймов M1,M5,M15. Идея в том, что на таких Таймфреймах увеличение количества тиков говорит об увеличении количество сделок, увеличения интереса к цен

FairyFibo can generate as many as 70 different BUY signals and 70 different SELL signals solely based on Price Action and Fibonacci levels. The idea is to catch as many as Swing High's and Swing Low's but with the consideration of the current trend mind. This indicator can be also used for Binary Options Trading as most of the time price tends to follow the signal direction immediately. Most of the strategies are already optimized for different time frames and different market conditions. While

The SpecialBands indicator works equally well on any timeframe. For trends of average duration, it is recommended to use the standard setting. For the analysis of short-term trends, it is better to use a smaller indicator value. For the study of long-term trends it is recommended to use the indicator value greater than the standard.
Most often, the exponential method is used to calculate the indicator, but other varieties can also be used.
SpecialBands is a collection of lines. The two centr

TargetX of the best Forex indicators, which is equipped with the most modern, adaptable and profitable trading algorithms. It is time to stop wandering in the dark and gain a clear vision of goals in intraday trading, for which this indicator was created.
One of the secrets of short-term trading is to know when to enter a trade. At the same time having the potential to earn the maximum number of points, but without unnecessary sitting out in the transaction in the hope of a ghostly profit. And
Этот инструмент поможет собрать сигнальную индикатор без программирования, для Форекс или Бинарных опционов , на основе Ваших условий . И самое главное, создаст отдельный файл-исходник этого сигнального индикатора(.mql4). В условия для сигнала можно включить такие стандартные индикаторы, как: RSI, CCI, BolingerBands и др. Также Вы можете использовать до 3-х сторонних индикаторов-стрелок (с буферами), фильтр по направлению свечи, соотношение тела свечи к теням, фильтр по часу и минуте времени

Create your Dashboard with few clicks! With the Custom Dashboard Wizard you'll be able to create your dashboard also without any programming knowledge. This indicator/panel will give you the possibility to add/remove the values of the Metatrader4 standard indicators in any time frame you like, with any value you like and in any market you like, just be careful about writing the market name exactly as it's written on the list of your Market Watch. The main panel will be composed of three columns
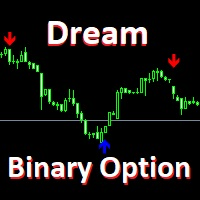
It is possible to trade on any basic asset, but the experts holding testing give preference to currency pair USD/JPY, EUR/USD. Optimum time for work is considered European, the American session.
with the standard settings which are already perfected to an ideal
At emergence of a blue arrow under a candle the option UP is acquired.
At emergence of a red arrow the option DOWN is acquired.
It should be noted one feature of the indicator: the signal is formed on the current bar, but it is wo
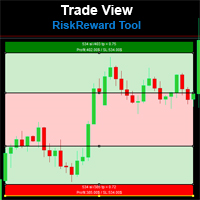
Risk Reward Tool , It is easy to use. With this tool you can see the rates of profit loss profit. You can see your strategy and earnings reward status of your goals.Double calculation can be done with single tool. Move with drag and drop. You can adjust the lot amount for calculations. The calculation results are shown in the comment section. There may sometimes be graphical errors during movements. Calculations works at all currency. Calculations All CFD works. Updates and improvements will co

The FactorT indicator indicates the price blocks by the method of its behavior. If a new square begins, then the price changes its behavior. You should also interpret the value of the indicator if the square ends. That is, each transition means that the price changes its behavior. This indicator can be used in various expert systems.
For example, if a series of orders is open and we are waiting for its completion and at the same time, the price has changed, this means that you need to leave th

Indicator values are in the range 0-100.
The greater is the indicator value, the greater is the market stability,
so the more likely we have trend.
The smaller is the indicator value - the less probable the trend is.
Tips:
Trading on unstable market:
Buy, when moving average (blue line) of the CMI indicator is below 40 and the histogram is red.
Sell when moving average (blue line) of the CMI indicator is below 40 and the histogram is green.
Close positions when CMI his

The indicator shows Profit Zones on the chart, displaying the beginning and end of the local trend Profit Zone PRO is perfect for all Meta Trader symbols: currencies, metals, cryptocurrencies, stocks and indices
Advantages of the Profit Zone PRO indicator:
Indicator signals without redrawing The algorithms of the indicator allow you to find the ideal moments to enter a transaction (purchase or sale of an asset), which increase the success of transactions for 100% of traders. The indicator

Arrow indicator, for determining price reversals Arrow appears on the closed bar Allows you to enter the transaction at the very beginning of the turn Can be used on any currency pairs, metals and cryptocurrency Suitable for working with binary options
Distinctive features Determines the price correction; Advanced settings for fine tuning; It works on all timeframes and on all symbols; Suitable for trading currencies, metals, options and cryptocurrency (Bitcoin, Litecoin, Ethereum, etc.) Suita

Trade on the levels - the classic in the work of the trader. The ReversLevel indicator is one of the easiest but not less effective tools. From these levels you can build turning points, levels are constructed as statistical significance at a given time. You can use them as a ready-made trading strategy or as an additional filter in your trading system. In the settings you can set the offset for building levels.
*Non-Repainting Indicator Message Me Immediately After Purchase For VIP Installation Help and Free Strategy Bruce's Price Predictor is an indicator that shows precise price reversals. A great arsenal to add to any chart. Bruce's Price Predictor points price reversals with high degree of accuracy and it is great for scalping on the 1min time frame, Or swing trading on the 1hr time frame. Buy and sell arrows are shown on the chart as for entry signals. They do not repaint but confirmation ent

KT Volatility oscillator analyze the past and current market data with a mathematical formula to display the result in a form of an oscillator. The growing and deteriorating waves are equivalent to high and low volatility in the asset. In a nutshell, volatility is simply a measurement of the price fluctuation of an asset over a certain period of time. Without volatility, there would not much movement in the market and traders would not be able to profit from the price movements.
Use of Volati

NIEMALS neu lackieren. Indikationen werden von nah zu nah gegeben. Für den alleinigen Gebrauch konzipiert, es sind keine weiteren Indikatoren erforderlich. Gibt Ihnen zu Beginn des Tages den Trend und den potenziellen Take-Profit. Eine spezifische Grafik zeigt Ihnen den potenziellen Gewinn gemäß den historischen Daten.
Wie funktioniert es Breakout Pro Scalper Solution verwendet eine Breakout-Strategie in Kombination mit Kursbewegungen und dynamischer Unterstützung und Widerständen. Der Nach

Ещё один простой информационный индикатор, показывающий самые важные торговые сессии валютного рынка. О понятии торговых сессий.
Всем известно, что торговая сессия – это промежуток времени, в течение которого банки и другие
участники рынка ведут активную торговлю, при этом активизируются в определённые часы рабочего дня.
Валютный рынок, рынки акций и сырьевые рынки работают круглосуточно с понедельника по пятницу, кроме праздничных дней.
Когда в одной стране ещё спят, в другой рабочи

The SuperRSI indicator is an advanced index of internal strength. The indicator shows not the relative strength of the trading instruments being compared, but the internal strength of a single instrument, therefore, it is the “Internal Strength Index”. This is an advanced form of the SuperRSI indicator. It converts the signal so that low-frequency components are delayed much more than high-frequency components. In general, the data of the last bar have more weight than previous data, like an exp

Volume indicators are used mainly in the stock market. Forex volumes are peculiar (teak). Why Forex can not track normal volumes? The fact is that this is an over-the-counter market. Consequently, to calculate the volume of purchases and sales by one instrument, practically, is not real. Many Forex traders at all abandon the volume indicators in their work. But for those who want to use them, there are some interesting tools, and one of them is VolumeVA . Volume Volume Volume indicator reflects

Indicator RangeChannel (RC) or, band channel indicator. The use of the indicator allows the trader to react in time for the price to go beyond the limits of the channel established for it. This corridor is built on the basis of the analysis of several candles, starting from the last one, as a result of which the extremes of the investigated interval are determined. They create the lines of the channel.
A sell signal occurs when the price touches the lower border and, conversely, the contact wi
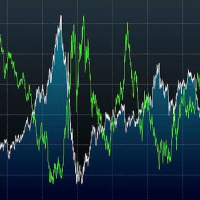
CorrelationUSD is a basic indicator, which is located on the chart. This tool allows you to monitor the relationship between assets, it reliably determines the patterns of quotation changes of one relative other asset. What is the indicator? All basic assets are interconnected, first of all, by a full complex of essential fundamental factors. For example, most currency pairs have a strong influence on measurements of each other’s quotes. Trends of this kind create macroeconomic news.

Dieser Multi-Time-Frame- und Multi-Symbol-Trendindikator sendet eine Warnung, wenn ein starker Trend oder eine Trendumkehr identifiziert wurde. Es kann dies tun, indem es den Aufbau des Dashboards mit dem gleitenden Durchschnitt (einfach oder doppelt (MA-Crossover)), RSI, Bollinger-Bändern, ADX, zusammengesetztem Index, Parabolic SAR, Awesome (AO), MACD (Signallinie), Stochastik-Crossover oder Hull Moving Average . Es kann mit allen Zeitrahmen von M5 bis MN verwendet werden. Die Farben i

boss ! Trading opportunities can be used in any underlying asset, but experts in conducting tests prefer the currency pair USD / JPY.
The most favorable time for work is the European, American session.
When the blue arrow appears, a red option under the candle is acquired UP.
When the red arrow appears, the option DOWN is acquired. It is recommended to avoid trading during strong news releases

A pretty common candlestick Price Action is a 1-2-3 pattern. The appearance of this formation predicts a turn of the market with a high degree of probability. In most cases, pattern trading brings even a small but stable profit with low risks. Trading based on a 1-2-3 pattern can be carried out absolutely on all time frames, on charts of any currency instruments, as well as on the futures market. The structure of the model is not complicated, but this does not prevent us from finding good points

Arrow indicator showing market trends The histogram shows the direction of movement, and the arrows indicate favorable points for opening positions. Can be used on any currency pairs, metals and cryptocurrency Suitable for working with binary options
Distinctive features Defines a change in trend; Works on all timeframes and on all symbols; Suitable for trading currencies, metals, options and cryptocurrency (Bitcoin, Litecoin, Ethereum, etc.) Suitable for manual trading and for developing advi

Basierend auf MACD-Indikatorwellen mit Standardparametern
Wendet Fibonacci-Werte auf die letzten beiden MACD-Wellen an, jeweils positiv und negativ,
wenn der MACD-Indikator im Moment keine negative Welle mehr hat - die Farbe ist grün,
wenn der MACD-Indikator im Moment keine positive Welle mehr hat - die Farbe ist rot.
Das Wave-Abschlusskriterium sind zwei Ticks mit unterschiedlichem MACD-Zeichen.
Wendet Trendlinien auf die letzten vier MACD-Wellen an. Arbeitet gut mit dem Experten zus
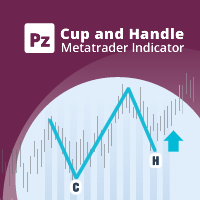
Das Cup and Handle-Muster ist eine technische Preisbildung, die an einen Cup und einen Henkel erinnert, wobei der Cup die Form eines "U" hat und der Henkel leicht nach unten abweicht. Die rechte Seite des Musters - der Griff - ist kleiner als die linke Seite - die Tasse - und zieht sich von oben nicht mehr als 50% zurück. Es kann sowohl ein Fortsetzungs- als auch ein Umkehrmuster sein. [ Installationsanleitung | Update-Anleitung | Fehlerbehebung | FAQ | Alle Produkte ] Klare Handelssignale Anpas
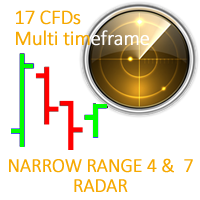
This ALL IN ONE indicator detects Inside Bar Narrow Range 4 and Inside Bar Narrow Range 7 two powerful patterns on 17 CFD on all timeframes. "Inside Bar Narrow Range 4" is an inside bar with the narrowest range out of the last 4 bars so "Inside Bar Narrow Range 7" an inside bar with the narrowest range out of the last 7 bars.
Hence, IBNR4 and better IBNR7 are an objective criterion for identifying decreased range and volatility. Once we find an IBNR4 or an IBNR7 pattern, we aim to trade th

This is the binary options signal you all have been looking for. This in a modified version of the Garuda Scalper, that has been modified for Binary Options traders. Signals are very unique! Why this is so effective for binary options is because it is a trend following system, it understands that the trend is your friend. It takes advantage of the buying/selling after the pullback in continuation of the current trend wave. Because signals are generated after the pullback, you can place shor

This indicator was tested on the basis of real statistics for all market indicators according to indicators for 3 months of trading. trade forecasts for usd / jpy on the m30 time frame were received on our statistics! if you have any questions, please contact us in private messages or in discussions under this indicator and we will figure it out and help
any questions will arise personal messages or in discussions under this indicator As soon as the blue points appear, we open a deal to incr
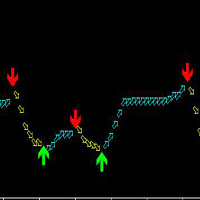
Diese indikatoren auf jeder für den metatrader 4 sorten, aber auch für jeden zyklus, aber am besten geeignet IST in 30 minuten und 4 stunden Zeit, MIT einfachen, pfeil erscheint Absolut nicht verändern, nicht treiben, nicht danach.
Der index beruht auf dem Prinzip der ATR und benutzerdefinierte ma plus gemischt, berechnung und erfunden, präzise.
Kaufen: sehen Die Grünen pfeil nach Oben.
Zu verkaufen: der rote pfeil nach Unten zu sehen.
Pfeil erscheint sofort bestellen!
Vorschlag für zw

Trading Session Advanced
This indicator was designed to indicate trading sessions in a chart. It draws boxes for each trading session in different colours. Trading Sessions: - London Session - New York Session - Tokyo Session - Sydney Session
Some currencies are best traded during certain trading sessions. - EUR, GBP & CHF currencies have high volatility during London session. - USD & CAD currencies have high volatility during New York session. - AUD, NZD & JPY currencies have high volatili

The indicator helps to identify possible rollbacks and reversals. Shows the direction of the price movement and is painted in the appropriate color. Allows you to conduct trend and counter trend trading It works on all timeframes, on any currency pairs, metals and cryptocurrency Can be used when working with binary options Distinctive features Does not redraw; Simple and clear settings; It works on all timeframes and on all symbols; Suitable for trading currencies, metals, options and cryptocurr
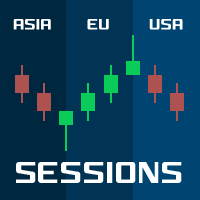
Sessions PRO is a perfect tool which divide your chart screen by 3 main market sessions: 1> asian 2> european (with division for Frankfurt and London start) 3> american
Sessions PRO is perfect especially for trading indices, where main pivot points often occurs along with new market center enters the market. With Sessions PRO you see what events happened at their exact corresponding time - European and American moves and pivot points are much more important than asian. Stop analyzing your char

UniversalIndicator is a universal indicator. A great helper for beginners and professional traders. The indicator algorithm uses probabilistic and statistical methods for analyzing the price of a trading instrument. The indicator is set in the usual way. Advantages of the indicator works on any time period works with any trading tool has a high probability of a positive forecast does not redraw Indicator Parameters LengthForecast = 30 - the number of predicted bars

This indicator will let you have at disposal Gann's Eighth, with few clicks!! Gann's Eighth were used by this great Trader to obtain the maximum fluctuation price and the possible inversion points of it. Gann have always given importance to the number 8 in his studies, an it is the reason why we find the retracement points as 0.25(10/8=1.25). Other than the number 8, also the numer 3 had is own importance in Gann, number founded in the eighth division, infact we have three eighth describing the
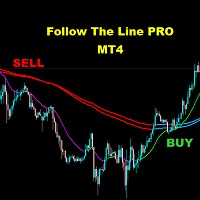
FOLLOW THE LINE (PRO VERSION) This powerful indicator is the full and complete version of my free indicator called "Follow The Line". IT IS BASED ON the popular maxim that: "THE TREND IS YOUR FRIEND" It gives alarms and alerts of all kinds. IT DOES NOT REPAINT and can be used for all currency pairs and timeframes.
AVOID FALSE SIGNALS:
BUY ONLY when price closes above the green line and the green line is above the blue channel.
SELL ONLY when price closes below the pink line and the pink lin

Over Arrow - уникальный авторский индикатор, имеющий возможность отображения сигналов в направлении основной тенденции, или против нее. Over Arrow подходит для любого таймфрейма, валютной пары, но лучше всего использовать его на средних временных периодах, таких как М30, Н1, Н4. Сигналы индикатора не пропадают ни при каких условиях. Отличительной особенностью является наличие фильтра тенденции, при активации которого, сигналы будут появляться только в направлении основного движения.
Параметр
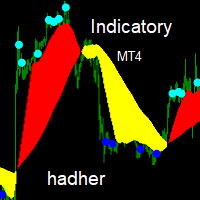
Indicatory is an indicator uses price action and averaging movement to trigger it's signals buy signal when the blue sun completely sunset's under the yellow clouds Sell signals when the aqua sun completely rise's over the red clouds you could call the indicator to any EA code for auto trading ,optimizing,sell signal index buffer number is (2) buy signals index buffer number is (3)... try to avoid weak signals which occur at the end of clouds ,strong signals occur's when there is a wid

Dieser Indikator zeichnet Ebenen, die sehr "Adamant" und stark sind.
Diese Levels sind ein starkes Preisverwerfungslevel für ein Leben und werden niemals neu gestrichen.
Um alle meine Logikebenen in Ihr Handelssystem zu integrieren, sind 6-monatige Abonnements aller Logikebenen zum Preis von 1 Monat erhältlich.
Hoffe das wird hilfreich sein.
Haftungsausschluss: Wenn Sie nach einem schicken, farbenfrohen und auffälligen Indikator suchen, bleiben Sie bitte fern.
Kein Trader

This is a simple and useful indicator for gold. Timeframe is 15M.
It simply shows the meanginful potential turning check point for gold.
You can combine your method with this signal. You can use it as a part of your decision signal to become a more powful strategy for yourself to get more great decision.
The indicator will not be repianted. Just simple and useful. Guys, just try it.

The Wolfalizer Indicator combines the functionality of the Engulfing Stochastic along with the ConsecutiveRSI and adds alerts along with more detailed output to the journal. This Indicator will alert you when RSI or Stochastics cross into oversold or overbought. You can set the oversold and overbought levels for RSI and Stochastics separately. You can pick if you want an engulfing candle to appear on the cross or set a number of consecutive candles you would like to see. Interesting Inputs i

Mystic Arrow - уникальный авторский индикатор, отображающий сигналы в направлении основной тенденции, и против нее. Благодаря разнообразию настроек и фильтров индикатор можно настроить под свой стиль торговли. Mystic Arrow подходит для любого таймфрейма, валютной пары. Сигналы индикатора не пропадают ни при каких условиях. Отличительной особенностью является возможность настроить сигналы индикатора отдельно для тенденции и против нее. Имеет в качестве отключаемого фильтра показания ценового кан
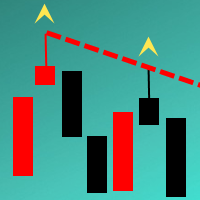
The Indicator automatically draws trend lines on the specified timeframe ( Trend lines period parameter). The lines are drawn based on the last two known fractals of the specified period. A peculiarity of this Indicator is that the lines are drawn with accuracy up to 15 minutes. It allows analyzing the chart on smaller timeframes without loosing the precision of drawing the lines in relation to the extrema of the prices. It is suitable for an intraday and medium term trading. The minimum timefr

The indicator is designed for opening trades for a long period. he is set up to get as many points from each trade as possible. he uses the scalping method... you can trade on any currency pairs indicator is already you can trade at any time of the day but the preferred time of trading during the European American session. currency pairs eur / jpy, eur / usd currency pairs with high volatility then the results are much better.

Indicator for determining adjustments and price reversals It gives signals for inputs and shows the general direction of the price movement. Allows you to conduct trend and counter trend trading It works on all timeframes, on any currency pairs, metals and cryptocurrency Can be used when working with binary options Distinctive features Does not redraw; Thanks to simple settings, you can quickly adapt to any trading instrument; It works on all timeframes and on all symbols; Suitable for trading c

Venom indicator is a new type of indicator for scalping with high accuracy of correct predictions in the indicator you can select the indicator signal does not redraw, does not disappear, you can trust it 100% When a red blue arrow appears under the candlestick, an UP option is purchased. When red arrows appear, the DOWN option is purchased. the indicator is based on our new development, if there is an order with a large amount that opens in the direction we need, according to the analysis of th
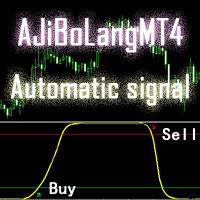
Dieser AJiBoLang-Indikator ist für alle Signalzyklen geeignet, sehr gut für Kurzzeitsignale geeignet,
Schauen Sie sich die Pfeile auf dem Chart an und machen Sie eine einzige Bestellung: Der grüne Pfeil ist der Kauf Single und der rote Pfeil ist der Verkauf Single.
Wenn die gelbe Linie nach dem Kaufauftrag in die obere Ebene geht und eine bestimmte Strecke zurücklegt, können Sie den Kaufauftrag verkaufen.
Wenn der Sell-Vorgang einmalig ist und die gelbe Linie eine bestimmte Strecke zurückl
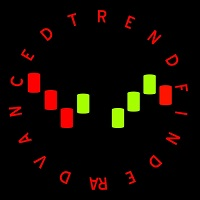
Advanced Trend Finder follow trend. Color change trend changed.
Works in EURUSD/GBPUSD/XAUUSD/USOIL/US500/USDJPY/USDCAD/JP225/USDTRY/USDMXN and all pairs
Best timeframes 5M/15M/1H/4H/DAILY
Signal on close of a bar.
DOES NOT repaint. DOES NOT repaint. DOES NOT repaint. DOES NOT repaint.
DOES NOT recalculate. DOES NOT recalculate. DOES NOT recalculate. DOES NOT recalculate Settings SoundOn : true/false EmailOn : true/false PushNotificationOn : true/false
ver 1.1 update notes:
Added A

The diamond top and bottom are reversal patterns. It represents a rally to a new high with a drop to a support level followed by a rally to make a new high and a quick decline, breaking the support level to make a higher low. The bounce from the higher low is then followed by a rally, but making a lower high instead. Once this behavior is identified, prices then break the trend line connecting the first and second lows and start to decline further. You can find MT5 version hier
Indicator shows

Dies ist eine einzigartige MACD-Anzeige, die genauer und einfacher zu bedienen ist als herkömmliche MACD. Es ist für jeden Chartzyklus geeignet und für jede Marktvielfalt geeignet.
Die rote Spalte ist das (Buy) Bandsignal und die blaue Spalte das (Sell) Bandsignal.
Die gelbe und grüne Linie sind Trendlinien und die beiden Linien kreuzen sich nie.
Kaufen: In der blauen Spalte die grüne Linie durch die mittlere 0-Achse betrachten.
Verkaufen: In der roten Spalte die gelbe Linie entlang der

There are a lot of support tools in the Forex trading market, such as ea - robot., to help the transaction become automated and can be traded 24 hours a day, and there are also lots of points. The quote is called an "indicator", such as: sar parabolic, cci, macd., bollinger band ... combining all the junk issues will give a "signal" and we call it "trading signal". But,null, and perhaps many market participants have not defined what the trend is, and what is the wave, to have more effective "str
The indicator shows on the selected range tick volumes in the form of a horizontal histogram Highlights the maximum and most significant price levels near which correction and price reversals are most likely Allows you to conduct trend and counter trend trading using support and resistance levels It works on all timeframes, on any currency pairs, metals and cryptocurrency Can be used when working with binary options Distinctive features Shows the most significant levels of support and resistanc

Der Exit Area Ultimate ist ein technischer Indikator, der Handelsentscheidungen verbessern soll, indem er die täglichen Werte der Average True Range (ATR) und Average Daily Rate (ADR) auf dem Chart anzeigt. Durch das Verständnis dieser Niveaus können Händler die durchschnittliche Bewegung eines Vermögenswerts im Laufe des Tages leicht einschätzen. Dieser vielseitige Indikator dient Daytradern mehreren Zwecken: Er hilft bei der Auftragserteilung, der Identifizierung von Intraday-Tende
MetaTrader Market - der einzige Shop, in dem man Handelsroboter als Demoversion herunterladen und testen sowie anhand historischer Daten optimieren kann.
Lesen Sie die Beschreibung und Bewertungen anderer Kunden über das gewünschte Produkt, laden Sie es direkt ins Terminal herunter und erfahren Sie, wie man einen Handelsroboter vor dem Kauf testet. Nur bei uns können Sie ein Programm testen, ohne dafür zu bezahlen.
Sie verpassen Handelsmöglichkeiten:
- Freie Handelsapplikationen
- Über 8.000 Signale zum Kopieren
- Wirtschaftsnachrichten für die Lage an den Finanzmärkte
Registrierung
Einloggen
Wenn Sie kein Benutzerkonto haben, registrieren Sie sich
Erlauben Sie die Verwendung von Cookies, um sich auf der Website MQL5.com anzumelden.
Bitte aktivieren Sie die notwendige Einstellung in Ihrem Browser, da Sie sich sonst nicht einloggen können.