Kostenpflichtige technische Indikatoren für den MetaTrader 4 - 33
Pivot Cluster
Pivot Punkte sind markante Linien, die auf dem Preis basieren und mögliche Unterstützungen und Widerstände darstellen. Unglücklicherweise gibt es mehr als eine Art diese zu berechnen. Berücksichtigt man verschiedene Arten der Pivot Punkte (beispielsweise Fibonacci Pivots) so sieht man gewisse Gemeinsamkeiten an bestimmten Kursen. Dadurch lassen sich mögliche Unterstützungs- oder Widerstandszonen besser erkennen.
Dieser Indikator bietet die Möglichkeit diese Zonen auf einen Bl

COSMOS4U Adaptive Pivot Indicator, is a straightforward and effective way to optimize your trade decisions. It can be easily customized to fit any strategy. Get an insight into the following features, incorporated in COSMOS4U Adaptive Pivot: Three ways of monitoring trades (Long, Short, Long and Short), Periods used to calculate high and low close prices in order to declare opening position before or after Take Profit, All timeframes supported (M1, M15, H1, H4, D, W, M…), All symbols, Colors for
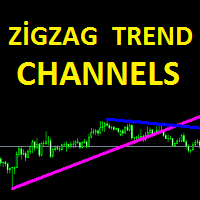
ZigZag Trend Channels indicator is designed to find channel trends. This indicator uses the zigzag indicator, some channel lines and some algorithms. This indicator also sends signal warnings for processing entry points. Up trend, down trend and triangle trend formations. Easy to use and understandable. Channel lines appear on the screen and trend forms are written.
Suggestions and Features This indicator has 3 trend features. They are up trend, down trend and triangle trend formations. This i

Alpha Trend is a trend indicator for the MetaTrader 4 platform; it has been developed by a group of professional traders. The Alpha Trend indicator finds the most probable tendency reversal points, which allows making trades at the very beginning of a trend. This indicator features notifications, which are generated whenever a new signal appears (alert, email, push-notification). This allows you to open a position in a timely manner. Alpha Trend does not redraw, which makes it possible to evalua

Zip Arrow is an original indicator with flexible customization capabilities. Every user will be able to customize it according to trading style and currency pair. The indicator does not change its values, it has a filter which allows showing the signal only in the direction of the main trend.
Indicator Parameters TPeriod - trend filter setting. When the value increases, the signals will be displayed only in the direction of the main trend. It is recommended to set value above 100 for explicit

Determining the current trend is one of the most important tasks of a trading regardless of the trading style. The Atom Trend indicator can help in doing that with a fairly high probability. Atom Trend is a trend recognition indicator, which uses an original calculation algorithm. You can use it on any currency pair and every time frame. It does not change its values. The tick volume can also be used in the calculations as an additional filter.
Indicator Parameters Main Settings : VolMode - if

Determining the current trend is one of the most important tasks of a trading regardless of the trading style. The Quantum Trend Volume indicator can help in doing that with a fairly high probability. Quantum Trend Volume is a trend recognition indicator, which uses an original calculation algorithm. It does not change its readings under any circumstances. The tick volumes are used as an additional filter. You can use it on any currency pair and every time frame. It can also be used as an activi

The indicator does not repaint support and resistance levels. It shows daily, weekly and monthly percentage change of previous close with respect to actual price. It works well for Forex, indices and futures.
Settings Time Frame - select D1, W1 or MN. History - number of history for displaying the levels of a chosen period. Levels - number of current levels for displaying a chosen period. Levels value % - percentage difference between one level and another. Open color - open color from the cho

Stochastic Trend Bars indicator is the modified version of the standard stochastic indicator. This indicator is different from the standard stochastic indicator and turned into a trend bars indicator. Added visibility to understand trends. Easy to use and simple. The user will easily detect trends. You can use this indicator as a trend indicator on its own. Or as a trend filter along with other strategically relevant indicators. Easy to use and simple to understand trends.
Suggestions and Feat

Dynamic Levels is a channel indicator of dynamic levels, designed for identification of the price extremums. It allows increasing the efficiency of any strategy due to advanced parameters, which in turn allow customizing it for personal trading style. Dynamic Levels does not change its values, it is suitable for any timeframe and currency pair.
Indicator Parameters ChannelPeriod - period for the indicator calculation. ChannelSmoot - smoothing of values. ATRPeriod - volatility calculation perio

Determining the current trend is one of the most important tasks for a trader regardless of their trading style. Trend Scan is able to define a trend with a fairly high accuracy. The indicator applies the proprietary method in its calculations. Trend Scan is suitable for any currency pair and timeframe. It does not change its readings. The indicator takes into account the volume and volatility readings, combines them and displays the result as a histogram. The color of the histogram can be confi
Determining the current trend is one of the most important tasks for a trader regardless of their trading style. Price Direction is able to define a trend with a fairly high accuracy. The indicator applies the proprietary method in its calculations. Price Direction is suitable for any currency pair and timeframe. It does not change its readings. The indicator is based on volatility and the unique method. The histogram color depends on the current trend strength - the darker the histogram, the st
MACD (Moving Average Convergence/Divergence) is a classical trading indicator used in technical analysis from late 1970s. It is supposed to reveal changes in the strength, direction, momentum, and duration of a trend currencies price (also stocks, commodities etc). The New MACD indicator is an advanced model of the standard MACD indicator. You may use the New MACD absolutely the same way as classical. The main difference is that New MACD is working faster (in case of similar input parameters).
This indicator determines the average bas size (body, wicks) for the specified range.
Input parameters Mode - select the mode of the indicator: HighLow - the indicator calculates the average bar size from High to Low and displays the data in the form of a histogram at the bottom of the terminal OpenClose - the indicator calculates the average bar size from Open to Close and displays the data in the form of a histogram at the bottom of the terminal HLOC - the indicator displays data on the two

The indicator is a good tool for scalping. The entry points are defined using auxiliary indicators, such as Stochastic and Simple Moving Average. The indicator is represented by arrows showing the likely market direction. The signal appears right after the current candle close.
Recommended parameters: Currency pair - any; Timeframe - no less than М5.
Parameters Size of the indicator labe - graphical label size; The position of the indicator label (in points) - label position relative to the c

The indicator identifies trends and micro-trends, perfectly suited for those who prefer scalping. It has been developed for working on the M1 timeframe, however it also shows clear trends on the higher timeframes for long-term positions. The indicator does not redraw. The history data of the charts and prices are used for indication. This is the basis for the indicator. If the price is in the blue channel, the trend is bullish. If the price is in the red channel, the trend is bearish. It allows

The indicator calculates the price of the trading instrument based on the RSI percentage level. The calculation is performed by Close prices, so that we can quickly find out the price, at which RSI shows the specified percentage level. This allows you to preliminarily place stop levels (Stop Loss and Take Profit) and pending orders according to significant RSI points with greater accuracy. The indicator clearly shows that RSI levels constantly change, and the difference between them is not fixed
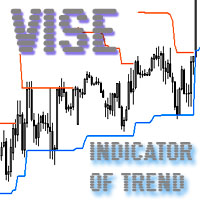
Vise is a trend indicator. The upper and lower lines follow the price showing the prevailing price direction. Frequent breakthroughs of the upper line indicate a bullish trend, while frequent breakthroughs of the lower line indicate a bearish one.
Parameters Points for UpLine - initial number of points for the upper line; Points for DownLine - initial number of points for the lower line. During the breakthrough of the upper level (line), this level shifts upwards by Points for UpLine. If the u

Ozi Arrow is a unique indicator that can display signals in the direction of the main trend and counter trend signals. For calculations, the indicator determines a price channel. If recently the price was at its borders, and all conditions of additional filters are observed, a signal is displayed in the form of arrows. Ozi Arrow is suitable for any timeframe and any pair. The indicator signals do not disappear under any conditions. A distinctive feature is the presence of a trend filter. If the
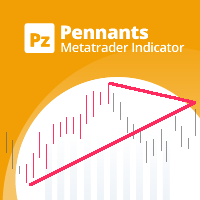
Bei diesem Indikator handelt es sich um Wimpel , bei denen es sich um Fortsetzungsmuster handelt, die durch konvergierende Trendlinien im Zusammenhang mit einer Preiskonsolidierungsperiode gekennzeichnet sind. Trades werden mit einer Breakout-Periode neben dem Formations-Breakout signalisiert. [ Installationsanleitung | Update-Anleitung | Fehlerbehebung | FAQ | Alle Produkte ] Einfach zu verwenden Anpassbare Farben und Größen Es implementiert Breakout-Signale Es implementiert Warnungen aller Ar

So incredibly useful, once you use it you will wonder why it's not built into MT4! The most advanced candle countdown and custom timer alert indicator for MetaTrader 4. Successful trading strategies all have one thing in common: they all rely on a candle closing before deciding what action to take. Action, reaction. Unfortunately, in MetaTrader 4, unless you have your eyes glued to the screen 24/5, it is so easy to miss amazing trading opportunities simply because you weren't looking as the cand

Algo Mtf is a multi timeframe indicator that can inform you about the situation of the indicators placed on other timeframes. This indicator has the possibility to offer a series of algorithmic calculations such as: RSI, Vortex, MACD, Momentum, Stocastic and ATR. The zones are colored in base of levels of this indicators on the chosen timeframe.
The confluence observation offers excellent operational tips and allows you to identify the trend tendency. The indicator is very efficient and an indi
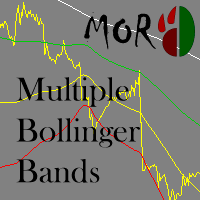
This indicator is based of the well-known Bollinger Bands indicator and provides for an easier operation with BB. It allows drawing up to 3 Bollinger channels and thus simplifies navigation in the list of indicators. Also it allows plotting Bollinger Bands of different timeframes, for example: draw BB on M5 timeframe with parameters: Period = 100, Timeframe = H1.
Inputs Value Mode - choosing different modes of working with the indicator StaticTimeFrame - the indicator draws Bollinger Bands fro

Triton Arrow - уникальный авторский индикатор, имеющий возможность отображать 3 типа сигналов. Которые появляются в направлении текущей тенденции, и против нее, а также при определенном превышении волатильности. Triton Arrow подходит для любого таймфрейма, валютной пары. Сигналы индикатора не пропадают ни при каких условиях. Рекомендуются таймфреймы M5, М15.
Параметры индикатора
Основные настройки ( Main Settings ): CounterTrendPeriod - период для расчета сигналов против тенденции, и расче
Scalper X indicator is very simple but powerful indicator. This is a very useful indicator, combined with a panel for fast trading will give you many satisfaction. This indicator can be used in any currency pairs and on any time frame, It fits at every speed of trading. Moreover, it's relatively easy to trade with Scalper X Indicator. This indicator produces two signals: BUY Signal: arrow aqua SELL Signal: arrow red
Indicator parameters Signal Gap - the gap value that produces the signal Color

AlfaZeta is an efficient indicator for binary options trading. It is designed for use in the MetaTrader 4 terminals. The recommended timeframe is М1 with the expiration of 5 candlesticks. It can also be used on M5, M15, M30, H1 with the expiration of 5 candlesticks. Indicator parameters feature an option for selecting the number of expiration candlesticks, so you can choose the required currency pair and timeframe, which currently shows the highest percent of profitable trades. The indicator is
Индикатор работает по двум направлениям: прибыли и просадки , а также в двух измерениях: % и $ . Если выставляется значение $ , то % автоматически подгоняется под $ . При изменении депозита индикатор сам уровни корректирует по отношению того, на что был настроен, а другой параметр корректируется к первому. Корректировка появляется при изменении депозита. Округление числа с плавающей точкой у линий (для красивой читаемости) в значении доллара - 2, в проценте - 1. Уровни автоматически выставля

This indicator is the logical continuation of the well-known equidistant channel indicator: https://www.mql5.com/en/market/product/8723 . The main purpose of the indicator is the visualization of price levels relative to the parallel channel using Fibo Bobokus levels in a separate window and the price history. This often allows forecasting the future price movement with a sufficiently high degree of probability. The Fibo levels calculation equation is as follows: FiboLevel = (50-(100*((Close[i]-

The Stochastic Oscillator is a momentum indicator that uses support and resistance levels. The term "stochastic" refers to the point of a current price in relation to its price range over a period of time. You can use a New Stochastic in the same way as classical one: Overbought and Oversold areas to make a Buy or Sell orders. This new indicator shows all variety of Fibonacci Levels (from 23.6 to 76.4) which can be used as Overbought and Oversold levels as well as points to close an open positio

Leo Trend is a signal indicator that shows the market entry points, as well as the trend direction and flat on the chart in the form of arrows and lines. Leo Trend will be useful both for beginners creating a trading strategy, and for professionals to integrate into ready-made trading systems. Leo Trend works without redrawing and without significant delays. The operation of the indicator is demonstrated in the video. In addition, you can test this indicator in the strategy tester free of charge

MA And Oscillation simple system that overcomes all the market confusion by simply looking at the moving average and stochastic oscillator and signalling when the moving average and stochastic or heading in same direction. The moving average is arguably the simplest but most effective tool when trading larger timeframes. We use this and the Oscillator to time our market entry. Features :
A method of simplifying a sometimes confusing market. Choose if you want to signal only when moving average

Volume Analysis Trader looks at volume using a fixed average of volume. This averaging helps spot when volume is rising or declining. Also I have added volume spikes which are when volume suddenly is above the average. These help spot market reversals. This will hep a trader look for the following in their trading: Rising volume during a rally shows trend is strong. Falling volume on a rally shows trend is weakening. As a rule of thumb on daily charts if current volume is higher than yesterday's
Plotter is an indicator that was created during the ICT mentorship to make charting quick, easy and fun for everybody. Assign a function to any hotkey in indicator settings or use the default keys to perform smart actions that usually takes a lot of time to perform. Click on any bar, press OHLCMBVPOKJH to plot objects, color them with keys 0-9 or modify them with keys ERAZ and much much more. Indicator settings are described below. CHART SETTINGS gmt_offset auto -23 - 23 daylightsavings= set dst

Trend reversal indicator. This indicator is based on expected value, as well as the Bollinger Bands and Ichimoku Kinko Hyo technical indicators. A trend reversal is determined by a complex mathematical formula, and its confirmation is based on the values of BB and the Ichimoku cloud. Signals are generated at the peak of a trend reversal, i.e. Trend Arrow Finder identifies the beginning of a new trend and the end of the previous trend. When a new candle opens, a signal for opening positions (buy
The Roll indicator is designed for finding local extremes and determining the current trend. The indicator is based on the volume and volatility values. Indicator calculation can be modified by activating the Modification parameter and choosing one of the available calculation options from CalcMode . To be able to determine current trend using this indicator, you should increase the value of the OsPeriod parameter and decrease the values of DynamicLevelPeriod and ShiftDynamicLevel . The indicato
Double Wave applies standard indicators, volatility, volume and a number of custom approaches allowing for efficient combination of all mentioned tools. The indicator allows you to define possible price reversal points both in the direction of a trend (preferable) and against it. Also the indicator assists in determining the trend and visualizes it by displaying a histogram. The indicator works with any symbol provided that you have sufficient history data for a timeframe the indicator is launch

Instructions Attach the indicator to any chart (advised H4) Use input tabs (defaults are 5 and false ) Press ok and continue trading.
Description The indicator uses a kind of pattern breakout strategy to help your trading strategy. I am using this strategy on H4 charts for many of pairs with a trailing stop and default indicator settings. Better results are shown on USDJPY, EURJPY, CADJPY, EURGBP, EURUSD, USDCAD, USDCHF, NZDUSD and GBPUSD.
Trailing stops should be different for each pair. The
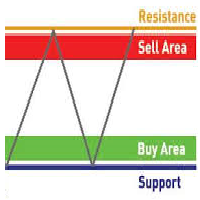
This is a Multiple Time Frames and Multiple Currency Pairs Indicator ( Score Board ) that shows Support and Resistance Levels from all TFs for 15 currency pairs by your choice. Support terminology refers to prices on a chart that tend to act as a floor by preventing the price of an asset from being pushed downward and can be a good buying opportunity because this is generally the area where market participants see good value and start to push prices higher again. Resistance terminology refers to

Think of the rarest pair you can think of. And I assure you that this indicator can compute it's strength. This Currency Meter will literally calculate any currency pairs, either it is the Major Pairs, Metals, CFD's, Commodities, Crypto Currency like Bitcoin/BTC or Ethereum/ETH and even stocks. Just name it and you will get it! There is no currency pair this Currency Meter can solve. No matter how rare or exotic is that currency, it will always be solved by this Currency meter which on a real-ti

Dieser Indikator implementiert einen einfachen linearen Glättungsprozess.
Einer der Nachteile der exponentiellen Glättung ist das schnelle Abklingen des Signals. Dies macht es unmöglich, langfristige Trends in der Preisspanne vollständig zu verfolgen. Mit der linearen Glättung können Sie die Signalfilterung genauer und feiner einstellen.
Der Indikator wird durch Auswahl von Parametern konfiguriert:
LP - Mit diesem Parameter können Sie die Glättungszeit auswählen. Je größer sein Wert, dest
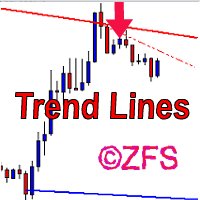
The indicator draws channels. The estimated movement of the price within the channel is shown with a dotted line. The lines of the channel are the support and resistance lines. This allows using them in both rebound and breakout trading. The inclination of the channel allows determining the direction of the current trend, the channel width and angle allow estimating the current volatility. The channels are based on fractal bars, determined using the author's original method, 4 dimensions from th
High Volatility is an utility indicator that has the task of locating volatile candles. The recognition and counting function of bullish and bearish candles make it an excellent ally to understand the market volatility. This point often defines possible reversals and moments of continuity. A rectangle is drawn on the chart to identify the candle with greater volatility in long and in short. This indicator is very effective for short, medium, and long-term trading. An alert will notify you when a

Ema Dashboard is an innovative dashboard that allows you to monitor Moving Average on multiples symbols and different timeframes. This dashboard allows you to analyze information on 28 pairs on an unique chart. Its functionality includes analysis of All Time Frames. This configuration allows you to identify the Long Term Trend with extreme ease. This panel allows you to take very important directional movements. A click on button opens a new chart (symbol and timeframe).
Graphic Object Symbol
Channel hybrid of the Moving Average, Bollinger Bands, RSI and CCI indicators. Unique filtering of signals without redrawing the indicator allows making various trades - both medium-term and short-term. The indicator operation principle lies in searching for the market reversal patterns. The trend reversal detection method uses the channel Triangular Moving Average, which plots equidistant non-redrawing channels with a Deviation period specified in the settings. Comparison of TMA and Bollinger B

Project Future is a professional arrow indicator with notification functions (alert, email, mobile). Advantages of the indicator Suitable for scalping and intraday trading. Simple and easy indicator configuration. Works on all timeframes. Does not redraw. It can be used in any financial markets: FOREX, CFD, binary options, stocks. It can be used as a stand-alone tool or in conjunction with other indicators. Sending signals to email and mobile devices.
Recommended symbols USDCAD, USDJPY, GBPUSD

Unity Basket WPR (William's Percent Range) indicator combines serveral pairs' WPR to a combined basket of your defined base currency. This gives you clear trading signals along with potential TP and SL. Use the indicator along with other indicators, like ATR, to avoid flat market situations and an indicator showing you the overall trend like an MA (50). Trade with the trend.
Settings Basket pairs - comma separated list of pairs (default: EURUSD,EURJPY,EURCHF,EURGBP,EURNZD,EURCAD,EURAUD) Period

The main purpose of the QQ-Deep Binary indicator is to determine the direction of the sail marked for Binary Options. It works for any currency pair, presenting better result in volatile instruments. The indicator is designed to simplify market analysis, and is based on price pattern detection strategies combined with multi-currency econometric velocity. The development team is constantly improving the functionality of the indicator.
Indicator Advantages No repaint. Works on all currencies. Mu

The trend scalper candles are used to identify short-term trends based on the readings of the MACD, RSI and ATR indicators. All indicator calculations are visualized by candle colors which are overlapped on the chart. The indicator uses gray , green and red colors to paint individual candles, which gives you a lot of useful and easy to read information.
Gray candles Gray candles indicate a range bound period and the information can be used to trade breakouts. Simply mark the high and low of th

TCD (Trend Convergence Divergence) is based on the standard MACD indicator with modified calculations. It displays the trend strength, its impulses and rollbacks. TCD consists of two histograms, the first one shows the main trend, while the second done displays the impulses and rollbacks. The advantages of the indicator include: trading along the trend, entering the market when impulses occur, trading based on divergence of the main trend and divergence of the rollbacks.
Input parameters Show_
The Currency Strength Index Oscillator multicurrency trend oscillator shows the interaction of the indices of the current symbol's currencies calculated on the basis of the cross-rates of Majors.
Features Calculations are based on complete bars, therefore, it does not redraw. It works on any symbols that include the Majors (AUDJPY, AUDUSD, CHFJPY, EURAUD, EURCAD, EURCHF, EURGBP, EURJPY, EURUSD, GBPAUD, GBPCAD, GBPJPY, GBPCHF, GBPUSD, NZDJPY, NZDUSD, NZDCAD, USDCAD, USDCHF, USDJPY). It works on

The indicator shows and highlights the chart candles, which are formed as a result of large players entering the market in large volumes. Such candles can also be formed after achieving a certainty on the market, when most of the participants hold positions in the same direction. The movement is likely to continue in that direction after such candles. The indicator highlights the significant candles from the existing ones on the chart; The indicator allows identifying the trends based on candles
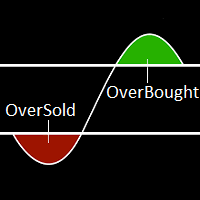
The term Overbought describes a period of time where there has been a significant and consistent upward move in price over a period of time without much pullback. The term Oversold describes a period of time where there has been a significant and consistent downward move in price over a period of time without much pullback. Because price cannot move in one direction forever, price will turn around at some point. This indicator will show a Magenta arrow in case of Overbought condition and Aqua ar
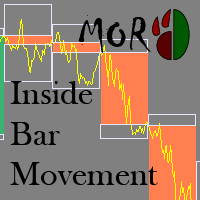
This indicator allows analyzing the movement of prices inside a bar. The indicator draws the contours of the bars of higher timeframes on the current chart.
Inputs Value TimeFrame - the timeframe to display bars NumberOfDays - the number of days the indicator calculates Bull_Body - the body color of the bullish bar Bear_Body - the body color of the bearish bar ShadowUp - the color of the upper shadow of the bar ShadowLow - the color of the lower shadow of the bar Selectable - enable/disable th
The indicator finds and visualizes price gaps, which often can be used as support and resistance levels. It can display levels from different timeframes on one chart.
Inputs Value Label - show/hide the timeframe of constructed levels TimeFrame - select timeframe to draw levels from DrawRangeDay - the length of the level in days DrawRangeHour - the length of the level in hours GapSizeForDrawing - a level will be drawn if gap is equal to or larger than this level in points CountDays - the number

The indicator identifies the trend change points. Does not redraw. Calculation is done on an active candle. Lines crossing is used as a trend change point. If the price is above the two lines, there is an uptrend. If the price is below the two lines, there is a downtrend. The indicator allows you to accurately enter the market during a trend change. It can also be used in custom strategies on a detected trend. 3 modes of notification on trend changes. Sound, arrows, sending push-notifications. I

This multicurrency strategy simultaneously determines the strength of the trends, entry points and the take profit levels for each trade. The indicator can determine entry points on any trading period from M1 to D1. For the convenience of users, the indicator renders the entry point (in the form of an arrow), recommended take profit levels (TP1, TP2, TP3) and the recommended stop loss level (SL1, SL2). The options for using the strategy are described below. Full description of the indicator Cosm

Features: Generates BUY / SELL Signals for easy to use: You do not need to read or understand market trend lines on indicators. Quantina Bitcoin Indicator shows a little Red Arrow for SELL and a little Green Arrow for the BUY entry points above- and under - the actual bars. (Green = Bullish Trend , Red = Bearish Trend). Measured Signal Strength also has written on the chart for advanced traders. Working on every known currency pairs: It's working on major-, minor-, and cross - pairs too. Also, Q

NIZMA is a ready-made trading system, that is the most efficient on the EURUSD, AUDUSD and GBPUSD currency pairs. The best timeframes are M5 and higher. The system shows the market entry points in the form of arrows, and also displays the information on the strength and direction of the trend. The signals are easy to interpret. It is suitable for both novice and professional traders. With the properly selected settings, it gives the minimum number of false signals. In tests, this number did not

The Magneto Precision Trend indicator is based on candlestick analysis. It determines the trend change on the previous candle, signal is not redrawn.
Indicator setup and use Increasing the Period parameter decreases the indicator sensitivity, resulting in less frequent changes in color but filtering the market noise. However, the trend change signals will arrive visually with a delay. And, conversely, decreasing the value of Period provides more accurate but more frequently changing signals. T

The Magneto Reverse Signal indicator is based on the candlestick analysis. It identifies the reversal points.
Indicator setup and use Adjustment of the indicator is reduced to selection of parameters Period (left window of the panel) and Gate (right window of the panel). It is more convenient to adjust the settings using the control panel directly on the chart. In this case, you can immediately see which optimal parameters can be used in the current market. This method is shown in the video in

RSI Currency Strength Meter uses RSI (Relative Strength Index) to monitor how strong a currency is, or in other words, if it's being bought or sold by the majority compared to the other currencies. It displays the strength-lines of the currencies of the pair (base and counter currency of the chart) with changeable solid lines. Also, you can add up to five additional currencies to the "comparison pool". If you want to look and compare, for example, EUR, USD and JPY, it will only look at the EURUS

This indicator helps to define the dominant trend. The Blue line and Red line changes at incrementations of the trends.
Parameters ki: factor of the delay. per: Displays the indicator period. Trend: Displays the Trend movements. Trend true.(false) X: moves the trend left and right. Y: moves the trend up and down. How to understand the status: If the arrow is blue, trend is up. If the arrow is red, trend is down.

This indicator shows the crossing between two moving averages, a slower and faster moving average. Signal show alert pop-up, when MA1 crosses above the MA2. Signal show alert pop-up, when MA1 crosses below the MA2.
Inputs Value Fast MA Setup Period = 5 - period of Faster Moving Average (value 5). Mode = SMA - type of Moving Average (SMA, EMA, SMMA, LWMA). Price = Close - type of price (Close, Open, Low, High, Median, Typical, Weighted). Slow MA Setup Period = 10 - period of Slower MA (value 10

EW Oscillator PRO is an indicator for MetaTrader 4 based on mathematical calculations on the price chart. This is one of the most common and useful indicators for finding the trend reversal points. EW Oscillator PRO is equipped with multiple types of notification (push notifications, emails, alerts), which allows opening trades in time. A panel for displaying the information on the indicator signals from different timeframes is located in the top left corner (see screenshot #2).
Distinctive fe

This indicator shows the crossing between three moving averages (slower, middle and faster ones). When fast MA crosses up middle MA and middle MA crosses up slow MA, the bullish alert is issued. When fast MA crosses down middle MA and middle MA crosses down slow MA, the bearish alert is issued. Signals to close buy positions are generated if fast MA crosses middle MA downwards, signals to close sell positions are generated if fast MA crosses middle MA upwards.
Inputs Fast MA Setup MAPeriod1 =

DYJ-Aktien-Controller ist ein monetäres Transaktionssystem Es kann für jedes Währungspaar von M1 bis MN einen zufälligen Wert anzeigen. Wenn der Wert für Stoch in einem Zeitraum den Supermarkt und den Supermarkt erreicht, werden farbige Hinweise angezeigt. Sie können den richtigen Deal anhand dieser Informationen machen.
Erstellen Sie eine Vorlage für den Bestandsindikator DYJ Inventory Controller, und speichern Sie diese. Wenn Sie mit der Maus auf einen Supermarkt oder einen Supermarkt klick
Dieser Indikator ermittelt Keile , bei denen es sich um Fortsetzungsmuster handelt, die durch konvergierende Trendlinien im Zusammenhang mit einer Preiskonsolidierungsperiode gekennzeichnet sind. Es signalisiert Trades mit einem Donchian-Breakout neben dem Formations-Breakout. [ Installationsanleitung | Update-Anleitung | Fehlerbehebung | FAQ | Alle Produkte ] Einfach zu verwenden Anpassbare Farben und Größen Es implementiert Breakout-Signale Es implementiert Warnungen aller Art
Optimale Nutz

This is a multi timeframe indicator to show the direction of the trend in multiple timeframes. The calculations are based on some original indicators but with special settings that is working for years and in combination with some newer indicator formulas. The indicator has multiple arrows based on various timeframe signals so that user can clearly see which signal is for which timeframe. Also draws horizontal lines with different thickness settings and colors from various latest signals so that
For those who studies Bill Williams' books "New Trading Dimensions" and "Trading Chaos (Second Edition)" and tries trading using these methods, it becomes evident that the standard set of indicators is not sufficient for full-fledged work. The Trading Chaos Map indicator draws the "market map", thus allowing you to the charts the same way as the author of the trilogy. Parameters provide options for enabling and disabling each signal. You can use any of the methods, or use them in conjunction. Yo

The Magneto Volume Trigger indicator is designed for determining the volume confirmed by the candlestick pattern and predicting the trend tendency.
Indicator setup and use The calculation of values is affected by two parameters - Period and Gate . The lower the value of Gate , the higher the sensitivity of the indicator. Period allows making a sample of data for the specified number of candles. The lower the value of Period , the more the indicator is adapted to the current market conditions.
Der MetaTrader Market ist eine einzigartige Plattform für den Verkauf von Robotern und technischen Indikatoren.
Das Merkblatt für Nutzer der MQL5.community informiert Sie über weitere Möglichkeiten: nur bei uns können Trader Handelssignale kopieren, Programme bei Freiberuflern bestellen, Zahlungen über das Handelssystem automatisch tätigen sowie das MQL5 Cloud Network nutzen.
Sie verpassen Handelsmöglichkeiten:
- Freie Handelsapplikationen
- Über 8.000 Signale zum Kopieren
- Wirtschaftsnachrichten für die Lage an den Finanzmärkte
Registrierung
Einloggen
Wenn Sie kein Benutzerkonto haben, registrieren Sie sich
Erlauben Sie die Verwendung von Cookies, um sich auf der Website MQL5.com anzumelden.
Bitte aktivieren Sie die notwendige Einstellung in Ihrem Browser, da Sie sich sonst nicht einloggen können.