Technische Indikatoren für den MetaTrader 4 - 32

MQLTA Candle Timer ist ein Indikator, der Ihnen die Details über ein Symbol/Paar zeigt und Sie vor dem Schließen einer Kerze warnt. Er wird nicht nur im Swing-Trading verwendet, sondern kann Ihnen helfen, Ihre Strategien zu kennen und vor dem Schließen einer Kerze bereit zu sein.
Wie funktioniert es? Fügen Sie den Indikator einfach zum Chart hinzu und legen Sie die Benachrichtigungsoptionen fest. Sie können eine minimalistische Schnittstelle oder eine vollständige Schnittstelle laden. Der Alarm
FREE

Dieser Indikator hilft Ihnen, die Symbole im Market Watch-Fenster zu scannen und einen Trend nach dem RSI herauszufiltern.
Der Relative-Stärke-Index (RSI) ist ein technischer Indikator, der bei der Analyse der Finanzmärkte verwendet wird. Er dient dazu, die aktuelle und historische Stärke oder Schwäche einer Aktie oder eines Marktes auf der Grundlage der Schlusskurse der letzten Handelsperiode darzustellen. Der Indikator sollte nicht mit der relativen Stärke verwechselt werden. Der RSI wird als
FREE

Pipsurfer Tide Meter ist ein Momentum-Indikator, der den Händlern helfen soll, zu erkennen, in welche Richtung sich die "Flut" dreht. Dieser Indikator ist ein großartiger unterstützender Indikator für den Pipsurfer Hauptindikator, der in MQL5 unter "Pipsurfer Indikator" aufgeführt ist.
Die Strategie hinter dem Tide Meter ist, dass Sie die blauen und roten Balken sehen. Blaue Balken stehen für bullisches Momentum Rote Balken stehen für ein bärisches Momentum Verwenden Sie die Preis-Aktion, um ei
FREE

Dies ist ein sehr einfacher Indikator für mehrere gleitende Durchschnitte.
Er kann 12 gleitende Durchschnitte anzeigen. Die Zeitachse der gleitenden Durchschnitte kann im Eingabefeld des Indikators geändert werden. Der Prozess ist schneller als die 12 gleitenden Durchschnitte, die in MT4 enthalten sind.
Wir haben auch einen Puffer eingerichtet, damit Sie von einem Expert Advisor darauf zugreifen können. *Für fortgeschrittene Benutzer.
Wenn Sie Fragen oder Wünsche haben, senden Sie mir bitte
FREE
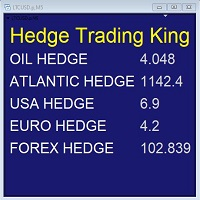
Hedge Trading Monitor ist mein Indikator, der auf einen Blick die Differenz oder das Verhältnis zwischen zwei Vermögenswerten anzeigt, die für den Hedge-Handel nützlich sind.
Wie man ihn benutzt + den Indikator herunterladen + Wenden Sie den Indikator auf einen offenen Chart an + Sie können die Vermögenswerte ändern, indem Sie in den Einstellungen handeln.
Vertrieb + er wird nur auf MQL5.vom verteilt + kostenlose Lizenz (FREE)
FREE

Der Zweck dieser neuen Version des MT4-Standardindikators, der in Ihrer Plattform enthalten ist, besteht darin, in einem Unterfenster mehrere Zeitrahmen desselben Indikators anzuzeigen. Siehe das Beispiel im Bild unten. Aber die Anzeige ist nicht wie bei einem einfachen MTF-Indikator. Dies ist die tatsächliche Anzeige des Indikators in seinem Zeitrahmen. Hier sehen Sie die verfügbaren Optionen des FFx-Indikators: Wählen Sie die anzuzeigenden Zeitrahmen (M1 bis Monthly) Definieren Sie die Breite
FREE

Gleitender Durchschnitt Konvergenz Divergenz (MACD) kombiniert mit Traders Dynamic Index (TDI) Eingabeparameter: Signalmodus: true, wenn Sie es in STAT (Signal Tester und Trader) einbinden wollen arrow shift: Abstand zwischen TDI-Linie und Pfeil im Chart mittleres Band: Verwendung des mittleren Bandes (mittleres Bolinger Band) als Signalfilter Preislinie: 50 Preislinien-Signalfilter verwenden RSI Zeitraum RSI-Preis-Methode Volatilitätsperiode gleitender Durchschnitt RSI-Periode gleitender Durchs
FREE

+ 2 Bonusstrategien! Warnungen! I recommend watching my advisor - Night Zen EA Der Indikator kombiniert die beliebtesten Strategien für gleitende Durchschnitte: Einfacher gleitender Durchschnitt Crossover. Crossover des gleitenden Durchschnitts in Bezug auf die Position des langsameren gleitenden Durchschnitts. 2 Bonus-Strategien: Die Überkreuzung des schnellen gleitenden Durchschnitts mit der Berechnung der Eröffnungskurse des langsamen gleitenden Durchschnitts mit der Berechnung der Schlussk
FREE

Verpassen Sie nie wieder einen Trendwechsel! Dieser Indikator verwendet verschiedene Berechnungsmethoden, die auf der Preisbewegung basieren, um Änderungen der Trendrichtung zu erkennen. Er kann auf hohen Zeitrahmen (von H1 bis D1) verwendet werden und ist am besten für den H4- und Daily-Zeitrahmen geeignet. Dieser Indikator ist mit allen Brokersymbolen kompatibel (Forex, Indizes, CFD, Rohstoffe, Kryptowährungen...). Es ist auch möglich, den Indikator auf mehreren Charts zu öffnen, um mehrere S
FREE
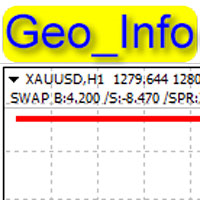
Geo_Info ist einer der informativsten Indikatoren, der sowohl die Nettostände als auch die Basisdaten eines Symbols und die Handelspositionen platzsparend anzeigt. Geo_Info zeigt in der oberen linken Ecke des Charts Kurzdaten zu den grundlegenden Symbolparametern an: Swap für Kauforder, Swap für Verkaufsorder, aktueller Spread, Margin, Tick Size, Stop Level, Order Freeze Level . Die Daten werden für ein Lot in Punkten angezeigt. Die Daten werden wie folgt angezeigt: SWAP B:4.200 /S:-8.470 /SPR:3
FREE

Der Fibonacci-Indikator zeigt automatisch die Fibonacci-Retracement-Levels an, die wichtige Unterstützungs- und Widerstandsmarken darstellen. Der Bereich für die Berechnung des Indikators kann aus dem Vortag, der Woche, dem Monat, dem Jahr oder einer benutzerdefinierten Sitzung stammen.
Niveaus 100 % (Hoch) der Spanne der vorangegangenen Sitzung. 0 % (Tiefstwert) der Spanne der vorangegangenen Sitzung. 76,4 % der Spanne der vorangegangenen Sitzung. 61,8 % der Spanne der vorangegangenen Sitzung
FREE
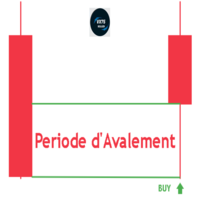
Engulfing Period V75Killed für MT4 – Beherrsche Marktumkehrungen mit Präzision! (Dieser Indikator ist PRIVAT und ausschließlich für Trader gedacht, die seinen einzigartigen Wert verstehen.) Der Engulfing Period V75Killed ist ein leistungsstarkes Tool für MetaTrader 4, das automatisch bullische und bärische Engulfing-Muster über mehrere Zeitrahmen hinweg erkennt. Es hebt die wichtigsten Engulfing-Zonen direkt im Chart hervor und hilft dir, hochwahrscheinliche Handelsmöglichkeiten schnell zu ident
FREE

Unverzichtbar für Händler: Tools und Indikatoren Waves automatisch berechnen Indikatoren, Kanal Trend Handel Perfekte Trend-Welle automatische Berechnung Kanal Berechnung , MT4 Perfekte Trend-Welle automatische Berechnung Kanalberechnung , MT5 Lokales Trading Kopieren Einfaches und schnelles Kopieren, MT4 Einfaches und schnelles Kopieren, MT5 Lokales Trading-Kopieren für DEMO Einfaches und schnelles Kopieren , MT4 DEMO Einfaches und schnelles Kopieren, MT5 DEMO Fibo: von KTrade 1. Automatisches
FREE

Harami ist ein Zwei-Kerzen-Muster, bei dem die jüngste Kerze innerhalb des Hochs und Tiefs der vorherigen Kerze gebildet wird. Es steht für die Unentschlossenheit des Marktes und wird für die Breakout Price Action Trading Strategie verwendet. Dieses Indi feuert alle Signale an ein Dashboard auf dem Chart, einschließlich Pop_up-Alarm, Push-Benachrichtigung auf dem Telefon und E-Mail. Harami hat zwei Arten, bullish und bearish Muster. Gehen Sie bei einem bullischen Harami long und bei einem bärisc
FREE

Der Investment Castle Indicator hat die folgenden Eigenschaften: 1. gibt die Richtung des Trends in verschiedenen Zeitrahmen an . 2. zeigt die Trefferquote und die Gewinnquote auf dem Chart an. 3. Dieser Indikator malt das Diagramm nicht neu. 4. Dieser Indikator ist in den Support & Resistance basierten Investment Castle EA eingebaut, der mit dem Psychological Key Levels "Support & Resistance" Indikator arbeitet.
FREE
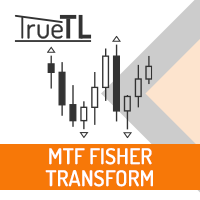
Hochgradig konfigurierbarer Fisher-Transform-Indikator.
Merkmale: Hochgradig anpassbare Alarmfunktionen (bei Levels, Kreuzen, Richtungsänderungen per E-Mail, Push, Sound, Popup) Multi-Timeframe-Fähigkeit Farbanpassung (bei Levels, Kreuzen, Richtungsänderungen) Optionen für lineare Interpolation und Histogramm-Modus Funktioniert im Strategie-Tester im Multi-Timeframe-Modus (auch am Wochenende ohne Ticks) Einstellbare Levels Parameter:
Fisher Transform Timeframe: Sie können die unteren/höheren Ti
FREE

Der traditionelle RSI ist einer der beliebtesten und bekanntesten Indikatoren, den jeder Trader verwendet. In dieser Kombination verwenden wir zwei RSI-Perioden mit geglättetem Faktor, um die RSI-Linien für bessere Ergebnisse zu glätten. Außerdem befindet sich am unteren Rand des Indikators die Trend-Filter-Anzeige in verschiedenen Farben, damit Trader die Trends leichter erkennen können Grau : Seitwärtsmarkt Hellblau : Schwacher UP-Trend Blau : Starker Aufwärtstrend Hell-Rot : Schwacher DOWN-Tr
FREE
Dieses Dashboard kann kostenlos heruntergeladen werden, setzt aber voraus, dass Sie den Flag Trend Pro MT4-Indikator besitzen . Laden Sie den Indikator herunter: Flag Trend Pro
Das Dashboard zeigt Ihnen auf einem einzigen Chart alle Zeitrahmen (M1 bis Monthly) mit ihrem eigenen Status für den Indikator :Gold Pro MT4
alle Zeitrahmen und alle Symbole: intelligenter Algorithmus erkennt den Trend, filtert das Marktrauschen heraus und gibt Einstiegssignale!!!
Wie man den Status versteht: Symbol
FREE

Bigger chart labels would allow the user to be entirely aware of which chart he/she is on. Each chart window is unique, containing different patterns and economic motives so acknowledging the chart window would be absolutely essential! There are well known Economic Time Zones included in clear view, by choice! Simple does it! Use your computing mouse scroller, clicking with the right finger on the label, in order to customize the label properties. From there, choose your preferred color, fo
FREE

Hypothetische Trendlinienanzeige
Abstand von der Trendlinie
Kann in allen Symbolen verwendet werden
Kann in allen Zeitrahmen verwendet werden
Ein interessanter Indikator für die Vorhersage kleiner Wellen
Je größer der Abstand von der Trendlinie ist, desto wahrscheinlicher ist die Rückkehr zur Trendlinie
Einstellungen:
Die ersten drei(osic 1,2,3):
sind die gleichen wie die Einstellungen des Zickzack-Indikators
Je größer diese Zahlen sind, desto größer sind die Trendlinien und desto länger ist d
FREE

Der MP-Preisänderungsindikator ist ein Werkzeug zur Berechnung der prozentualen Preisbewegung. Der Wert dieses Indikators kann so eingestellt werden, dass er die prozentuale Preisänderung innerhalb bestimmter Zeitspannen anzeigt. Dieser Indikator ist ein leistungsfähiges Instrument, wenn er zusammen mit anderen Indikatoren wie ATR und ADR verwendet wird, um Preisschwankungen und Toleranz in verschiedenen Strategien zu verstehen. ___________________________________________________________________
FREE

Es gibt einen sehr einfachen und überraschend effektiven Indikator namens Pi Cycle, der eine erste Warnung ausspricht. Es lohnt sich, einen Blick darauf zu werfen, um den riesigen Elefanten im Wohnzimmer nicht zu übersehen!))
Was ist Pi Cycle?
Pi Cycle ist ein sehr einfacher Indikator, der von dem Analysten Philip Swift entwickelt wurde. Er berücksichtigt zwei (DMA verzerrte) gleitende Durchschnitte: 350-Tage-Durchschnitt x 2 111-Tage-Durchschnitt Beide können als langfristige Indikatoren bet
FREE

Auf der Grundlage des Trendfolgeprinzips des CCI wurde er zu einem Indikator verbessert, der die Trendumkehr und die Entwicklungsrichtung erkennen kann, d.h. er kann die obere und untere Abschwächung des oszillierenden Trends auf dem Trendmarkt identifizieren. Merkmal Die rote und die grüne Säule stellen den Aufwärts- oder Abwärtstrend im aktuellen Zyklus dar. Die blaue Linie zeigt die Position und Abschwächung des aktuellen Preistrends im aktuellen Zyklus. Der obere und untere Rand des roten Li
FREE

Der SFT Fibo Smart Pivot-Indikator ist ein leistungsstarkes Handelsinstrument, das auf dem Goldenen Schnitt von Fibonacci basiert und dazu dient, wichtige Unterstützungs- und Widerstandsniveaus auf dem Devisenmarkt zu identifizieren. Dieser Indikator ist in der Lage, wichtige Kursniveaus zu ermitteln, die als Einstiegs- und Ausstiegspunkte für den Handel dienen können. Er ermöglicht es Händlern, den Markt effektiver zu analysieren und fundierte Entscheidungen zu treffen. Der Indikator verwendet
FREE

Dieser Indikator prognostiziert Preisumkehrungen und analysiert den Aufwärts- und Abwärtsdruck auf dem Markt. Der Kaufdruck ist die Summe aller Akkumulationsbalken über eine bestimmte Anzahl von Tagen, multipliziert mit dem Volumen. Der Verkaufsdruck ist die Summe aller Verteilungen über die gleiche Anzahl von Barren, multipliziert mit dem Volumen. [ Installationsanleitung | Update-Anleitung | Fehlerbehebung | FAQ | Alle Produkte ] Das Indikatorverhältnis gibt Ihnen ein Maß für den Kaufdruck al
FREE
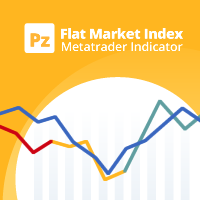
Dieser Indikator berechnet, um wie viel sich ein Symbol relativ bewegt hat, um Trend- oder flache Märkte zu finden. Es wird angezeigt, welcher Prozentsatz der neuesten Preisspanne direktional ist. [ Installationsanleitung | Update-Anleitung | Fehlerbehebung | FAQ | Alle Produkte ] Ein Wert von Null bedeutet, dass der Markt absolut flach ist Ein Wert von 100 bedeutet, dass der Markt völlig im Trend liegt Die blaue Linie bedeutet, dass die Preisspanne gesund ist Die rote Linie bedeutet, dass die
FREE

Dieser einfache Indikator nutzt die Informationen des Ichimoku Kinko Hyo, um starke und schwache Währungen zu ermitteln, die sich in idealen Trending-Situationen miteinander verbinden. Außerdem generiert er Kauf- oder Verkaufssignale auf der Grundlage der Standardabweichung der Renditen in Verbindung mit der Währungsstärke. Eine Währung wird als stark oder schwach eingestuft, je nachdem, wo sich der Kurs im Verhältnis zu zwei Faktoren befindet: Wenn der Kurs über dem Tages-Kumo und über dem 26-T
FREE
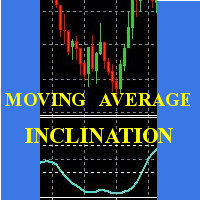
Scalp mit dem Verhalten eines kurzen gleitenden Durchschnitts, gibt der Indikator die Steigung und identifiziert die "hyper" Momente.
Operative Ratschläge:
M1-Chart verwenden. Periode 20 : Kaufen Sie nach zwei steigenden Tiefs; verkaufen Sie nach zwei maximalen Abwärtsbewegungen; vermeiden Sie gegenläufige Eröffnungen; wenn die Linie flach wird, setzen Sie einen Stopp beim Eröffnungskurs. Vermeiden Sie Aktionen in Zeitfenstern mit geringer Volatilität. Wenn die Kurve, die das Minimum / Maximu
FREE
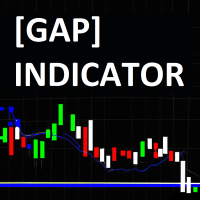
Der JagzFX Gap-Indikator ist Ihr aufmerksamer Begleiter, der den Markt mit Präzision scannt und Sie auf Gaps aufmerksam macht, sobald sich eine neue Kerze bildet. Legen Sie die gewünschte Gap-Größe fest, und der Indikator wird sowohl gefüllte als auch nicht gefüllte Gaps für jedes Symbol und jeden Zeitrahmen anzeigen. Durch die Analyse des Vorhandenseins von nicht gefüllten Gaps erhalten Sie wertvolle Einblicke in das Marktverhalten und können so fundiertere Handelsentscheidungen treffen. Kombin
FREE

Ein leistungsstarkes Trendanalyse-Tool für Händler aller Stufen Super Trend Analyzer ist ein technisches Analysetool, das den Relative Strength Index (RSI) und den gleitenden Durchschnitt (MA) verwendet, um Trends auf dem Markt zu erkennen. Es ist ein vielseitiges Tool, das von Händlern aller Erfahrungsstufen verwendet werden kann.
Wie funktioniert es? Ein Aufwärtstrend beginnt, wenn sich die Haupttrendlinie und die Hilfstrendlinie von unten kreuzen und der untere Nebenoszillator im Aufwärtstre
FREE

Der empfohlene Zeitrahmen ist H1!
Der Indikator hat zwei Arten von Signalen.
Es handelt sich um ein Signal zur Eröffnung einer Position, wenn ein Pfeil erscheint. Der Preis verlässt den Kanal Im ersten Fall bildet der Indikator Pfeile, die auf dem konstruierten Kanal und den Bollinger Bändern der letzten Jahre basieren.
In einem anderen Fall kann der Händler handeln, wenn der Kurs den Kanal gerade verlassen hat. Wenn der Preis höher ist als der Kanal - wir verkaufen. Wenn der Preis niedriger
FREE

Der Indikator CYCLE WAVE OSCILLATOR ist ein Indikator, der auf zyklischen Kursschwankungen basiert. Dieser Indikator kann Ihnen helfen, überkaufte und überverkaufte Niveaus zu bestimmen und Preistrends innerhalb des Zyklus vorherzusagen. MT5-Version hier! Sie können diesen Indikator mit unseren untenstehenden Indikatoren kombinieren, um Ihre Handelsentscheidungen zu präzisieren: Angebot-Nachfrage-Band MT4 Basic
Merkmal: - Drei Trendtypen: + Null + Grundlegend + Erweitert
FREE

Dieser Indikator vergleicht die Kursveränderungen während des angegebenen Zeitraums für das aktuelle Symbol und ein anderes Referenzsymbol. Er ermöglicht es, die ähnlichen Bewegungen von stark korrelierten Symbolen wie XAUUSD und XAGUSD zu analysieren und ihre gelegentlichen Konvergenzen und Divergenzen für Handelsmöglichkeiten zu finden. Der Indikator zeigt die folgenden Puffer an: hellgrüne dicke Linie - Preisänderungen des aktuellen Symbols für TimeGap-Balken ; hellblaue dünne Linie - Preisve
FREE

Dieser Indikator ist eine eigenständige Version von MP Pivot Levels (All in one), die Demark's Pivots enthält.
Berechnungen: PP = X / 4 R1 = X / 2 - LOWprev S1 = X / 2 - HIGHprev Verwendet: Wenn der Preis des Währungspaares die Richtung der Bewegung ändern kann. Mögliche Einschränkungen von Unterstützung und Widerstand, die Plateaus für die Preise des Währungspaares schaffen. Identifizierung von Tendenzen durch Vergleich der aktuellen Preise mit den Pivot-Punkten des aktuellen Tages und den Pivo
FREE

Der Indikator misst die Stärke der einzelnen Währungen in Ihrer Liste.
Die Grundidee: Er durchläuft einfach alle Kombinationen von Paaren und addiert die Differenz zwischen Eröffnungs- und Schlusskurs in Prozent. Parameter: Liste der Währungen - welche Währungen werden berechnet (maximal 8) Berechnungsart - aus welchen Daten wird die Stärke berechnet Eingabe der Berechnungsdaten - wird als Eingabe für die Berechnungsart verwendet Symbolsuffix - wird im Falle eines Suffixes auf den Symbolen verw
FREE

Dieser Indikator überwacht die lebenswichtigen Konstanten Ihres Handelskontos, um es gesund und frei von übermäßigen Risiken zu halten. Er überwacht alle Trades, das absolute Risiko, den Kontostand und den derzeit verwendeten Hebel, wobei verschiedene Farbcodes zur Interpretation verwendet werden. [ Installationsanleitung | Updateanleitung | Fehlerbehebung | FAQ | Alle Produkte ] Erstaunlich einfach zu verstehen Der Indikator ist sauber und einfach Er berechnet das Risiko nach Paaren und Währung
FREE
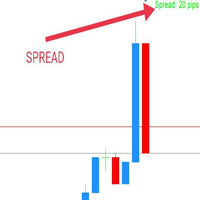
WaSpread MT4 Indicator zeigt den aktuellen Spread in Pips mit Farbe an.
* Stellen Sie den Spread Threshold und die Farbe ein, um zu erkennen, wann der aktuelle Spread unter oder über dem Spread Threshold liegt.
* Legen Sie die X- und Y-Achse fest und wählen Sie die Ecke und den Anker, um das Spread-Label auf dem Chart zu positionieren.
* Schreiben Sie die Schriftart und die Schriftgröße für mehr Komfort.
* Aktivieren Sie eine Warnung, wenn der aktuelle Spread über dem Spread-Schwellenwert l
FREE

RJT SALAMANDER, die Anzeige wie in einem Videospiel
VERSION 2
Steuern Sie Ihr PRICE-Raumschiff in die Höhle und vermeiden Sie die Kollision mit den Stalaktiten (grün) und Stalagmiten (rot), indem Sie diesen Hindernissen ausweichen, um zu gewinnen.
Wenn sich diese Objekte bilden (oder verschwinden), müssen Sie die Entscheidung treffen, wie Sie Ihr Schiff bewegen (wie in einem Videospiel)
Je nach Markt und Größe der Kerzen/Balken können Sie die Berechnung der Stalaktiten und Stalagmiten (basie
FREE
RangePower Index ist ein MT4-Indikator, der die Stärke von Währungen, Indizes, Gold und Öl auf der Grundlage ihrer täglichen Schwankungsbreite genau misst. So wissen Sie sofort, welche Vermögenswerte eine echte Dynamik haben und welche im Gegenteil an Stärke verlieren.
Tägliche Analyse der Kursspanne (Hoch-Tief) für Währungen, Indizes, Gold und Öl Schnelle Visualisierung der stärksten und schwächsten Werte Mit RangePower Index verschaffen Sie sich einen klaren Wettbewerbsvorteil - handeln
FREE

Der Indikator basiert auf der Toby-Strategie >> Die Mutterkerze, die eine größere Spanne hat als die vorherigen sechs Kerzen.
Eine vertikale Linie zeigt die letzte Toby-Kerze mit den Zielen, die oben und unten angezeigt werden. Bei der Strategie geht es darum, dass der Schlusskurs außerhalb der Spanne der Toby-Kerze liegt, um die 3 Ziele zu erreichen, wobei das wahrscheinlichste Ziel das Ziel 1 ist, also stellen Sie sicher, dass Sie Ihre Gewinne zurückhalten und Ihren Stop-Loss verwalten.
FREE

Der Super Channels Indikator ist ein Kanalindikator, der durch die Berechnung von Unterstützungs- und Widerstandsniveaus erstellt wird. Er berechnet den Durchschnitt der Unterstützungs- und Widerstandsniveaus. Nachdem er die Anzahl der Kerzen bestimmt hat, nimmt er die Niveaus der Anzahl der Kerzen und erstellt einen autonomen Kanal entsprechend dieser Niveaus. Wenn Sie die Anzahl der Kerzen berechnen möchten, müssen Sie die Anzahl in den Parameterbereich eingeben. Außerdem gibt es zwei Arten vo
FREE

Der Indikator errechnet die wahrscheinlichsten Niveaus der Preisrückkehr. Kann zur Festlegung des Take-Profit-Niveaus verwendet werden. Der empfohlene Zeitrahmen ist ein beliebiger, mit entsprechender Einstellung. Einstellungen.
Zeitraum - Anzahl der Kerzen für die Analyse. Genauigkeit - Genauigkeit der Pegelberechnung in Punkten. Breite - Größe der Kursmarkierung. In der Regel braucht man nicht viel Zeit, um die Niveaus auszuarbeiten, die Niveaus sind ziemlich genau, wenn sie berührt werden, u
FREE

Traditionelle Moving Average (SMA, EMA, SMMA, LWMA...) ist sehr nützlich für die Identifizierung von Trends, aber was werden Sie tun, wenn Sie auf niedrigeren Zeitrahmen zu handeln, und Sie müssen die größeren Trend von einem höheren Zeitrahmen zu identifizieren; Natürlich können Sie es, indem Sie Ihren Chart in getrennte Fenster, aber Ihre Analysen werden nicht klar und intuitiv ... Aus diesem Grund haben wir den Multi Timeframe Moving Average Indikator entwickelt.
Mit dem Multi Timeframe Mov
FREE
Future WPR - oder Backward WPR - ist eine spezielle Modifikation des WPR: Er verwendet die Standardformel, wendet sie aber in umgekehrter Richtung an. Der Indikator berechnet den WPR von rechts nach links, d.h. von der Zukunft zur Vergangenheit. Er "kennt" und verwendet die zukünftigen Kursbewegungen bei jedem Balken, bei dem die Geschichte auf der rechten Seite eine ausreichende Anzahl von "kommenden" Balken bietet, d.h. Balken einer Periode oder mehr. Zur Veranschaulichung ist auch die konvent
FREE

Der Elsna ATR ist ein benutzerdefinierter MetaTrader 4-Indikator, der zwei wichtige Funktionen in einem übersichtlichen Chart-Overlay kombiniert: Average True Range (ATR) Anzeige Berechnet den aktuellen ATR-Wert für den ausgewählten Zeitraum (Standard = 14). Kann den Wert in Pips oder Preiseinheiten anzeigen. Kerzen-Countdown-Timer Zeigt einen Live-Countdown an, der angibt, wie viel Zeit bis zum Schließen der aktuellen Kerze verbleibt. Er wird jede Sekunde aktualisiert, auch wenn der Markt ruhig
FREE
Hochgradig konfigurierbare Demarker-Anzeige.
Merkmale: Hochgradig anpassbare Alarmfunktionen (bei Levels, Kreuzen, Richtungsänderungen per E-Mail, Push, Sound, Popup) Multi-Timeframe-Fähigkeit Farbanpassung (bei Pegeln, Kreuzen, Richtungsänderungen) Optionen für lineare Interpolation und Histogramm-Modus Funktioniert im Strategie-Tester im Multi-Timeframe-Modus (auch am Wochenende ohne Ticks) Einstellbare Levels Parameter:
Demarker Timeframe: Sie können den unteren/höheren Zeitrahmen für Demar
FREE

Der Range-Indikator bezeichnet die durchschnittliche tägliche Kursbewegung. Der Einfachheit halber wird er visuell auf den Charts angezeigt, allerdings mit dem Zeitrahmen H4 und darunter. Der Indikator wird täglich neu gezeichnet und die Lücken werden in die Berechnung einbezogen. Eine zusätzliche gepunktete Linie bedeutet, dass 80 % der täglichen Bewegung überschritten wurden. Ein wichtiges Instrument im Arsenal eines professionellen Händlers oder eines, der es werden will. PrimeTools ist eine
FREE

Currency Explorer ist das absolute Werkzeug für Händler, die mit quantifizierter Sicherheit die Stärke und Schwäche jeder Währung kennen und diese mit Hilfe geeigneter Strategien handeln möchten. Unsere maschinellen Lernmodelle laufen und liefern die Stärke/Schwäche jeder Währung auf der Grundlage mehrerer Faktoren neben der Kursentwicklung. Es liefert dem Händler ein QUANTIFIED Ergebnis für die Stärke der 8 beliebtesten und wichtigsten Währungen (EUR, USD, JPY, GBP, AUD, NZD, CAD und CHF) mit e
FREE

Produkttitel Smart Moving Averages (MT4) – Teil der SmartView Indicators Serie Kurzbeschreibung Ein Moving Averages -Indikator mit einzigartiger Benutzererfahrung auf der MetaTrader-Plattform. Bietet erweiterte Funktionen, die zuvor nicht verfügbar waren, wie das Öffnen von Einstellungen per Doppelklick, das Ausblenden und Anzeigen von Indikatoren ohne Löschung und die Anzeige des Indikatorfensters in voller Chartgröße. Entwickelt für nahtlose Zusammenarbeit mit dem Rest der SmartView Indicators
FREE

Chart Time Indicator ist sehr einfach und leicht, aber es kann sehr wichtig sein, die Zeit zu kontrollieren, bevor man einen manuellen Handel eröffnet. Dieser Indikator zeigt die Zeit auf dem Chart zwischen 3 verschiedenen Optionen an.
Eingabeparameter Show Time : Wählen Sie alle Zeitoptionen, die Sie sehen möchten. Lokale Zeit (Personal Computer Time), Server Time (Broker Time) oder GMT Time. Empfehlungen: Verwenden Sie nur einen Chart Time Indicator für jeden Chart.
FREE

AlphaTrend Pro - Erweiterter visueller Trend-Erkennungs-Indikator Produkttitel AlphaTrend Pro - Erweiterte Trend-Erkennung mit kristallklaren visuellen Signalen Kurzbeschreibung AlphaTrend Pro ist ein hochentwickelter Trendfolge-Indikator, der die Volatilitätsanalyse (ATR) mit Momentum-Oszillatoren (RSI/MFI) kombiniert, um dynamische Unterstützungs- und Widerstandsniveaus zu schaffen. Mit großen Richtungspfeilen und einer intelligenten visuellen Positionierung liefert dieser professionelle MT4-I
Der ChartOverlay Indikator hat zwei Hauptfunktionen 1. die Spiegelung - d.h. zum Beispiel, er macht aus EURUSD USDEUR 2. Anzeige des Preisdiagramms des ausgewählten Finanzinstruments (mit ausgewähltem Zeitraum) in einem Unterfenster des Hauptdiagramms. Dieses Tool ermöglicht es Händlern, die Beziehung zwischen verschiedenen Währungspaaren und Vermögenswerten zu analysieren und bietet einzigartige Anpassungs- und Visualisierungsfunktionen. Hauptfunktionen: Preisdiagrammanzeige: Der Indikator zeig
FREE

Der Indikator zeigt die maximale Abweichung vom gleitenden Durchschnitt in einem bestimmten Zeitraum an. Die Begrenzungen des Kanals können als eine Art überkaufte/überverkaufte Zonen dienen, von denen aus ein Preisrückzug zur Mitte des Kanals erfolgen kann. Hinter diesen Niveaus sollten Sie nach zusätzlichen Signalen für den Einstieg in ein Geschäft Ausschau halten. In den Einstellungen des Indikators gibt es nur 2 Parameter - den Zeitraum, für den der Indikator berechnet wird, und die Methode
FREE

Dieser Indikator zeigt den realistischen und präzisen Trend an. Die gezeichnete Linie als Trendindikator ist der beste und sicherste Ort, um den Stop-Loss zu setzen.
Bei einem Aufwärtstrend sehen Sie die gezeichnete Linie unter den Kerzen und bei einem Abwärtstrend befindet sich die gezeichnete Linie auf der oberen Seite der Kerzen. Kaufen Sie die kostenpflichtige Version dieses Indikators, die Statistical Support Resistance heißt.
FREE

Der Indikator basiert auf dem Konzept der Preiskanäle, die durch Aufzeichnung der höchsten Höchst- und niedrigsten Tiefstkurse über einen bestimmten Zeitraum gebildet werden. Der Donchian-Kanal-Indikator besteht aus drei Linien: einer oberen Kanallinie, einer unteren Kanallinie und einer mittleren Kanallinie. Die obere Kanallinie stellt das höchste Hoch über einen bestimmten Zeitraum dar, während die untere Kanallinie das niedrigste Tief darstellt. Die mittlere Kanallinie ist der Durchschnitt de
FREE
Zeigt den aktuellen Spread im Hauptfenster des Charts an. Einstellung des Indikators: BigDisplay =true oder false zum Ein- und Ausschalten.
DisplaySize = 20 ist Standard
DisplayColor = Blue
Display_y = 550 Position: Blickposition Y des Hintergrundpanels
Display_x = 1200 Position: Blickposition X des Hintergrundpanels
Autor: Happy Forex (Expert Advisor - Ihr algorithmusgesteuerter Gewinn, ohne Stress und Arbeit)
FREE

Der Zweck dieser neuen Version des MT4-Standardindikators, der in Ihrer Plattform enthalten ist, besteht darin, in einem Unterfenster mehrere Zeitrahmen desselben Indikators anzuzeigen. Siehe das Beispiel im Bild unten. Aber die Anzeige ist nicht wie bei einem einfachen MTF-Indikator. Dies ist die tatsächliche Anzeige des Indikators in seinem Zeitrahmen. Hier sehen Sie die verfügbaren Optionen des FFx-Indikators: Wählen Sie die anzuzeigenden Zeitrahmen (M1 bis Monthly) Definieren Sie die Breite
FREE

Der Indikator zeigt den Nulldurchgang des Accelerator Oscillator (AC) in Form von Punkten auf dem Chart an. In den Einstellungen des Indikators können Sie die Anzahl der Balken in der Historie angeben, um die Signale anzuzeigen, sowie die Verschiebung der Punkte in Bezug auf einen Balken. Parameter Bars - Anzahl der Bars in der Historie, um die Signale des Indikators anzuzeigen; Verschiebung - Verschiebung der Punkte in Bezug auf die Balken.
FREE

Der Indikator zeigt auf dem Diagramm eine Karte an, auf der Marker die aktuelle Handelssitzung anzeigen, sowie einen Text. Der Indikator bietet zwei Arten der Hintergrundanzeige: weiß und schwarz. Der Indikator wird als Hintergrund angezeigt und behindert nicht die Verfolgung der aktuellen Marktsituation.
Parameter: GMT - die Zeitdifferenz zwischen dem Terminal und GMT. Hintergrund - Auswahl des Hintergrunds - schwarz oder weiß.
FREE
Der Indikator ermöglicht Ihnen den Handel mit binären Optionen. Der empfohlene Zeitrahmen ist М1 und die Verfallszeit ist 1 Minute. Der Indikator ist für den automatischen und manuellen Handel geeignet. Ein mögliches Signal wird als ein Pfeil über/unter einer Kerze angegeben. Sie sollten warten, bis die Kerze geschlossen ist! Die Pfeile werden nicht neu gezeichnet Handelssitzungen: Londoner und New Yorker Abschnitt Währungspaare: EUR/GRB Arbeits-Zeitrahmen: M1 Verfallszeit: 1 Minute Der Indikat
FREE

Die Trendrichtung wird auf der Grundlage parabolischer Daten angezeigt, von der Minute bis zum Monat. Das Diagramm wird von einer Minute bis zum Monat angezeigt, so dass Sie sofort sehen können, in welche Richtung sich der Preis im Moment bewegt. Die Aktualisierungen erfolgen nicht im Tick-Takt, sondern standardmäßig im Sekundentakt und können natürlich geändert werden, so dass die Anzeige des Charts nie verlangsamt wird. Merkmale: Der Chart kann in jeder beliebigen Währung angezeigt werden. Es
FREE

Einführung in Fractal Moving Average Der Indikator Fractal Moving Average wurde als Teil des Fractal Pattern Scanners entwickelt. Innerhalb des Fractal Pattern Scanners wurde der Fractal Moving Average Indikator als eine Vielzahl von Chart-Objekten implementiert. Bei über Tausenden von Chart-Objekten haben wir festgestellt, dass dies nicht die beste und effizienteste Art war, den Indikator zu betreiben. Es war zu rechenintensiv für den Indikator. Daher haben wir uns entschlossen, die Indikatorv
FREE
Beschreibung
Die Grundlage dieses Indikators ist ein ZigZag-Algorithmus, der auf ATR und Fibo-Retracement basiert. Dieser Indikator ist nicht redrawing in dem Sinne, dass die letzte Schulter des ZigZag direkt nach dem Auftreten der entsprechenden Bedingungen auf dem Markt gebildet wird. Die Schulter ändert ihre Richtung danach nicht mehr (kann sich nur fortsetzen). Hinweis: Ein Indikator mit erweiterten Möglichkeiten ist ebenfalls verfügbar.
Eingabeparameter des Indikators
Die Eingabeparamete
FREE

Dieser Indikator hilft Ihnen, überkaufte und überverkaufte Kurse auf der Grundlage des William %R zu finden. Eingabe Beschreibung: WZeitraum: Zeitraum für den %R-Indikator. ÜberkauftLevel: Definieren Sie das überkaufte Niveau für %R. Muss zwischen 0 und -50 liegen. OverSoldLevel: Definieren Sie das überverkaufte Niveau für %R. Muss zwischen -50 und -100 liegen. mittlerer_Wert: Wenn true, zeichnet der Indikator auch die mittleren Punkte zwischen der oberen und unteren Linie. shift: Legt einen zus
FREE

Ein einfacher Informationsindikator, der die verbleibende Zeit bis zur Eröffnung der nächsten Kerze oder des nächsten Balkens anzeigt.
Über das Konzept des Zeitrahmens Ein Zeitrahmen ist das Zeitintervall, das bei der technischen Analyse der freien Finanzmärkte (das gilt auch für den globalen Währungsmarkt) berücksichtigt wird und in dem sich der Preis und andere Marktdaten ändern. Der kleinste Zeitrahmen ist der sogenannte Tick. Ein Zeitrahmen ist das Zeitintervall, das zur Gruppierung von Kur
FREE

Der R Silver Trend Indikator ist ein trendfolgender Handelsindikator, der den aktuellen Trend direkt auf dem Aktivitätsdiagramm von Metatrader 4 anzeigt.
Es zeichnet zwei Arten von Kerzen: Blau steht für bullische Kursbewegungen. Rot für rückläufige Preisbewegung.
Der Handel mit dem R Silver Trend Indikator ist selbst für absolute Anfänger recht einfach und kann für Scalping (M1, M5), Daytrading (M5, M15, M30) und Swingtrading (H1, H4, D1) Währungen verwendet werden.
Grundlegende Handelssign
FREE

USD INDEX
Das Währungsindex-Projekt ist EIN Teil einer gründlichen Devisenstudie. Viele Menschen kennen nicht die theoretische Grundlage, die die Entwicklung der Wechselkurse auf dem Markt bestimmt. Mit diesem Instrumentarium können Sie einen vollständigeren Überblick über den gesamten Markt erhalten, indem Sie nicht nur die einzelne Währung einer Börse, sondern alle Wechselkurse, aus denen sich diese Währung zusammensetzt, in einem einzigen Fenster analysieren!
Der Indikator stellt den realen
FREE
Dieser Indikator analysiert, wie effizient die aktuelle Marktbewegung ist, basierend auf dem tatsächlichen High-Low-Verhältnis einer bestimmten Anzahl von Balken. [ Installationsanleitung | Update-Anleitung | Fehlerbehebung | FAQ | Alle Produkte ] Das Verhältnis ist die Effektivität der Marktbewegung Ein Verhältnis unter 1 bedeutet, dass der Markt nirgendwo hinführt Ein Verhältnis über 1 bedeutet, dass der Markt beginnt, Direktionalität zu zeigen Ein Verhältnis über 2 bedeutet, dass der Markt e
FREE
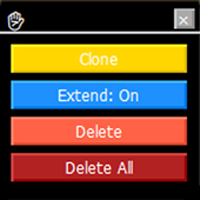
Trendlinien-Werkzeugkasten (MT4) Trendline Toolbox ist ein Hilfsindikator für MetaTrader 4, der bei der Verwaltung von Trendlinien und allgemeinen Chart-Objekten hilft. Er liefert keine Handelssignale und garantiert keine Gewinne. Wichtigste Funktionen Klonen der ausgewählten Trendlinie (Stil, Winkel und Kursniveau bleiben erhalten). Schalten Sie die Eigenschaft "Erweitern" für die ausgewählte Trendlinie ein. Löschen Sie die ausgewählte Trendlinie. Alle Objekte im aktuellen Diagramm löschen. Do
FREE
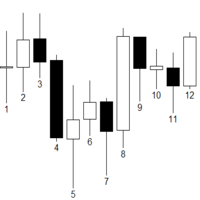
Dieser Indikator ermöglicht es Ihnen, die Balken innerhalb einer Handelssitzung für CFDs zu nummerieren. Er funktioniert auf GER40, UK100, US30, US100 und US500 und ist vollständig anpassbar, um Ihrem Handelsstil und Ihren Chartvorlieben zu entsprechen. Hauptmerkmale & Parameter: Anpassbares Sitzungsintervall: Definieren Sie Ihre eigenen Start- und Endzeiten der Sitzung Option zum Ausblenden gerader Zahlen für einen übersichtlicheren Chart Anpassen des Zahlenabstands : Positionieren Sie die Bar-
FREE
Der MetaTrader Market ist eine einzigartige Plattform für den Verkauf von Robotern und technischen Indikatoren.
Das Merkblatt für Nutzer der MQL5.community informiert Sie über weitere Möglichkeiten: nur bei uns können Trader Handelssignale kopieren, Programme bei Freiberuflern bestellen, Zahlungen über das Handelssystem automatisch tätigen sowie das MQL5 Cloud Network nutzen.
Sie verpassen Handelsmöglichkeiten:
- Freie Handelsapplikationen
- Über 8.000 Signale zum Kopieren
- Wirtschaftsnachrichten für die Lage an den Finanzmärkte
Registrierung
Einloggen
Wenn Sie kein Benutzerkonto haben, registrieren Sie sich
Erlauben Sie die Verwendung von Cookies, um sich auf der Website MQL5.com anzumelden.
Bitte aktivieren Sie die notwendige Einstellung in Ihrem Browser, da Sie sich sonst nicht einloggen können.