Technische Indikatoren für den MetaTrader 4 - 122

Unlock the power of the market with the Investment Castle Multi Time Frame Moving Average Indicator. Simplify your trading journey by easily identifying trends and pullbacks across multiple time frames on one convenient chart. This indicator is a must-have tool for any serious trader. Available for MT4 and MT5, and exclusively on the MQL5 market, customize your experience by adding as many indicators as you need on the chart, each with their own unique time frame or period. Enhance your strategy

Der R Wolfe Wave-Indikator analysiert die Preisbewegung und wandelt die gesammelten Daten in ein leistungsstarkes technisches Werkzeug für Wolfe Wave-Chartmuster um. Im Wesentlichen kann das R-Wolfe-Wellen-Chartmuster entweder zinsbullisch oder bärisch sein und Händlern helfen, Kauf- und Verkaufsgeschäfte ohne nachlaufende Indikatoren zu eröffnen.
Wichtige Punkte Identifiziert starke Wolfe Wave-Muster Für fortgeschrittene Trader Funktioniert für jedes Währungspaar Es lohnt sich, Ihre Indikato

Ein genauer MACD-Indikator ist verfügbar.
Dashboard Trend Bar Smart Level 9TF Double MACD. Dual MACD, d.h. schnell (MACD 1) & langsam (MACD 2) Warum brauchen Sie einen zweiten MACD? Die Verwendung zusätzlicher Indikatoren wird uns im Live-Handel mehr überzeugen 9TF Fast MACD 1-Kurve 9TF Langsame MACD 2-Kurve 9TF MACD-Winkel in Echtzeit 9TF MACD-Wert in Echtzeit 9TF-Echtzeit-MACD-RichtungEin genauer MACD-Indikator ist verfügbar.
Dashboard Trend Bar Smart Level 9TF Double MACD. Dual MACD, d.h

Ein genauer stochastischer Indikator ist verfügbar.
Dashboard Trend Bar Smart Level 9TF Dual Stochastic. Dual Stochastic, d. h. Fast Stochastic & Slow Stochastic Warum brauchen Sie die zweite Stochastik? Die Verwendung zusätzlicher Indikatoren wird uns im Live-Handel mehr überzeugen 9TF Fast Stochastic-Kurve 9TF Langsame stochastische Kurve 9TF Stochastischer Winkel in Echtzeit 9TF Echtzeit-Stochastikwert 9TF Echtzeit Stochastische Richtung/Phase 9TF Trendleiste Neuer Algorithmus bei der Bere
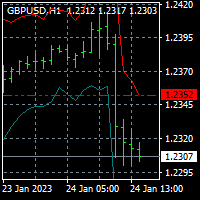
For MT5 version please click here . This is the exact conversion from TradingView: "Average True Range Stop Loss Finder" By "veryfid". - This indicator implements a deviation channel. - The channel determines trend direction as well as stop loss placement. - This is a non-repaint and light processing load indicator. - You can message in private chat for further changes you need.

Shows the price fluctuation bands associated with a moving average. It is extremely accurate, and it's a wonderful visual guide. The indicator consists of 4 bands . The two bands closest to the price form the fluctuation channel , they mark the maximum calculated deviation of the price from the moving average. The outer bands mark the maximum overdeviation of the price with respect to the fluctuation channel, they are overbought or oversold areas. Features. -The change of periods of the MA is d

Dieser Indikator verwendet mehrere Indikatoren, um hochgewinnende Signaltrades zu generieren Der R-Signals-Indikator ist ein komplettes FX-Handelssystem, das genaue Kauf- und Verkaufspfeile auf dem Chart druckt.
Der Indikator erscheint im Hauptfenster des MT4-Charts als farbige grüne und rote Pfeile.
Die Verwendung von Signalen, die von einem einzelnen Indikator generiert werden, kann beim Handel riskant sein. Dies liegt daran, dass die Verwendung von nur einem Indikator für den Handel mehr
This Amazing Signal Entry indicator is designed for signal trading. This indicator generates trend signals.
It uses many algorithms and indicators to generate this signal. It tries to generate signals from the points with the highest trend potential.
This indicator is a complete trading product. This indicator does not need any additional indicators.
The indicator is never repainted. The point at which the signal is given does not change. When the signal comes the arrows are put back

CFF Way Up Trading System
CFF Way Up is the best trading System for Reversal & Trend Following whether you are scalper trader, Medium trader or Long Term trader, It’s providing marvelous trading signals based on such and amazing algorithm.
*** 3 Copies left for next price $690***
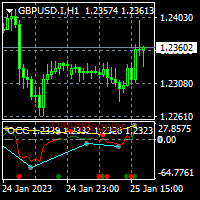
For MT5 version please click here . This is the exact conversion from TradingView: "Open Close Cross Alert R6.2 by JustUncleL" By "JayRogers". - This indicator does not support multi-time frame. - Hidden/Regular divergences supported. - This is a non-repaint and light processing load indicator. - You can message in private chat for further changes you need.
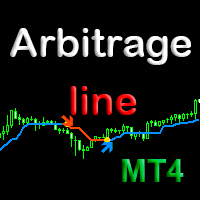
Индикатор Arbitrage line является арбитражным корреляционным мультивалютным индикатором. Он показывает на текущем графике места нарушения корреляции - где направление движения цены текущего графика, противоположно направлению цены любой выбранной в индикаторе валютной пары. Arbitrage line идеально подходит для торговли при помощи арбитража корреляции на любых символах ( поддерживаемых Meta Trader) валют, металлов, криптовалют, акций и индексов. Места дисбаланса - нарушения корреляции, индикато

Der R 2EMA Color Indikator für MT4 liefert solide Handelssignale basierend auf dem Crossover von 2 EMAs.
Wichtige Punkte Wenn der Preis die beiden grünen EMAs kreuzt und über ihnen schließt, erzeugt dies ein Kaufhandelssignal. Wenn der Preis die beiden roten EMAs kreuzt und über ihnen schließt, entsteht ein Verkaufssignal. Der R 2EMA Color Forex Indikator macht es noch einfacher festzustellen, wann es Zeit zum Kaufen und Verkaufen ist
Ein Kaufsignal tritt auf, wenn die 2 EMA-Linien grün wer

Der R Var Moving Average Indicator ist ein Trendfolgeindikator, der für eingefleischte Trendfolger entwickelt wurde.
Es ist ein sehr beliebter Devisenhandelsindikator unter Aktienhändlern sowie Rohstoffhändlern, und seine Popularität ergibt sich aus seiner Fähigkeit, seinen Benutzern echte Signale zum Geldverdienen zu liefern.
Der Indikator besteht aus grünen und roten Punkten, die auf einer Sienna-Linie platziert sind. Der grüne Punkt zeigt auf ein bullisches Signal, während der rote Punkt

UR-Gamma (unterstützt durch ähnliche Berechnungen, die in maschinellen Lernsystemen zu finden sind)
UR Gamma ist ein hochmodernes Finanzanalysetool, das eine neue und verbesserte Interpretation des klassischen WaveTrend-Indikators bietet. Durch die Integration fortschrittlicher digitaler Signalverarbeitungstechniken adressiert UR Gamma einige der Einschränkungen traditioneller WaveTrend-Algorithmen und bietet einen genaueren, robusteren und dynamischeren Ansatz zur Identifizierung und Messung

Der R Wavy Dash Indikator verwandelt Preisdaten in einen hervorragenden Trendfolgesignalindikator, der für den Einstieg und Ausstieg aus dem Handel funktioniert. Es erscheint im Hauptdiagramm als farbige Signallinie und kann als eigenständiges Handelstool verwendet werden.
Der R Wavy Dash Indikator ist sehr zuverlässig, leicht und wird Ihre Handelsplattform nicht verlangsamen.
Wichtige Punkte Trendsignalanzeige Anfängerfreundlich Nicht neu lackieren Es lohnt sich, Ihre Indikatorsammlung zu
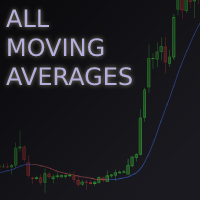
The ALL MOVING AVERAGES Metatrader 4 Custom Indicator provides a comprehensive suite of moving averages for technical analysis offering over 31 of the most popular moving averages .
All of these averages can be customized to fit various trading strategies , with users able to choose from a variety of input parameters including period and price calculation types.
The indicator also provides a smooth charting experience , with users having the ability to toggle between chart styles, turn t

Deviation has a buy and sell input. Figure out the number to trade by. It is according to MACD. Study the values of the past for inputs to trade by. Use in uptrend or downtrend and follow the bigger trend for entry points or reversals. Use other filters or strategies to employ with the indicator for success. - is buy and + is sell. Trade on time frames according to your wish
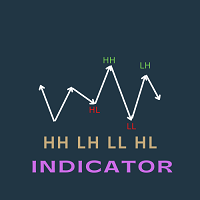
This indicator is very useful to identify the most important patterns of price action strategy. It uses the fractal indicator to identify the highs and lows. It can identify the following four patterns to identify continuation and reversal of a trend Patterns shown in the chart Higher Highs Lower Highs Lower Lows Higher Lows These patterns are visible in the chart . and the most interesting part of this indicator is all of these patterns are stored in different buffer values. Developers can util

Der R Show Ticks-Indikator für Metatrader 4 zeigt die Aufwärts-/Abwärts-Ticks in Echtzeit im Haupthandelsfenster.
Die zentralen Thesen Ein weißer Pfeil ist ein Aufwärtstrend. Ein roter Pfeil ist ein Abwärtsstrich. Der Indikator funktioniert für jedes Währungspaar und jeden Zeitrahmen Ihrer Wahl.
Indikatorspezifikationen Handelsplattform: Entwickelt für Metatrader 4 (MT4)
Währungspaare: Funktioniert für jedes Paar
Zeitrahmen: Funktioniert für jeden Zeitrahmen
Eingabeparameter: Eingabes
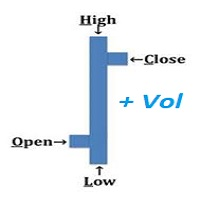
An "Intraday" indicator makes no sense anymore above H1 !! VOHLC is calculated using the following formula: VOHLC= ( Price * Volume ) / Volume Where Price= ( Open + High + Low + Close ) / 4 Volume= Tick Volume This indicator helps us to understand the current direction of the trend in the selected period. Typically, the indicator is calculated for one day, so there is no reason to use it on timeframes larger than the H1 timeframe.
This is a breakout Indicator for MT4 where you can open trades after a breakout has occurred. This indicator will draw blue boxes on the chart. You simply have to follow price until it breaks out of the box and make sure that the candle had closed above the breakout if its a buy trade and the candle must close below if its a sell trade. An alert will now pop up with suggested price entry and TP of 15 pips default. You can change TP Pis depending on your choice The indicator can trade almost any

Der R Delta RSI-Indikator zeichnet ein farbiges Kauf- und Verkaufshistogramm basierend auf dem Crossover eines schnellen RSI (Periode 14) und eines langsamen RSI (Periode 50) zusammen mit einem Signalpegel.
Ein rot gefärbtes Histogramm zeigt an, dass der Trend bullisch ist (Kaufsignal). Ein grün gefärbtes Histogramm zeigt an, dass der Trend rückläufig ist (Verkaufssignal). Ein graues Histogramm zeigt an, dass der Trend flach oder bereichsgebunden ist (kein Signal).
Dieser Forex-Indikator ka
UR-Bänder (mit einer Formel, die in maschinellen Lernsystemen verwendet wird)
UR Bands ist ein Indikator, der durch eine Formel abgeleitet wird, die die Marktvolatilität berücksichtigt und im Prinzip denen ähnelt, die in maschinellen Lernsystemen verwendet werden. Diese mathematische Darstellung der Marktbedingungen bietet eine präzise Analyse von Preistrends und -dynamiken unter Berücksichtigung der inhärenten Volatilität der Finanzmärkte. Durch die Einbeziehung der Volatilität als Variable
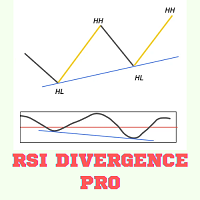
RSI DIVERENCE INDICATOR
RSI divergence is very powerful pattern which is often used to detect a strong trend reversal. it also indicates the weakening of strong signal. So some traders want to use it as the exit criteria. This indicator works in all timeframe and send notification, alert or email to the user. It also show the Higher Highs and Lower Low Pattern with its corresponding RSI divergency. This indicator can be used in Expert Advisors as it has accessible buffers List of Inputs _____
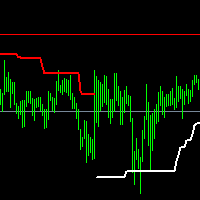
SPT is a trend indicator It is written on the basis of ATR, with clear trend lines indicating the direction in progress, Different traders' understanding of this indicator may form two different purposes Trend-based traders will conduct trend trading when the trend line changes, Respectful shock traders will carry out range trading according to the final support or resistance level marked by this indicator
The index parameters are as follows: Multiplier: multiple of ATR Period: ATR cycle. The

The True Hero Oscillator indicator is designed for signal trading. This indicator generates trend signals.
It uses many algorithms and indicators to generate this signal. It tries to generate signals from the points with the highest trend potential.
This indicator is a complete trading product. This indicator does not need any additional indicators. This product uses 3 main indicators and many algorithms.
The indicator is never repainted. The point at which the signal is given does no
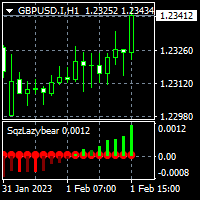
For MT5 version please click here . - This is the exact conversion from TradingView source: "Squeeze Momentum Indicator" By "LazyBear". - This is a non-repaint and light processing load indicator. - Buffers and inputs are available for use in EAs and optimization purposes. - You can message in private chat for further changes you need.
Thanks for downloading...

UR Vortex
The Probabilistic UR Vortex Formula: An Accurate System for Predictive Market Analysis using Volatility and Standard Deviation Calculations. The UR Vortex indicator is a technical analysis tool that uses volatility and standard deviation calculations to predict potential tops and bottoms in a market. It measures the strength of a trend by calculating the distance between the current price and a moving average, and then standardizing this distance by dividing it by the average true

Contact me after payment to send you the User-Manual PDF File. Harmonic Trading The secret is the Fibonacci. It has been proven in the markets that price always reacts to Fibonacci levels. Fibonacci levels are one of the most important indicators of price changes. Sometimes the sequence of reactions to these levels in the chart make geometric shapes, which are called harmonic patterns. The price creates harmonic patterns with its fluctuation and reaction to Fibonacci levels. Harmonic patterns c

Wenn Sie oft Trades verlieren, weil Sie nur einen Indikator verwenden, dann probieren Sie dieses Handelstool aus. Dieses Handelstool verwendet mehr als einen Indikator. Ich beobachte oft Händler, die nur den RSI-Indikator verwenden. Sehr oft ist der Markt überverkauft, aber immer noch im Minus, oder der Markt ist überkauft, aber immer noch im Plus. Aus diesem Grund müssen Sie mehr als einen Indikator verwenden. Wir stellen die neue Version V 3.40 MTF PPAAF vor: Multi Time Frame Precise Price Ac
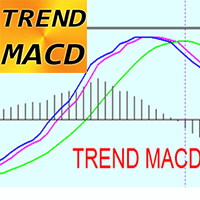
T REND MACD Indicator for MT4 - is great & efficient trading tool! This indicator is great for Trend Traders who are focused to catch big price movements TREND MACD consist of 3 lines: Green line - shows main trend direction , and Blue & Magenta lines for entry and exit. Indicator allows to maximize profit - not to exit from profitable trade too early Indicator has built-in Mobile and PC alerts
HOW TO USE indicator (see pictures): 1) Check if Blue & Magenta lines both are above Green

Zweck/Ziel Dies ist ein speziell für Intraday-/Trend-Trader entwickelter Multi-Timeframe-Moving-Average-Indikator. Informiert den Händler über den Trend im H4-Zeitrahmen, unabhängig vom Zeitrahmen auf dem Chart, während der Händler Einstiegs- und Ausführungsniveaus in den niedrigeren Zeitrahmen identifiziert. Geeignet für den Multi-Frame & Trend Trader. Zusatzfunktionen Umschalttaste, um saubere Chat-Ziele beizubehalten. Zusätzlicher MA-Indikator für den aktuellen Zeitrahmen auf dem Chart, der a

UR PulseScalp Ein kalibrierter Handelsindikator für Scalper, die den ultimativen Vorteil in schnelllebigen Märkten suchen
UR PulseScalp ist eine hochmoderne Handelslösung für Scalper, die den ultimativen Vorteil in schnelllebigen Märkten suchen. Dieser innovative Indikator basiert auf einer wissenschaftlich kalibrierten Formel, die die Kraft von Volatilität, MoneyFlow und Relative Strength kombiniert, um ein hochpräzises und zuverlässiges Signal zu erzeugen.
Vorteile der Verwendung von UR

Contact me after payment to send you the User-Manual PDF File. 5W Pattern introduction The 5W pattern occurs when the price forms an alternating 5-wave cycle with its volatility. In fact, the 5W pattern is a price series of alternating HH or LL (higher high or lower low), which is the main characteristic of a trend. The pattern of 5W should have the characteristic of non-overlapping waves, also the points of the pattern are usually formed in Fibonacci levels. The completed pattern of 5W actua

MACD (short for M oving A verage C onvergence/ D ivergence) is a popular trading indicator used in technical analysis of securities prices. It is designed to identify changes in the strength, direction, momentum, and duration of a trend in a security's price.
History Gerald Appel created the MACD line in the late 1970s. Thomas Aspray added the histogram feature to Appel's MACD in 1986.
The three major components and their formula 1. The MACD line: First, "PM Colored MACD" employs two Movin

Signal trend indicator for scalping. Has three different sensitivity options
It detects a trend change and gives signals to open positions.
Has built-in audio and visual trend change alerts. Can send notifications to your phone or email. Allows you to open positions in a timely manner in accordance with the direction of the market. Works on all timeframes, on all currency pairs, metals, indices and cryptocurrencies. Can be used when working with binary options. Distinctive features Does no

MACD Color for GOLD Use for looking moving-way of graph and checking will be buy or sell Easy for looking by see the color of trand. Red is down / Blue is up. Can to use it with every time-frame by 1. Long Trade : Use it with time-frame H1 / H4 / Daily 2.Short Trade : Use it with time-frame M5 / M15 / M 30 / H1 and you can see when you will open or close the orders by see this indicator by well by see signal line cut with color line again in opposite. and you can use this indicator for

Sniper Zones are our best kept secret for trading the forex markets profitably and extremely simple ! After years of profitable trading we are launching it to the public !
After thousands of hours of testing, we have developed an indicator that simplifies trading to the point where anyone can become a profitable trader. There exists certain zones and areas in the market that are used by institutions to move price and cause retail traders to lose their money ! We have done the hard work and mad
RumahForexID Momentum Scalping Indicator is the best momentum indicator ever created, and why is that? The indicator works on all timeframes and assets, the indicator is made after 6 years of experience in forex. You know many momentum indicators on the internet are unhelpful, and difficult to trade, but RumahForexID Momentum Scalping Indicator is different , The indicator shows wave momentum, when the market is about to trend or consolidate, all that in one simple and clear indicator!
RumahF
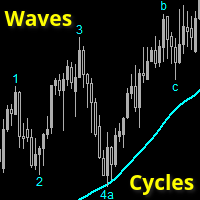
Wave and Cycle counter to give an immediate indication how far the ongoing trend has progressed.
Low numbers: trend has just started, ride the trend. Higher numbers: trend is 'older', watch for reversals
This indicator is 100% compatible with the fantastic TopDog trading strategy.
(I will NOT give any details about this Top Dog strategy)
The trend direction is determined by a SMA value (or any other MA) you can set.
Waves and cycles numbers and letters are derived from a SlowStoch setting

To get access to MT5 version please click here . - This is the exact conversion from TradingView: "Twin Range Filter" by " colinmck ". - This is a light-load processing and non-repaint indicator. - All input options are available. - Buffers are available for processing in EAs. - You can message in private chat for further changes you need. Thanks for downloading

Key Level Key Level is a MetaTrader 4 Indicator that uses a proprietary algorithm based on Price Retracement/Breakout Method to show the Entry-Line on your trading.
Instead, it analyzes data of market and identify entry points and opportunities. (Price Retracement / Price Breakout)
It's also a trading tool that be used to practice and enhance your manual trading skills.
Key Level is an amazing tool for Scalping Trader. It also a trading tool that be used to practice and enhance your manual t

Momentum Breakout Finder (MoBlast) is an indicator based on Volume to find the when the current pair is making breakout and when market are range bound. Oscillators Indicators like RSI, MACD that works fine for an interval of the market, it fails to generate profitable signals when the market conditions change, and hence it produces wrong signals resulting in big losses. This indicator implements an volume logic algorithm that finds the best breakout of the symbol. When an arrow signal appears

Valentines trend is an easy-to-use indicator that hides a powerful calculation math-system "under the hood". Attach the indicator to the chart and set the parameters. Period - period for tracking changes in quotes Amount of Bars - number of last bars to track You do not need to select any numerical parameters. The indicator will do everything for you automatically . Each signal is generated on the current bar, and in order not to miss it, use the built-in alerts and notifications system . The in
Современный индикатор паттерна Ключевой разворот. Имеет настройки таймфрейма. Можно настроить количество баров для отображения индикатора на графике. Индикатор предпочтительно использовать на часовом таймфрейме и выше, но работает и ниже. Подходит для использования с любой стратегией. Условие отображения: какой таймфрейм указали в настройках, галочку во вкладке отображение ставим там же. Для фильтра можно использовать скользящую среднюю.

Volume predictor is an essential indicator if you trade with volumes, this indicator predicts the final volume of the current candle and increases it's precision as the time goes by. In order to predict the final volume the current volume and market conditions are used, the predicted volume adjust in real time. You can change every individual color of the indicator to your liking, the default colors were assigned to be easy on your eyes while using a dark theme. Don't forget to leave your revie

"BUYUK SAVDOGAR" TM has developed this strategy to support all who trade binary options.
This trading system determines the state of imbalance in the market based on volume analysis. The most convenient point for opening a trade is an imbalance situation. The trading system independently allocates an imbalance zone. Issues a warning (alert) in the desired direction.
The terms of trade are very simple. We are waiting for directions. We open a deal on the current timeframe in the direction.

Современный индикатор паттернов PinBar по торговой стратегии RAIT. Работает по тренду и без него. Имеет настройки таймфрейма для отображения. Можно настроить количество баров для отображения индикатора на графике. Используется несколько паттернов PinBar. Индикатор предпочтительно использовать на часовом таймфрейме и выше, но работает и ниже . Паттерны: PinBar, InsPinBar, PinInside. Отображаются одной стрелкой.
This Harmony Cross Signal indicator is designed for signal trading. This indicator generates trend signals.
It uses many algorithms and indicators to generate this signal. It tries to generate a signal from the points with the highest trend potential.
This indicator is a complete trading product. This indicator does not need any additional indicators.
The indicator certainly does not repaint. The point at which the signal is given does not change.
Features and Suggestions T

PURCHASE THIS INDICATOR AND GET OUR SECRET BONUS! Why is TREND Important? This is one of the biggest questions asked by beginner traders. Trend is important because that is primarily when the market moves the most. When a market has good volume, many banks, hedgefunds and large institutions are participating and driving price up or down in strong trends. THIS IS THE PERFECT TIME TO TRADE. The uGenesys Multi-Trend Indicator was specifically designed to identify when a trend has started in the ma

The RSI and Moving Average Indicator is a powerful tool for any trader looking to take their technical analysis to the next level. With the RSI as the main indicator, you will have access to a clear and accurate representation of the strength of the current market trend. The addition of the moving average line adds another level of insight, providing a smoothed view of the RSI that helps to identify longer-term trends and potential buying or selling opportunities. Whether you are a day trader, s
Super Magic Signal indicator is designed for signal trading. This indicator generates trend signals.
It uses many algorithms and indicators to generate this signal. It tries to generate a signal from the points with the highest trend potential.
This indicator is a complete trading product. This indicator does not need any additional indicators.
The indicator certainly does not repaint. The point at which the signal is given does not change.
Features and Suggestions Time Frame:

Sharp Transition is a new product that allows you to identify the current market phase (uptrend, downtrend or flat). Represents a typical investor strategy that usually indicates a trend change from bearish to bullish. A tool that allows you to determine the direction and strength of a trend. Unlike most indicators, Sharp Transition finds longer trends and gives fewer false signals.
This indicator displays arrows of different colors depending on the current state of the market and thus signal
If you do not have your own trading strategy yet, you can use our ready-made trading strategy in the form of this indicator. The Your Trends indicator tracks the market trend, ignoring sharp market fluctuations and noise around the average price.
The indicator is based on price divergence. Also, only moving averages and a special algorithm are used for work. It will help in finding entry points in the analysis and shows favorable moments for entering the market with arrows. Can be used as a f
The ORB The Opening Range Breakout or the OPR 'Open Price Range' MT5 Indicator is a powerful tool designed to enhance your trading experience by automatically tracking market openings range , custom ranges, sessions, and Asian ranges. This dynamic indicator is perfect for price action traders, offering unparalleled precision and accuracy without any manual effort. Key Features: London ORB The Opening Range Breakout : Automatically displays the London open price range. New York ORB The Ope

The Trend PT indicator tracks market trends, ignoring sharp fluctuations and market noise. The indicator can work both for entry points and as a filter.
The Trend PT indicator displays information in a visual way. It will help in finding entry points in the analysis. Suitable for trading on low timeframes because it ignores sudden price spikes or corrections in price action by reducing market noise around the average price.

This indicator takes input from the RSI and a trend filter, and presents the output in a separate indicator window as a histogram. Great for scalping. Settings: No need to set up the indicator. Features Alerts. How to use: Simply attach to any chart Zoom chart in to get a better view of the histo color. Buy: Blue histo color on multiple timeframes. (e.g,. M30-H1-H4) Sell: Red histo color across on multiple timeframes.
Or backtest and use as you see fit for your strategy. Best results on Majo

With the help of the Impulses Enter forex indicator algorithm, you can quickly understand what kind of trend is currently developing in the market. The Elephant indicator accompanies long trends, can be used without restrictions on instruments or timeframes. With this indicator, you can try to predict future values. But the main use of the indicator is to generate buy and sell signals. The indicator tracks the market trend, ignoring sharp market fluctuations and noises around the average price.

We publish the indicator as a useful tool in trading and call this indicator the "Swiss Army Knife" because it provides many possibilities and combinations to help understand the material on the "Masters of Risk" trading system. The indicator itself is not part of the tools used in the "Masters of Risk" trading system.
The indicator consists of 3 separate multi-timeframe indicators, which in combination with each other help to reduce the "noise" of false signals. The first of the indicators ar

This indicator takes input from the RSI and a trend filter, and presents the output in a separate indicator window as a histogram. Great for scalping. Settings: TrendPeriod RSIPeriod Features Alerts. How to use: Simply attach to any chart Zoom chart in to get a better view of the histo color. Buy: Blue histo color on multiple timeframes. (e.g,. M30-H1-H4) Sell: Red histo color across on multiple timeframes.
Or backtest and use as you see fit for your strategy. Best results on Major Pairs, bu

This indicator offers a unique perspective; it looks a lot like Envelopes but is totally different.
The default parameters are the same as I use in my strategies, every day and with all pairs, although each pair has its own characteristic.
By changing the parameters you can enter Fibonacci levels that you prefer, I use 0.5/1.0/1.5 which equals 50/100/150 .
NO-REPAINT unlike other similar indicators Hot Range does not redraw level lines, I use a simple strategy, when the 1.5 level is reach

Der Standardindikator Relative Strength Index (RSI), bei dem wir Benachrichtigungsfunktionen zu Telefon und E-Mail hinzugefügt haben. In den Indikatoreinstellungen können Sie die Ober- und Untergrenze des Indikators festlegen, bei deren Erreichen der Indikator Ihnen eine Benachrichtigung an Ihr Telefon und Ihre E-Mail sendet. Die Benachrichtigung wird im folgenden Format gesendet: Währungspaar + Zeitraum + Benachrichtigungszeit. Wenn Sie diesen kostenlosen Standardindikator in Ihrer Handelsstra
One of the basic needs of every trader is to have a checklist to enter every position. Of course, using pen and paper may not be convenient forever. With this indicator, you can have a small checklist next to the screen for each of your charts and use it for better use in your trades. MT5 Version This indicator will have many updates and special settings will be added to it.
You can contact us via Instagram, Telegram, WhatsApp, email or here. We are ready to answer you.
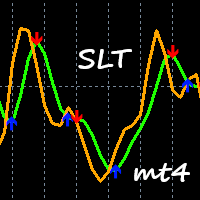
This indicator takes input from a trend filter and 2 oscillators, and presents the output in a separate indicator window as 2 lines and arrows. Great for scalping. Settings: No need to set up the indicator. Features Alerts. How to use: Simply attach to any chart Zoom chart in to get a better view of the lines. Buy: Blue arrow. Best results when entering buys above the 0.00 level, and confirming on higher timeframes too. Sell: Red arrow. Best results when entering sells below the 0.00 level, a

The TrendChangeZone indicator displays global and local price highs and lows on the chart. The indicator also shows the global trend on the chart and corrective waves. This indicator is designed to determine the direction and change the trend. Most importantly, the indicator shows trend continuation or reversal zones. An indispensable assistant in trading. The indicator does not redraw. The indicator can work on all trading instruments.
Important !!! Top trend if 2 (two) or more blue segments
You can identify the strength of the main forex currencies with this tool. You can combine it with different styles and get the best strategy out of it. It has very high power. It can be customized.
MT5 version
This indicator will have many updates and special settings will be added to it.
You can contact us via Instagram, Telegram, WhatsApp, email or here. We are ready to answer you.

Support and resistance are the basic and widely used trading strategies in the financial trading world. The Support and Resistance indicator for MetaTrader is the best technical tool for identifying potential areas of a support or resistance zone. The indicator is a multi-timeframe indicator that automatically scans through different timeframes for support&resistance zones. It displays lines of the support&resistance zones of a specified period in all the time frames. This implies that the indi
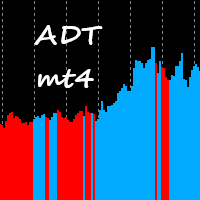
This indicator takes input from Accumulation/Distribution and a trend filter, and presents the output in a separate indicator window as a histogram. Great for scalping. Settings: TrendPeriod Features Alerts. How to use: Simply attach to any chart with default setting, or set the TrendPeriod to your preference. Zoom chart in to get a better view of the histo color. Buy: Blue histo color on multiple timeframes. (e.g., M30-H1-H4-D) Sell: Red histo color on multiple timeframes.
Or backtest and u

System 17 with ATR Strategy is a trend-Momentum system filtered by volatility. Averange true range is the indicator of volatility that I use as filter. Best time frame for this trading system is 30 min. Currency pairs: EUR/USD, USD/CAD, USD/JPY, AUD/USD, GBP/USD, GBP/JPY, NZD/USD, EUR/JPY. Metarader Indicators: System 17 (trend following indicator with arrow buy and sell), this indicator is formed by moving average 12 period, close, Bollinger Bands period 8, deviation 0.75, Moving average 21

You have made a great decision to try this powerful indicator. The FX Turbo is a supreme forex trading indicator that will help you achieve your financial goals on currency market. In this post you will learn how to use and trade with FX Turbo Marksman indicator. Recommended Timeframe
This indicator was optimized for 1-hour timeframe but you can successfully use it on any timeframe as well. Generally speaking higher timeframes are for swing trading and and lower timeframes are for scalping.
MetaTrader Market - der einzige Shop, in dem man Handelsroboter als Demoversion herunterladen und testen sowie anhand historischer Daten optimieren kann.
Lesen Sie die Beschreibung und Bewertungen anderer Kunden über das gewünschte Produkt, laden Sie es direkt ins Terminal herunter und erfahren Sie, wie man einen Handelsroboter vor dem Kauf testet. Nur bei uns können Sie ein Programm testen, ohne dafür zu bezahlen.
Sie verpassen Handelsmöglichkeiten:
- Freie Handelsapplikationen
- Über 8.000 Signale zum Kopieren
- Wirtschaftsnachrichten für die Lage an den Finanzmärkte
Registrierung
Einloggen
Wenn Sie kein Benutzerkonto haben, registrieren Sie sich
Erlauben Sie die Verwendung von Cookies, um sich auf der Website MQL5.com anzumelden.
Bitte aktivieren Sie die notwendige Einstellung in Ihrem Browser, da Sie sich sonst nicht einloggen können.