Multiple Timeframe VWAP indicator

Auftrag beendet

Ausführungszeit 5 Tage
Bewertung des Entwicklers
He know what he exactly wants and gives you comfort during job to lead a very good result. You love to code for him. thanks him
Bewertung des Kunden
Awesome developer who will evaluate the logic of your program, point out any potential glance, and even be very patient to solve your code bug issues. A high-quality developer who I recommended.

Spezifikation

I would like to create a volume weight average price (VWAP) indicator for multiple timeframe. My standard is the VWAP is calculated either starting with daily, weekly, monthly, quarterly or yearly basic. Below is the general formula for the VWAP. Formula from the past developer on the VWAP can be share as well.


To simplify my requirement, I will put it into bullets points 

  1. The VWAP indicators will reset based on daily basic ( Default - can set to make changes). When new days reached, the VWAP will begin from 0 again.
  2. I need an inputs that can allow me the period of resetting, just use period timeframe, where i can choose for it to reset on daily, weekly, monthly, quarterly or yearly basic.
    1. To ease the change after the putting into the chart, create 5 button where i can easily navigate between desire VWAP period on the chart. Put the button at the bottom left of the chart with the follow shortcut name. ( Font size 10 - Customisable)
    2. D = Daily (reset every day)
    3. W = Weekly  (reset every week)
    4. M = Monthly  (reset every month)
    5. Q = Quarterly (reset every quarter - 1-3, 4-6, 7-9, 10-12)
    6. Y = Yearly (reset every year)
  3. Follow the math equation above to calculate the center or VWAP lines (Formula will given)
    1. When VVWAP is decreasing = Red Colour
    2. When VVWAP is increasing = Lime Colour
    3. vwap_style = STYLE_SOLID
    4. vwap_width = 2
    5. Volume calculation is based on Tick volume
    6. Input: Price data based on current price mode (Close, Median, Typical etc. - Standard price mode)
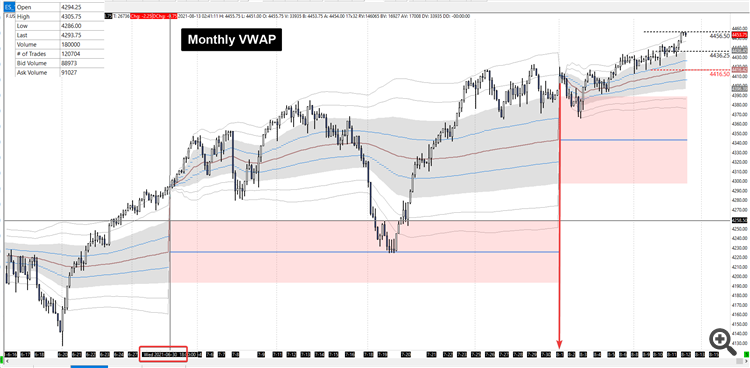
  4. The standard deviation, SD bands (upside and downside) is measured using the  standard deviation of the price to the VWAP (1.0, 2.0)
    1. Past developer code will be share
    2. By default I only need 1.0 and 2.0 SD. But give it 2 more float input so i can key in whenever i need it. Meaning, there will be 4 level of SD
      1. 0.5 - No show
      2. 1.0 - Show
      3. 1.5 - No show
      4. 2.0 - Show
      5. I can choose whenever want to show the 0.5 or 1.5 or not. Also, I can make change of the number maybe 0.5 -> 0.75 (so make it into setting that i can change later)
    3. Allow me to change the style of the SD style, and this is the default
      1. band_color = clrWhite
      2. band_style = STYLE_DASHDOT
      3. band_width = 1
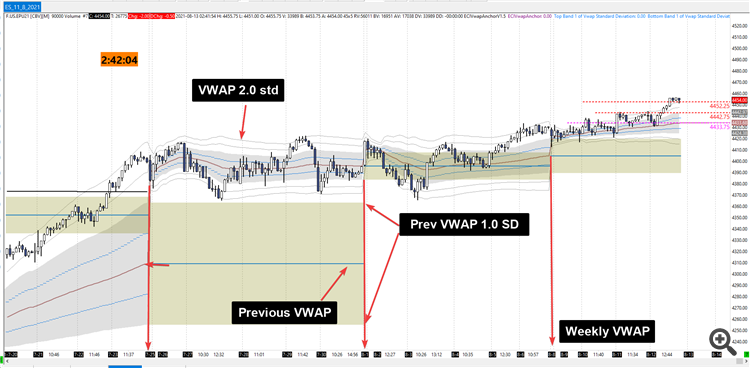
  5. A rectangle box will plot from previous VWAP1.0 SD and all the way to the future next VWAP reset period. Below are the design (all the settings below make available in the input section)
    1. style=STYLE_SOLID
    2. width=1
    3. fill=true
    4. selection=false
    5. Colour will different from each VWAP timeframe
      1. D = clrNavy
      2. W = clrDarkGoldenrod
      3. M = clrMaroon
      4. Q = clrIndigo
      5. Y = clrMidnightBlue
    6. A horizontal Solid trend line will plot from the previous VWAP value. The style just follow back the existing VWAP colour.
  6. Input: Period count - For the case where the calculation of VWAP on entire chart will be time consuming, by default let it only count on past 30 daysof VWAP. The '30' (count in day) is the inputs I can define later
    1. Suppose at least 1 VWAP period should plot out
  7. If the data is insufficient for higher period (such as Quarter or Yearly) display the message at TOP RIGHT prompt user to go M1 chart and down load the data until XX date.
    1. Note the highlighted is the input
    2. M1 = data source using now
    3. XX date = if is yearly then need to download the data all the way back to 01.01.2021
    4. I will be very appreciate if the developer knows the way to automatically download the data for the user.
  8. When changing VWAP timeframe option, previous VWAP object should be clear.
  9. When new candle generated the VWAP calculations MUST UPDATE CORRECTLY


Expected Outcome:


Note: The graphic display i know may be a little bit different but similar result is needed.


Question:

  1. Is it possible to have multiple timeframe VWAP display all together?
  2. Is there any thing that is unclear?

Send me an answer so that I know you did read through and understand the requirement


I do not accept indicator code that is generated.


Highly welcome developer that is communicative and experience in MQL indicator. Please communicate with me on your experience so I know if you are suitable in working with this project or not.

Source code is needed by the end of the project.

Bewerbungen

1
Entwickler 1
Bewertung
(115)
Projekte
129
18%
Schlichtung
11
27% / 55%
Frist nicht eingehalten
4
3%
Frei
2
Entwickler 2
Bewertung
(126)
Projekte
160
36%
Schlichtung
4
25% / 50%
Frist nicht eingehalten
13
8%
Frei
3
Entwickler 3
Bewertung
(63)
Projekte
84
26%
Schlichtung
23
22% / 48%
Frist nicht eingehalten
23
27%
Frei
4
Entwickler 4
Bewertung
(21)
Projekte
24
17%
Schlichtung
15
20% / 40%
Frist nicht eingehalten
6
25%
Frei
5
Entwickler 5
Bewertung
(586)
Projekte
1047
49%
Schlichtung
39
28% / 41%
Frist nicht eingehalten
49
5%
Frei
6
Entwickler 6
Bewertung
(71)
Projekte
97
43%
Schlichtung
2
50% / 0%
Frist nicht eingehalten
2
2%
Frei
7
Entwickler 7
Bewertung
(41)
Projekte
88
14%
Schlichtung
30
30% / 53%
Frist nicht eingehalten
36
41%
Arbeitet
8
Entwickler 8
Bewertung
(563)
Projekte
932
47%
Schlichtung
301
59% / 25%
Frist nicht eingehalten
124
13%
Arbeitet
9
Entwickler 9
Bewertung
(66)
Projekte
143
34%
Schlichtung
10
10% / 60%
Frist nicht eingehalten
26
18%
Frei
Ähnliche Aufträge
I want a program that will help calculate and enter the market on full margin for me. I just need to put in the price for entry, Stop loss and TP then it will calculate the lot sizes for entering the trade on full margin on Mt5
are you aware of the Monday Range Strategy? https://www.youtube.com/watch?v=7B_yBBFx6z8 5pm EST time sunday - monday 5pm est and it has to be on the H1 chart , minimum 1:2 Risk to reward and break even function after 1:1
Starting from scratch, I need a solution to develop my own crypto trading and exchange platform. This platform should compare prices across various exchanges like Coinbase, Binance, KuCoin, and Unocoin, as well as different cryptocurrencies. The solution must identify opportunities to buy on one platform and sell on another for a profit, transferring funds to my personal wallet instantly for security. The bot should
looking for help to get my ibkr automated, i have strategies already built in composer and have JSON for them, i really just need to he setup and explanation on how to maintain it and add new strategies
I am looking for someone who has experience working with the ZigZag indicator. I want to create a multi timeframe dashboard scanner based on ZigZag. I will explain more in private messages. if you feel capable & interest with that,please pm me for more details. thanks
Specify your Requirements Specification here point by point. Try to describe your requirements briefly and clearly, so that your potential developer is able to correctly assess its complexity and cost, as well as the required execution time. A bad or too generic description will result in your order being ignored, or you will spend a lot of time negotiating the details with each applicant. Remember: It is better to
I wish an indicator that can import data from the websites below: https://www.fastbull.com/speculative-sentiment?textType=1&amp ;id=-1 https://www.fxblue.com/market-data/tools/sentiment After importing the data. I want the developer to create a simple text dashboard showing at least the major pairs in Forex with the correspondent sentiment from each website. The format of the dashboard or its visual aspects do not
Hi I need a software like Mirror trade copier ( https://www.antonnel.net/mirror/ ) which directly connect to the Accounts over api with out MT4 terminal and copies trades from mater to client. I want the same and possible improvement like can be accessed over a url and dashboard for some basic metrics (optional)
Hey, I would like an indicator based on calculation with the last price, sort of fib. The lines will auto update based on actual price. I want you to create 3x this block(of line), lines positions will be diferent as the multiplier of the 3 blocks will not be the same. I want you to create a signal based on the price that will be at the same zone(inside 2 lines) in 3 blocks at same time. check the intruction.txt
I need a AI signal generating bot for forex trading. The bot should operate such that when i put it in a chart it will analyse the market, after several minutes it will display whether the trade is buying or selling. It should display the one minute, five minute,15minute, 30 minute, one hour, 4 hours and daily time frame whether they are buying or selling. If it is buying the arrow should be green and if it is

Projektdetails

Budget
50 - 100 USD
Für die Entwickler
45 - 90 USD
Ausführungsfristen
von 3 bis 5 Tag(e)