仕事が完了した
指定
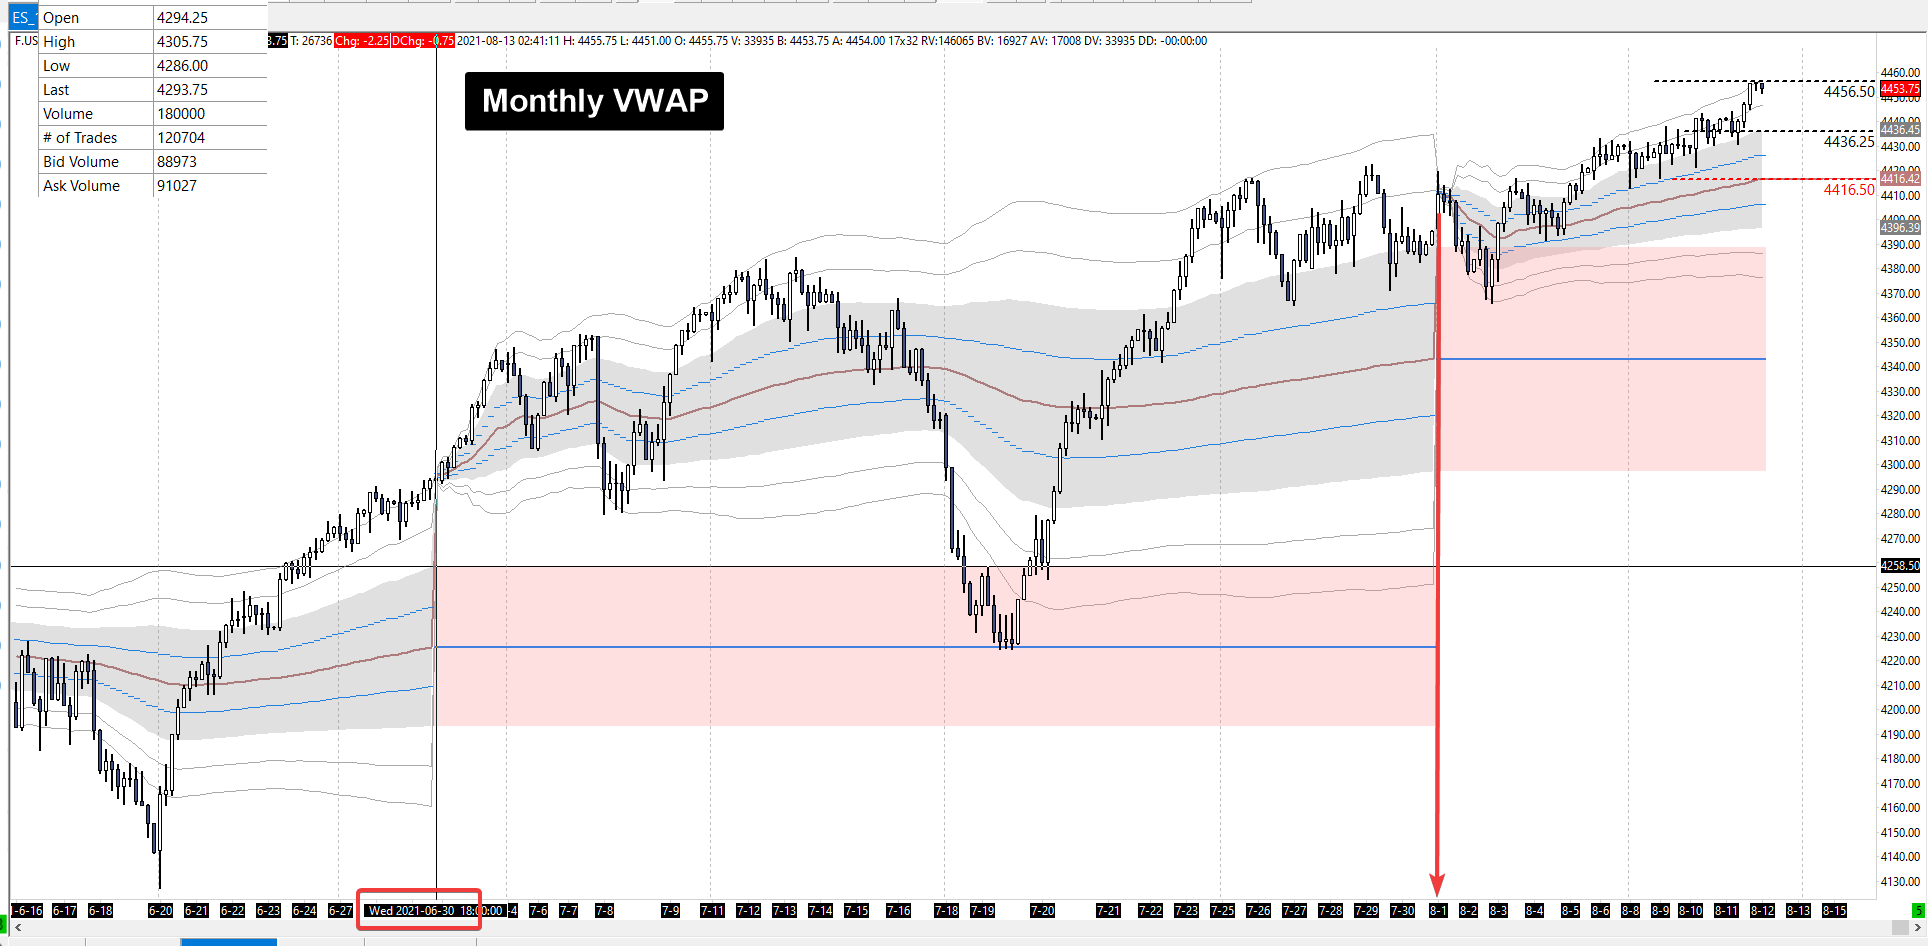
I would like to create a volume weight average price (VWAP) indicator for multiple timeframe. My standard is the VWAP is calculated either starting with daily, weekly, monthly, quarterly or yearly basic. Below is the general formula for the VWAP. Formula from the past developer on the VWAP can be share as well.
To simplify my requirement, I will put it into bullets points
- The VWAP indicators will reset based on daily basic ( Default - can set to make changes). When new days reached, the VWAP will begin from 0 again.
- I need an inputs that can allow me the period of resetting, just use period timeframe, where i can choose for it to reset on daily, weekly, monthly, quarterly or yearly basic.
- To ease the change after the putting into the chart, create 5 button where i can easily navigate between desire VWAP period on the chart. Put the button at the bottom left of the chart with the follow shortcut name. ( Font size 10 - Customisable)
- D = Daily (reset every day)
- W = Weekly (reset every week)
- M = Monthly (reset every month)
- Q = Quarterly (reset every quarter - 1-3, 4-6, 7-9, 10-12)
- Y = Yearly (reset every year)
- Follow the math equation above to calculate the center or VWAP lines (Formula will given)
- When VVWAP is decreasing = Red Colour
- When VVWAP is increasing = Lime Colour
- vwap_style = STYLE_SOLID
- vwap_width = 2
- Volume calculation is based on Tick volume
- Input: Price data based on current price mode (Close, Median, Typical etc. - Standard price mode)
- The standard deviation, SD bands (upside and downside) is measured using the standard deviation of the price to the VWAP (1.0, 2.0)
- Past developer code will be share
- By default I only need 1.0 and 2.0 SD. But give it 2 more float input so i can key in whenever i need it. Meaning, there will be 4 level of SD
- 0.5 - No show
- 1.0 - Show
- 1.5 - No show
- 2.0 - Show
- I can choose whenever want to show the 0.5 or 1.5 or not. Also, I can make change of the number maybe 0.5 -> 0.75 (so make it into setting that i can change later)
- Allow me to change the style of the SD style, and this is the default
- band_color = clrWhite
- band_style = STYLE_DASHDOT
- band_width = 1
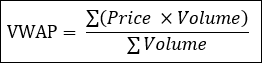
- A rectangle box will plot from previous VWAP1.0 SD and all the way to the future next VWAP reset period. Below are the design (all the settings below make available in the input section)
- style=STYLE_SOLID
- width=1
- fill=true
- selection=false
- Colour will different from each VWAP timeframe
- D = clrNavy
- W = clrDarkGoldenrod
- M = clrMaroon
- Q = clrIndigo
- Y = clrMidnightBlue
- A horizontal Solid trend line will plot from the previous VWAP value. The style just follow back the existing VWAP colour.
- Input: Period count - For the case where the calculation of VWAP on entire chart will be time consuming, by default let it only count on past 30 daysof VWAP. The '30' (count in day) is the inputs I can define later
- Suppose at least 1 VWAP period should plot out
- If the data is insufficient for higher period (such as Quarter or Yearly) display the message at TOP RIGHT prompt user to go M1 chart and down load the data until XX date.
- Note the highlighted is the input
- M1 = data source using now
- XX date = if is yearly then need to download the data all the way back to 01.01.2021
- I will be very appreciate if the developer knows the way to automatically download the data for the user.
- When changing VWAP timeframe option, previous VWAP object should be clear.
- When new candle generated the VWAP calculations MUST UPDATE CORRECTLY
Expected Outcome:
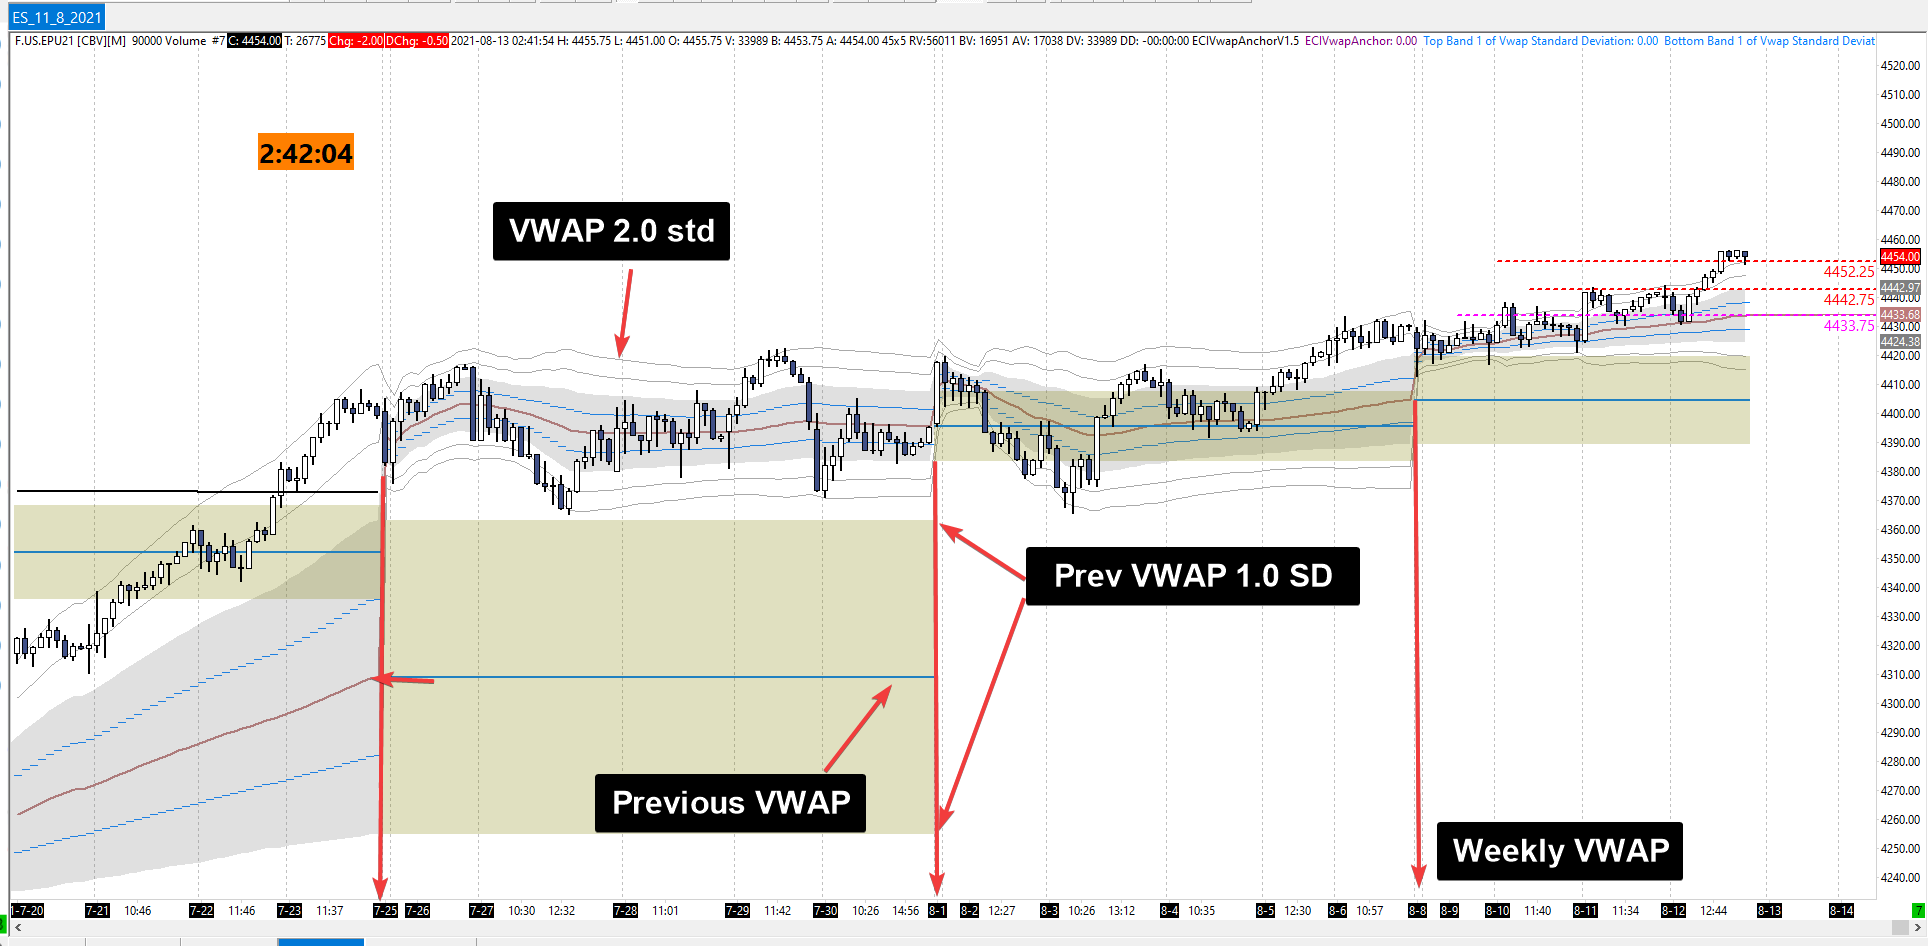
Note: The graphic display i know may be a little bit different but similar result is needed.
Question:
- Is it possible to have multiple timeframe VWAP display all together?
- Is there any thing that is unclear?
Send me an answer so that I know you did read through and understand the requirement
I do not accept indicator code that is generated.
Highly welcome developer that is communicative and experience in MQL indicator. Please communicate with me on your experience so I know if you are suitable in working with this project or not.
Source code is needed by the end of the project.